
Electronic Toll Collection Market Size 2026-2030
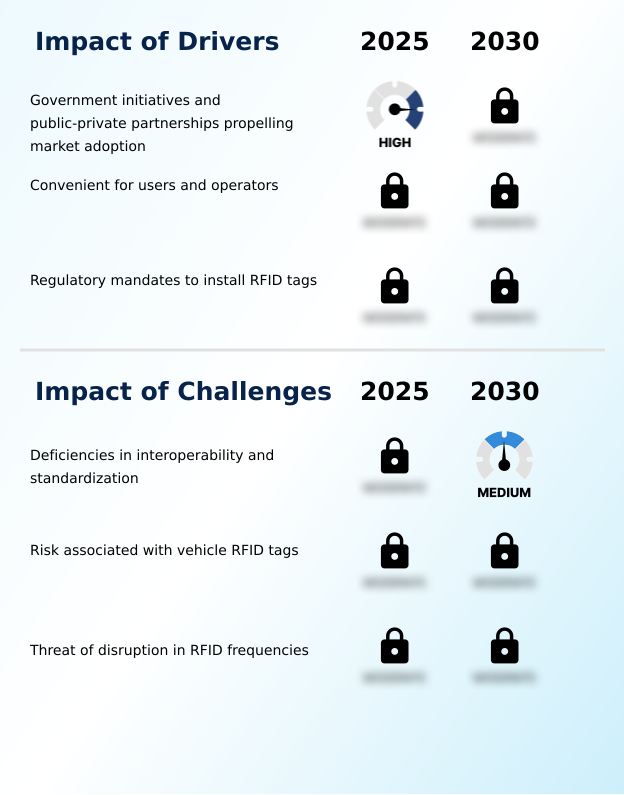
The electronic toll collection market size is valued to increase by USD 11.41 billion, at a CAGR of 12.8% from 2025 to 2030. Government initiatives and public-private partnerships propelling market adoption will drive the electronic toll collection market.
Major Market Trends & Insights
- APAC dominated the market and accounted for a 38.2% growth during the forecast period.
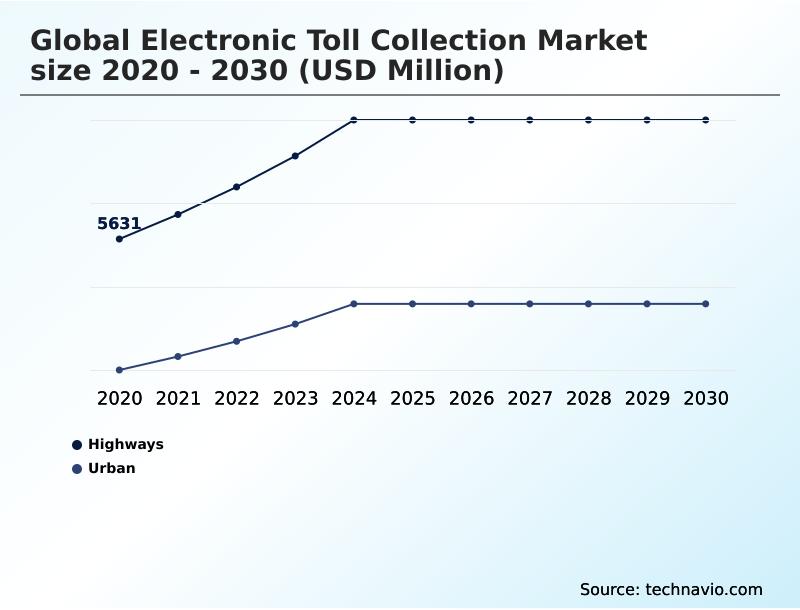
- By Application - Highways segment was valued at USD 8.15 billion in 2024
- By Technology - RFID-based segment accounted for the largest market revenue share in 2024
Market Size & Forecast
- Market Opportunities: USD 16.74 billion
- Market Future Opportunities: USD 11.41 billion
- CAGR from 2025 to 2030 : 12.8%
Market Summary
- The electronic toll collection market is undergoing a significant transformation, driven by the global imperative to enhance transportation efficiency and sustainability. Core to this evolution is the transition from manual booths to automated, free-flow systems that leverage technologies such as radio frequency identification (RFID) and global navigation satellite systems (GNSS) for seamless vehicle identification and payment processing.
- A primary market driver is the increasing pressure on urban centers to alleviate traffic congestion, which automated tolling directly addresses by maintaining vehicle flow and reducing travel times. This trend is complemented by government mandates for modernizing infrastructure and adopting intelligent transportation systems.
- As an example, a logistics firm can optimize its fleet operations by using integrated toll management platforms that provide a single, itemized bill for an entire fleet traversing multiple toll networks, eliminating administrative burdens and enabling better route planning. However, the market faces challenges related to system interoperability, where different regional standards can create complexity for cross-jurisdictional travel.
- Data security and privacy also remain critical concerns as these systems collect vast amounts of vehicle and payment information, necessitating robust protection measures to maintain public trust and ensure regulatory compliance.
What will be the Size of the Electronic Toll Collection Market during the forecast period?

Get Key Insights on Market Forecast (PDF) Get Free Sample
How is the Electronic Toll Collection Market Segmented?
The electronic toll collection industry research report provides comprehensive data (region-wise segment analysis), with forecasts and estimates in "USD million" for the period 2026-2030, as well as historical data from 2020-2024 for the following segments.
- Application
- Highways
- Urban
- Technology
- RFID-based
- DARC
- Others
- Type
- AVIS
- AVC
- VES
- Others
- Geography
- APAC
- China
- India
- Japan
- Europe
- Germany
- France
- UK
- North America
- US
- Canada
- Mexico
- South America
- Brazil
- Argentina
- Middle East and Africa
- Saudi Arabia
- UAE
- South Africa
- Rest of World (ROW)
- APAC
By Application Insights
The highways segment is estimated to witness significant growth during the forecast period.
The highways segment remains a primary application area, driven by the need for enhanced traffic flow optimization. Transportation network modernization focuses on deploying all-electronic tolling and multi-lane free-flow environments.
These highway tolling solutions utilize automatic vehicle classification to apply varied rates, supported by a robust violation enforcement system.
The successful implementation of cashless tolling, a key part of smart mobility infrastructure, has demonstrated an ability to improve revenue collection integrity, with certain systems achieving a reduction in processing errors by over 15%.
This shift is integral to achieving goals for vehicle emissions reduction and is supported by public-private partnerships, which fund the required backend processing systems and contactless payment technology for seamless operation.
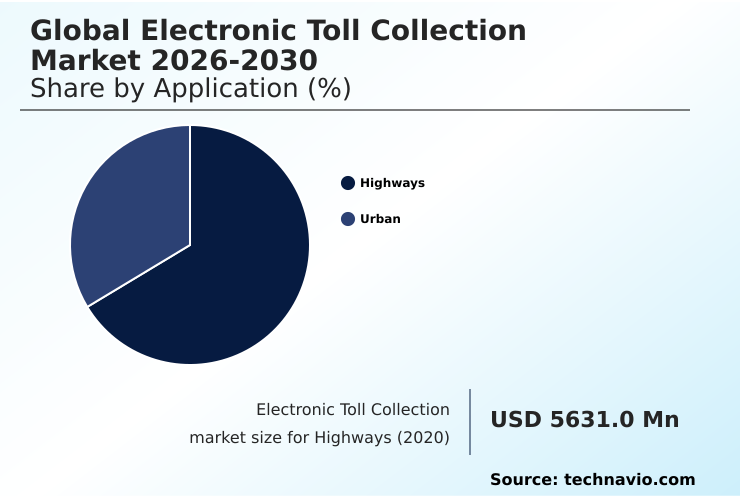
The Highways segment was valued at USD 8.15 billion in 2024 and showed a gradual increase during the forecast period.
Regional Analysis
APAC is estimated to contribute 38.2% to the growth of the global market during the forecast period.Technavio’s analysts have elaborately explained the regional trends and drivers that shape the market during the forecast period.

See How Electronic Toll Collection Market Demand is Rising in APAC Get Free Sample
The geographic landscape is characterized by varied adoption rates, with APAC emerging as the fastest-growing region, with some forecasts projecting growth rates exceeding 13%. This expansion is driven by massive transportation network modernization and urban traffic management projects.
In contrast, North America exhibits more moderate growth, around 11.4%, as it focuses on achieving interoperability. The European market is advancing barrier-free tolling through technologies like vehicle-to-everything communication. Deployments universally depend on core components like rfid transponders and gantry-based readers.
The goal across all regions is to implement effective revenue assurance mechanisms to combat revenue leakage prevention. Technologies like loop sensor detection and video-based tolling are being used to enhance automatic number plate recognition systems and improve accuracy.
Market Dynamics
Our researchers analyzed the data with 2025 as the base year, along with the key drivers, trends, and challenges. A holistic analysis of drivers will help companies refine their marketing strategies to gain a competitive advantage.
- The strategic implementation of advanced tolling requires a focus on specific technological and operational configurations. The deployment of rfid based automatic vehicle identification remains a foundational approach, but the market is increasingly exploring gnss based distance-based tolling for more equitable road usage charging. This shift necessitates robust dsrc for vehicle-to-infrastructure communication to enable a connected ecosystem.
- A successful multi-lane free-flow system implementation is a key objective for reducing congestion, which relies heavily on the accuracy of anpr for violation enforcement systems. From a policy perspective, achieving national tolling interoperability is a significant hurdle, as is managing interoperability in cross-border tolling. Technologically, integrating mobile payments with etc is becoming standard practice to enhance user convenience.
- The operational benefits of open-road tolling for congestion reduction are well-documented, with some projects reducing traffic delays by over 40% during peak hours compared to plaza-based systems. This efficiency is enhanced by real-time analytics for traffic management. Security is paramount, demanding secure transaction processing in tolling and addressing concerns about data privacy in electronic tolling.
- The industry is also witnessing a pivot towards satellite-based toll collection systems, which promise to eliminate most physical infrastructure. The role of ppps in toll infrastructure is crucial for funding these expensive upgrading legacy tolling systems. Operationally, effective rfid tag lifecycle management, ensuring high vehicle classification accuracy in mlff, and employing sophisticated backend systems for toll reconciliation are essential.
- Finally, leveraging video analytics in toll enforcement and applying dynamic pricing for urban congestion represent advanced strategies for modern traffic management.
What are the key market drivers leading to the rise in the adoption of Electronic Toll Collection Industry?
- Government initiatives and the increasing use of public-private partnership models to fund modern transportation infrastructure are key drivers accelerating market adoption.
- Government mandates for congestion mitigation strategies are a primary driver, compelling the adoption of account-based tolling and automatic vehicle identification systems.
- The financial viability of these large-scale projects is often secured through innovative transportation funding models and the operational expertise supplied by private sector partners.
- These initiatives aim to establish a fully integrated open-road tolling environment, which has been shown to decrease travel times on certain corridors by over 20%.
- The technology facilitates road usage charging and is built upon core components like on-board units and roadside units. The need for logistics efficiency improvement is also a significant factor, pushing for widespread system-wide integration.
- The implementation of digital lane systems and secure payment gateway infrastructure is crucial for ensuring both efficiency and user trust.
What are the market trends shaping the Electronic Toll Collection Industry?
- Government initiatives focused on infrastructure modernization represent a primary market trend. These efforts are driving the widespread adoption of automated and cashless tolling systems to improve transportation efficiency.
- A key trend is the adoption of dynamic pricing models, enabled by intelligent transportation systems, to manage urban congestion in real time. The integration with smart city integration frameworks is becoming standard, leveraging data-driven traffic analytics for better urban planning.
- The move towards distance-based charging, utilizing technologies like global navigation satellite system, offers more equitable tolling and has shown potential to reduce unnecessary travel by up to 10%. As part of this evolution, single-lane free-flow systems are being deployed as precursors to fully open-road environments.
- These advancements rely on a robust regulatory compliance framework and are often part of broader sustainable transport initiatives. The technology is also enhancing fleet management solutions, as real-time transaction processing and unified billing simplify operations. This shift supports toll policy enforcement and improves toll collection efficiency.
What challenges does the Electronic Toll Collection Industry face during its growth?
- The lack of system interoperability and uniform technological standards across different regions and authorities presents a primary challenge affecting industry growth.
- A significant challenge is achieving seamless interoperability standards, which is essential for effective cross-border tolling and creating a frictionless user experience. The lack of uniformity requires complex dispute resolution services and creates hurdles for supply chain optimization.
- The technological fragmentation across regions, with coexisting systems like radio frequency identification and dedicated short-range communication, complicates efforts to establish a national interoperability mandate. This fragmentation can increase operational costs for fleet operators by up to 15% due to the need for multiple on-board devices.
- Ensuring robust data encryption protocols and addressing public concerns over data privacy are critical for maintaining trust. Furthermore, managing toll violation processing across disparate systems adds another layer of complexity for authorities and customer service centers.
Exclusive Technavio Analysis on Customer Landscape
The electronic toll collection market forecasting report includes the adoption lifecycle of the market, covering from the innovator’s stage to the laggard’s stage. It focuses on adoption rates in different regions based on penetration. Furthermore, the electronic toll collection market report also includes key purchase criteria and drivers of price sensitivity to help companies evaluate and develop their market growth analysis strategies.

Customer Landscape of Electronic Toll Collection Industry
Competitive Landscape
Companies are implementing various strategies, such as strategic alliances, electronic toll collection market forecast, partnerships, mergers and acquisitions, geographical expansion, and product/service launches, to enhance their presence in the industry.
ABERTIS INFRAESTRUCTURAS S.A. - Delivers end-to-end electronic tolling solutions, including multi-lane free-flow systems, advanced vehicle classification, and integrated traffic management for modern transportation infrastructure.
The industry research and growth report includes detailed analyses of the competitive landscape of the market and information about key companies, including:
- ABERTIS INFRAESTRUCTURAS S.A.
- Cubic Corp.
- EFKON GmbH
- FEIG ELECTRONIC GmbH
- Kapsch TrafficCom AG
- Mitsubishi Heavy Ltd.
- Perceptics Inc.
- Q Free ASA
- Quarterhill Inc.
- RTX Corp.
- SICE TyS
- Siemens AG
- Star Systems Intl. Ltd.
- TECSIDEL S.A
- Thales Group
- Toshiba Corp.
- TransCore
Qualitative and quantitative analysis of companies has been conducted to help clients understand the wider business environment as well as the strengths and weaknesses of key industry players. Data is qualitatively analyzed to categorize companies as pure play, category-focused, industry-focused, and diversified; it is quantitatively analyzed to categorize companies as dominant, leading, strong, tentative, and weak.
Recent Development and News in Electronic toll collection market
- In August 2025, the North Carolina Turnpike Authority is slated to launch the world's first production-ready Vehicle-to-Everything toll collection system, facilitating direct communication between vehicles and infrastructure to eliminate the need for traditional tags.
- In September 2024, Neology strengthened its end-to-end tolling offerings through the acquisition of P Square Solutions, augmenting its operational and service capabilities.
- In October 2024, a US transportation program announced the allocation of over $96.5 million in grants to sixteen states for projects designed to enhance travel experiences on highways using innovative technologies.
- In November 2024, TransCore was selected by Ausol Autopistas del Sol to modernize its electronic toll collection network in Argentina using its advanced Radio Frequency Identification technology.
Dive into Technavio’s robust research methodology, blending expert interviews, extensive data synthesis, and validated models for unparalleled Electronic Toll Collection Market insights. See full methodology.
| Market Scope | |
|---|---|
| Page number | 286 |
| Base year | 2025 |
| Historic period | 2020-2024 |
| Forecast period | 2026-2030 |
| Growth momentum & CAGR | Accelerate at a CAGR of 12.8% |
| Market growth 2026-2030 | USD 11407.3 million |
| Market structure | Fragmented |
| YoY growth 2025-2026(%) | 11.7% |
| Key countries | China, India, Japan, South Korea, Australia, Indonesia, Germany, France, UK, Italy, Spain, The Netherlands, US, Canada, Mexico, Brazil, Chile, Argentina, Saudi Arabia, UAE, South Africa, Egypt and Turkey |
| Competitive landscape | Leading Companies, Market Positioning of Companies, Competitive Strategies, and Industry Risks |
Research Analyst Overview
- The evolution of the market is defined by a push toward full system-wide integration, underpinned by several key technologies and operational goals. Core components include on-board units and rfid transponders, with advanced dual-frequency transponders enabling greater functionality. The primary technology, radio frequency identification, is increasingly supplemented by dedicated short-range communication and global navigation satellite system solutions.
- For enforcement, systems rely on automatic number plate recognition and sophisticated video-based tolling. Architecturally, a centralized server architecture supports real-time transaction processing via digital lane systems and gantry-based readers, often using loop sensor detection for accuracy. The goal is achieving seamless multi-lane free-flow or single-lane free-flow operations through all-electronic tolling.
- This shift to cashless tolling and account-based tolling facilitates advanced dynamic pricing models and precise distance-based charging. Boardroom decisions are now heavily influenced by the need for robust revenue assurance mechanisms to ensure toll collection efficiency, which has been shown to improve revenue capture by up to 5% by minimizing leakage.
- Strategic objectives focus on traffic flow optimization and congestion mitigation strategies, which also contribute to vehicle emissions reduction. A violation enforcement system is crucial, managed through dedicated revenue transaction centers. Ensuring data integrity requires strong data encryption protocols and a secure payment gateway for all user account management.
- The biggest hurdle remains establishing universal interoperability standards for true automatic vehicle identification and automatic vehicle classification.
What are the Key Data Covered in this Electronic Toll Collection Market Research and Growth Report?
-
What is the expected growth of the Electronic Toll Collection Market between 2026 and 2030?
-
USD 11.41 billion, at a CAGR of 12.8%
-
-
What segmentation does the market report cover?
-
The report is segmented by Application (Highways, and Urban), Technology (RFID-based, DARC, and Others), Type (AVIS, AVC, VES, and Others) and Geography (APAC, Europe, North America, South America, Middle East and Africa)
-
-
Which regions are analyzed in the report?
-
APAC, Europe, North America, South America and Middle East and Africa
-
-
What are the key growth drivers and market challenges?
-
Government initiatives and public-private partnerships propelling market adoption, Deficiencies in interoperability and standardization
-
-
Who are the major players in the Electronic Toll Collection Market?
-
ABERTIS INFRAESTRUCTURAS S.A., Cubic Corp., EFKON GmbH, FEIG ELECTRONIC GmbH, Kapsch TrafficCom AG, Mitsubishi Heavy Ltd., Perceptics Inc., Q Free ASA, Quarterhill Inc., RTX Corp., SICE TyS, Siemens AG, Star Systems Intl. Ltd., TECSIDEL S.A, Thales Group, Toshiba Corp. and TransCore
-
Market Research Insights
- The market's trajectory is shaped by deep integration with intelligent transportation systems and smart mobility infrastructure. Implementation of end-to-end tolling solutions is accelerated through public-private partnerships vital for transportation network modernization. While highway tolling solutions focus on efficiency, urban traffic management remains a priority.
- A key goal is achieving a national interoperability mandate for seamless cross-border tolling, guided by a strict regulatory compliance framework. This fosters an open-road tolling environment enabling barrier-free tolling, aligning with cashless payment ecosystems and mobile payment integration. Commercial benefits include enhanced fleet management solutions and logistics efficiency improvement.
- Using data-driven traffic analytics improves infrastructure asset management, while customer service centers and backend processing systems handle toll violation processing. This entire framework, crucial for revenue leakage prevention and toll policy enforcement, supports new transportation funding models, sustainable transport initiatives, and full smart city integration using contactless payment technology.
- Systems have shown the ability to reduce violation rates by over 10% through improved enforcement.
We can help! Our analysts can customize this electronic toll collection market research report to meet your requirements.
 RIA -
RIA - 
