Garbage Truck Market Size 2025-2029
The garbage truck market size is forecast to increase by USD 5 billion at a CAGR of 5.4% between 2024 and 2029.
- The market is experiencing significant growth due to the global trend of increasing urbanization, which generates a higher demand for waste management solutions. A notable trend in the market is the rising preference for electric garbage trucks, as environmental concerns and stricter emissions regulations drive the shift towards sustainable transportation. However, the high initial costs associated with modern garbage trucks, including the investment in advanced technologies and infrastructure, pose a challenge for market growth. Regulatory hurdles, such as varying standards and certifications across regions, also impact adoption. Mobile apps and online platforms facilitate online ordering and delivery, further enhancing the customer experience. Automation and technology trends, including seasonality-driven apps, have streamlined operations.
- Supply chain inconsistencies, including raw material availability and logistical challenges, temper growth potential. To capitalize on market opportunities, companies must focus on cost reduction strategies, collaborative partnerships, and innovation in technology to address these challenges and meet the evolving needs of customers. Effective operational planning and strategic business decisions are crucial for navigating the complexities of the market.
What will be the Size of the Garbage Truck Market during the forecast period?

- In the dynamic waste management industry, garbage truck innovations continue to shape the landscape with the integration of waste management software and smart city initiatives. Environmental impact analysis is a key focus, driving the adoption of green technology in garbage truck technology. Zero-emission and fuel-efficient garbage trucks are leading the charge, supported by waste reduction strategies and sustainable waste disposal solutions. Route planning optimization and waste data analytics are essential tools for waste management regulations compliance. Recycling technologies and waste-to-energy conversion are also gaining traction in the market.
- Garbage truck financing, certification, leasing, and advanced compaction systems further enhance the efficiency and effectiveness of waste management infrastructure. Together, these trends are transforming the waste management sector towards a more sustainable and efficient future.
How is this Garbage Truck Industry segmented?
The garbage truck industry research report provides comprehensive data (region-wise segment analysis), with forecasts and estimates in "USD million" for the period 2025-2029, as well as historical data from 2019-2023 for the following segments.
- Type
- Rear loader
- Front loader
- Side loader
- End-user
- Municipal
- Industrial
- Distribution Channel
- Offline
- Online
- Technology
- Diesel
- CNG/LNG
- Electric
- Hybrid
- Geography
- North America
- US
- Canada
- Europe
- France
- Germany
- UK
- APAC
- Australia
- China
- India
- Japan
- South Korea
- Rest of World (ROW)
- North America
By Type Insights
The rear loader segment is estimated to witness significant growth during the forecast period. In the waste management industry, garbage trucks play a crucial role in collecting and transporting various types of waste, including municipal and construction waste, to disposal sites. The market for these vehicles is dynamic, with several trends shaping its evolution. Rear loaders, a common type of garbage truck, are designed with a large opening at the back for easy waste disposal. Some models come equipped with an automated lifting mechanism that simplifies the emptying process for large containers, reducing the need for manual labor. Smart waste management systems are increasingly being integrated into garbage trucks to optimize routes and improve overall efficiency.
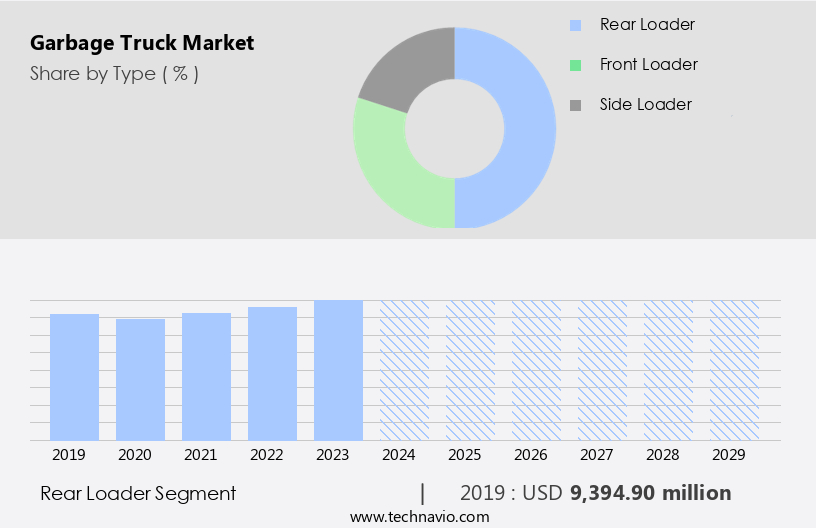
The Rear loader segment was valued at USD 9.39 billion in 2019 and showed a gradual increase during the forecast period. Autonomous garbage trucks are also gaining traction, offering potential fuel savings and reduced operating costs. Fuel efficiency is a significant consideration in the market, with many manufacturers focusing on developing vehicles that consume less fuel. Environmental regulations and safety standards are driving the adoption of technologies such as hydraulic systems with automatic compaction and GPS tracking. Landfill diversion is another key trend, with recycling centers playing an essential role in reducing the amount of waste sent to landfills. Payload capacity and fleet management are also critical factors, with vehicle weight and commercial waste collection being significant considerations. Industrial waste and hazardous materials require specialized handling and disposal methods, necessitating the use of dumping mechanisms and operator training. Alternative fuels and compaction ratios are also important factors in the market, with electric garbage trucks and maintenance services rounding out the landscape. The market for garbage trucks is diverse and constantly evolving, with a focus on reducing emissions, increasing efficiency, and improving safety.
Regional Analysis
APAC is estimated to contribute 41% to the growth of the global market during the forecast period. Technavio's analysts have elaborately explained the regional trends and drivers that shape the market during the forecast period.

The market is witnessing significant growth, particularly in the Asia Pacific (APAC) region. Driven by urbanization and population expansion, countries in APAC, including China and India, are experiencing a surging demand for efficient waste management solutions. China, home to the world's largest population, is confronting formidable waste management challenges, leading to increased adoption of advanced garbage truck technologies to address this issue. India, characterized by its growing population and expanding urban areas, is making substantial investments in waste management infrastructure, creating lucrative opportunities for the regional market. Government initiatives play a pivotal role in shaping the APAC market.
Advanced garbage truck technologies, such as autonomous vehicles, smart waste management systems, and electric trucks, are gaining popularity due to their fuel efficiency, extended service life, and reduced emissions. These innovations are essential in meeting the demands of waste disposal and waste collection, particularly in densely populated areas. Additionally, the integration of GPS tracking, lift systems, and automatic compaction enhances fleet management and optimizes waste disposal routes. Municipal waste and construction waste are the primary focus of the market, with payload capacities and vehicle weight being critical factors. Commercial waste and industrial waste also contribute significantly to the market, necessitating robust hydraulic systems and dumping mechanisms.
Operator training and safety standards are essential considerations to ensure optimal performance and minimize hazards. Environmental regulations and safety standards are increasingly stringent, driving the adoption of alternative fuels and compaction ratio improvements. Maintenance services and recycling centers are integral components of the market, with the cost per ton being a crucial factor in determining overall efficiency. The market is undergoing transformative changes, with the APAC region leading the charge. The integration of advanced technologies, stringent regulations, and increasing demand for waste management solutions are shaping the market's dynamics and trends.
Market Dynamics
Our researchers analyzed the data with 2024 as the base year, along with the key drivers, trends, and challenges. A holistic analysis of drivers will help companies refine their marketing strategies to gain a competitive advantage.
What are the Garbage Truck market drivers leading to the rise in the adoption of Industry?
- Global urbanization, characterized by the expansion of cities and increasing population density, serves as the primary catalyst for market growth. The global waste collection market is experiencing notable growth due to the increasing urban population and subsequent rise in residential waste generation. As of 2023, approximately 57% of the world's population resides in urban areas, with this figure projected to reach nearly 7 billion by 2050. This trend results in increased population density, leading to a substantial increase in municipal solid waste generation. In response, waste management solutions, including garbage trucks, have become essential for maintaining cleanliness and hygiene in expanding urban environments. Garbage trucks play a crucial role in waste collection, featuring key attributes such as payload capacity, hydraulic systems, and dumping angles to efficiently manage commercial and residential waste.
- Fleet management systems are also increasingly adopted to optimize routes and reduce vehicle weight for cost savings and environmental sustainability. These advancements underscore the market's dynamic nature and the ongoing efforts to address the challenges posed by growing waste generation in urban areas.
What are the Garbage Truck market trends shaping the Industry?
- The rising preference for electric garbage trucks represents a significant market trend in the waste management industry. This eco-friendly alternative to traditional diesel trucks is gaining increasing popularity due to its environmental benefits and cost-effectiveness in the long run. Electric garbage trucks have emerged as a viable solution in the waste management industry due to their environmental benefits. These trucks, powered by electric batteries, offer significant reductions in carbon emissions compared to traditional diesel-powered vehicles. The shift towards cleaner and sustainable alternatives is a global trend, and the waste management sector is no exception. Electric garbage trucks operate using electric powertrains, which not only propel the vehicle but also power auxiliary systems. These trucks are particularly advantageous for urban areas, where emissions reduction is a priority, contributing to enhanced air quality. The elimination of tailpipe emissions is a significant environmental improvement for waste collection operations, making electric garbage trucks an attractive choice for municipalities committed to sustainability goals.
- Additionally, the use of alternative fuels, such as compressed natural gas and biodiesel, in garbage trucks is another approach to reducing carbon emissions. Operator training is essential for ensuring safe and efficient operation of these trucks, and recycling centers play a crucial role in maximizing the utilization of waste materials. The cost per ton of waste disposal may vary depending on factors such as location and type of waste. Overall, the adoption of electric garbage trucks and alternative fuels is a critical step towards a more sustainable waste management industry.
How does Garbage Truck market faces challenges during its growth?
- The high initial costs associated with modern garbage trucks pose a significant challenge to the growth of the industry. This challenge stems from the substantial investment required to procure advanced garbage trucks equipped with innovative technologies for waste management and recycling. However, despite these costs, the long-term benefits, including increased efficiency, reduced labor requirements, and improved environmental sustainability, make this investment a worthwhile consideration for industry players. Garbage trucks with advanced technologies, such as automation and telematics, offer numerous benefits to municipalities and waste management companies. However, the high initial costs of these modern vehicles pose a significant challenge. An automated side loader (ASL) with robotic arms for automated waste collection, for example, can cost between USD250,000 and USD400,000 or more. This expense includes not only the vehicle but also the integration of smart waste management systems, such as sensors and route optimization software. These investments contribute to the overall price of the vehicle, making it a substantial upfront expense for organizations.
- Despite the high initial costs, the long-term benefits of these advanced garbage trucks, including increased efficiency and reduced labor costs, make them a worthwhile investment for many.
Exclusive Customer Landscape
The garbage truck market forecasting report includes the adoption lifecycle of the market, covering from the innovator's stage to the laggard's stage. It focuses on adoption rates in different regions based on penetration. Furthermore, the garbage truck market report also includes key purchase criteria and drivers of price sensitivity to help companies evaluate and develop their market growth analysis strategies.

Customer Landscape
Key Companies & Market Insights
Companies are implementing various strategies, such as strategic alliances, garbage truck market forecast, partnerships, mergers and acquisitions, geographical expansion, and product/service launches, to enhance their presence in the industry.
AB Volvo - The company manufactures garbage trucks, engineered to optimize waste collection operations.
The industry research and growth report includes detailed analyses of the competitive landscape of the market and information about key companies, including:
- AB Volvo
- Autocar LLC
- Battle Motors
- Bridgeport Manufacturing
- BYD Co. Ltd.
- Curbtender Sweepers LLC
- China Dong Feng Motor Industry Imp. and Exp. Co. Ltd.
- EL Industries International
- Heil An Environmental Solutions Group Co.
- Hyundai Motor Co.
- Hyzon Motors
- KIRCHHOFF Group
- Labrie Environmental Group
- McNeilus Truck and Manufacturing Inc.
- New Way Refuse Trucks
- Peterbilt
- Terberg RosRoca Group
- Wastequip LLC
- Xuzhou Construction Machinery Group Co. Ltd.
Qualitative and quantitative analysis of companies has been conducted to help clients understand the wider business environment as well as the strengths and weaknesses of key industry players. Data is qualitatively analyzed to categorize companies as pure play, category-focused, industry-focused, and diversified; it is quantitatively analyzed to categorize companies as dominant, leading, strong, tentative, and weak.
Recent Development and News in Garbage Truck Market
- In February 2024, Waste Management, a leading provider of waste management services in North America, introduced its new fleet of natural gas-powered garbage trucks in collaboration with Peterbilt Motors Company (Reuters, 2024). This strategic partnership marks a significant step towards reducing the environmental footprint of garbage collection operations.
- In May 2025, CleanRobotics, a robotics company specializing in autonomous waste management solutions, raised USD 30 million in a Series C funding round led by Sequoia Capital China (Wall Street Journal, 2025). This substantial investment will support the expansion of CleanRobotics' autonomous waste sorting technology, which could revolutionize the market by increasing efficiency and reducing labor costs.
- In October 2024, the European Union passed a new regulation mandating that all new garbage trucks be equipped with advanced emission control systems by 2028 (European Parliament, 2024). This key regulatory approval is expected to drive demand for electric and hybrid garbage trucks, as these vehicles offer significant reductions in greenhouse gas emissions compared to traditional diesel models.
- In January 2025, Republic Services, a major waste management company, announced a strategic partnership with Tesla to deploy electric garbage trucks powered by Tesla's Megacharger network (Tesla, Inc., 2025). This collaboration represents a significant technological advancement in the market, as it demonstrates the potential for electric vehicles to replace traditional diesel models in waste management applications.
Research Analyst Overview
The market continues to evolve, driven by advancements in technology and shifting market dynamics. Municipal and construction waste sectors are major consumers, with a focus on lift height, waste disposal, and smart waste management solutions. Autonomous garbage trucks and fuel efficiency are key trends, as service life and operating costs remain critical factors. Emissions reduction, parts availability, and environmental regulations are shaping the market, with safety standards and hydraulic pressure. Automatic compaction, GPS tracking, and landfill diversion are essential components of modern waste collection systems.
Residential and commercial waste sectors require payload capacity, fleet management, and vehicle weight considerations. Industrial waste segments demand robust dumping mechanisms and hazardous waste handling capabilities. Operator training, recycling centers, cost per ton, alternative fuels, and compaction ratio are other significant aspects. The ongoing unfolding of market activities reveals a continuous quest for innovation and efficiency in waste management solutions.
Dive into Technavio's strong research methodology, blending expert interviews, extensive data synthesis, and validated models for unparalleled Garbage Truck Market insights. See full methodology.
|
Market Scope |
|
|
Report Coverage |
Details |
|
Page number |
238 |
|
Base year |
2024 |
|
Historic period |
2019-2023 |
|
Forecast period |
2025-2029 |
|
Growth momentum & CAGR |
Accelerate at a CAGR of 5.4% |
|
Market growth 2025-2029 |
USD 5 billion |
|
Market structure |
Fragmented |
|
YoY growth 2024-2025(%) |
5.1 |
|
Key countries |
US, China, Canada, Germany, Japan, UK, India, South Korea, France, and Australia |
|
Competitive landscape |
Leading Companies, Market Positioning of Companies, Competitive Strategies, and Industry Risks |
What are the Key Data Covered in this Garbage Truck Market Research and Growth Report?
- CAGR of the Garbage Truck industry during the forecast period
- Detailed information on factors that will drive the growth and forecasting between 2025 and 2029
- Precise estimation of the size of the market and its contribution of the industry in focus to the parent market
- Accurate predictions about upcoming growth and trends and changes in consumer behaviour
- Growth of the market across APAC, Europe, North America, Middle East and Africa, and South America
- Thorough analysis of the market's competitive landscape and detailed information about companies
- Comprehensive analysis of factors that will challenge the garbage truck market growth of industry companies
We can help! Our analysts can customize this garbage truck market research report to meet your requirements.
 RIA -
RIA - 
