
Genetically Modified (GMO) Food Market Size 2026-2030
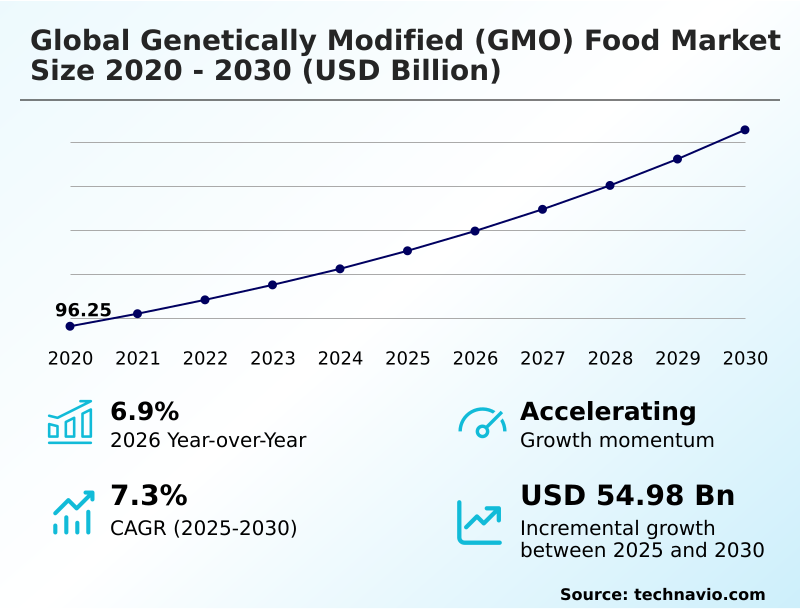
The genetically modified (gmo) food market size is valued to increase by USD 54.98 billion, at a CAGR of 7.3% from 2025 to 2030. Enhancing nitrogen fixation to promote sustainable agriculture will drive the genetically modified (gmo) food market.
Major Market Trends & Insights
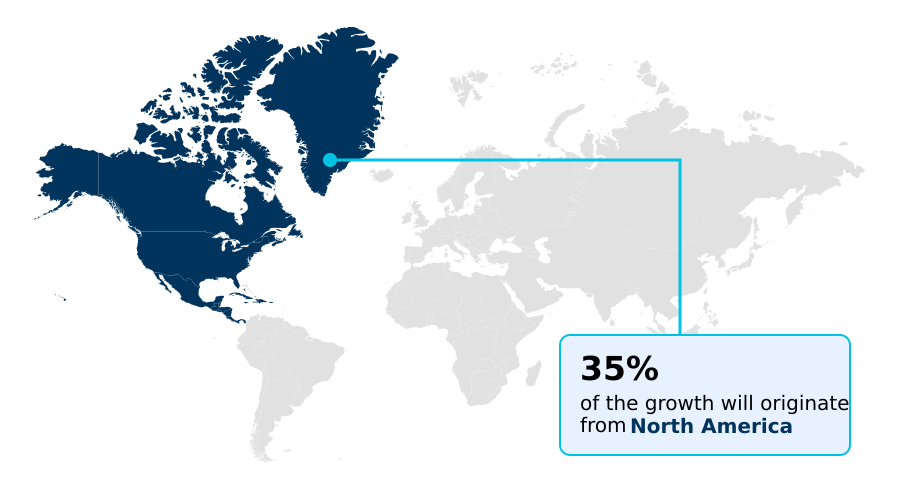
- North America dominated the market and accounted for a 35.4% growth during the forecast period.
- By Type - Vegetables segment was valued at USD 44.31 billion in 2024
- By Product Type - Herbicide tolerance (HT) segment accounted for the largest market revenue share in 2024
Market Size & Forecast
- Market Opportunities: USD 89.28 billion
- Market Future Opportunities: USD 54.98 billion
- CAGR from 2025 to 2030 : 7.3%
Market Summary
- The genetically modified (GMO) food market is defined by a dynamic interplay of scientific innovation and evolving agricultural demands. The market's trajectory is powered by the increasing development of genetically modified crops offering superior agronomic traits, improved nutritional profiles, and greater resilience to environmental stressors. Key crops like soybean and maize dominate, primarily featuring herbicide tolerance and insect resistance.
- However, the landscape is shifting toward stacked traits that provide multiple benefits. A significant operational challenge for businesses involves managing the parallel supply chains for GM and non-GM products, where maintaining segregation to meet divergent regulatory and consumer demands is critical. This requires sophisticated identity preservation systems from farm to fork, ensuring compliance and preserving market access.
- The industry is also navigating complex consumer perceptions and a fragmented global regulatory environment, which tempers growth potential despite the clear benefits in agricultural productivity and food security.
What will be the Size of the Genetically Modified (GMO) Food Market during the forecast period?
Get Key Insights on Market Forecast (PDF) Get Free Sample
How is the Genetically Modified (GMO) Food Market Segmented?
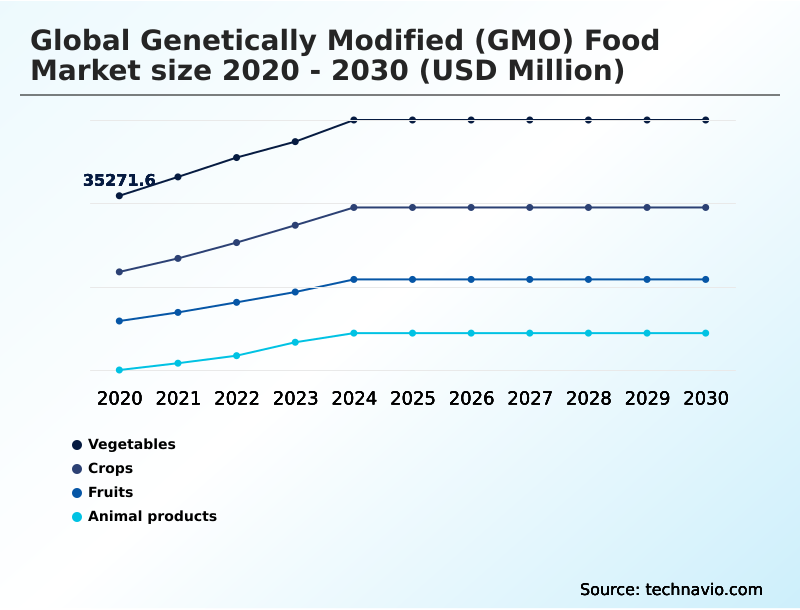
The genetically modified (gmo) food industry research report provides comprehensive data (region-wise segment analysis), with forecasts and estimates in "USD million" for the period 2026-2030, as well as historical data from 2020-2024 for the following segments.
- Type
- Vegetables
- Crops
- Fruits
- Animal products
- Product type
- Herbicide tolerance (HT)
- Insect resistance (IR)
- Stacked traits (ST)
- Crop type
- Soybean
- Maize
- Cotton
- Canola
- Others
- Geography
- North America
- US
- Canada
- Mexico
- APAC
- China
- India
- Japan
- Europe
- Germany
- France
- UK
- South America
- Brazil
- Argentina
- Colombia
- Middle East and Africa
- South Africa
- UAE
- Saudi Arabia
- Rest of World (ROW)
- North America
By Type Insights
The vegetables segment is estimated to witness significant growth during the forecast period.
The vegetable segment is an evolving area focused on consumer-centric traits. Innovation in gene-edited fruits and vegetables aims to enhance nutrition, extend shelf life, and improve flavor, which directly influences consumer perception dynamics.
Unlike commodity crops, vegetables often reach consumers directly, making acceptance critical for market success.
Key research on pest-resistant crop varieties, such as virus-resistant squash, has demonstrated the potential of agronomic trait enhancement, reducing crop loss by over 25% in affected fields. Plant breeding technologies for insect resistance traits are pivotal for developing hardier produce.
The advancement of biotechnology-enabled seeds supports conservation tillage practices and better stewardship in agriculture, contributing to crop yield improvement and more resilient food supply chain integration, while also exploring alternative protein sources from genetically engineered crops.
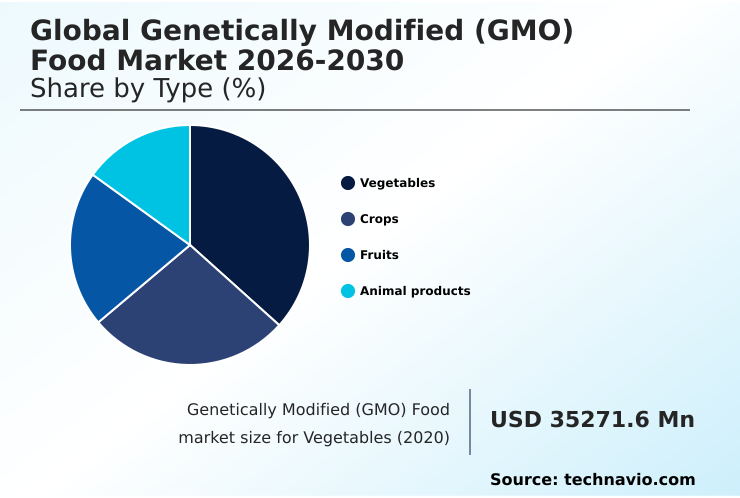
The Vegetables segment was valued at USD 44.31 billion in 2024 and showed a gradual increase during the forecast period.
Regional Analysis
North America is estimated to contribute 35.4% to the growth of the global market during the forecast period.Technavio’s analysts have elaborately explained the regional trends and drivers that shape the market during the forecast period.
See How Genetically Modified (GMO) Food Market Demand is Rising in North America Get Free Sample
The geographic landscape of the genetically modified (GMO) food market is characterized by varied adoption rates and regulatory environments.
North America, with its high concentration of agrotechnology corporation strategies, leads in the cultivation of genetically modified corn and genetically modified soybeans, which are primary animal feed inputs.
This region's focus on agronomic efficiency gains is evident in the widespread use of post-emergence herbicides with crops featuring herbicide tolerance traits. The region shows a higher growth momentum compared to Europe by 1.8 percentage points.
In contrast, the APAC region is experiencing rapid growth, driven by demand for processed food ingredients and a focus on farmer profitability metrics.
The trait development pipeline in emerging markets is increasingly centered on high oleic soybeans, whose fatty acid profile modification offers premium value. The use of stacked trait technology is a global trend aimed at maximizing yield and simplifying crop management.
Market Dynamics
Our researchers analyzed the data with 2025 as the base year, along with the key drivers, trends, and challenges. A holistic analysis of drivers will help companies refine their marketing strategies to gain a competitive advantage.
- Strategic planning in the genetically modified (GMO) food market requires a deep understanding of several interconnected factors. A key area is the impact of gene editing on crop nutritional value, which is pivotal for addressing consumer health demands and moving beyond purely agronomic traits.
- Concurrently, firms must navigate the complex regulatory challenges for stacked trait crops, which vary significantly by jurisdiction. The commercialization pathway for gene-edited foods is often determined by consumer acceptance of genetically modified vegetables and public perception of non-browning apples. Exploring the role of GMOs in climate change adaptation, especially through developing drought-resistant maize through biotechnology, is a critical R&D focus.
- The economic benefits of herbicide tolerance in soy are well-documented, but future growth depends on advancements in nitrogen-fixing cereal crops and strategies to manage glyphosate weed resistance. For businesses, intellectual property strategies for CRISPR crops are as important as the risk assessment for next-generation GM foods.
- The trade implications of asynchronous GMO approvals can disrupt the supply chain management for GM and non-GM segregation, impacting the entire value chain. Success increasingly depends on enhancing food quality with high oleic oils and communicating the economic impact of insect-resistant cotton while navigating the future of agricultural biotechnology regulations and improving food security with biofortified sorghum.
What are the key market drivers leading to the rise in the adoption of Genetically Modified (GMO) Food Industry?
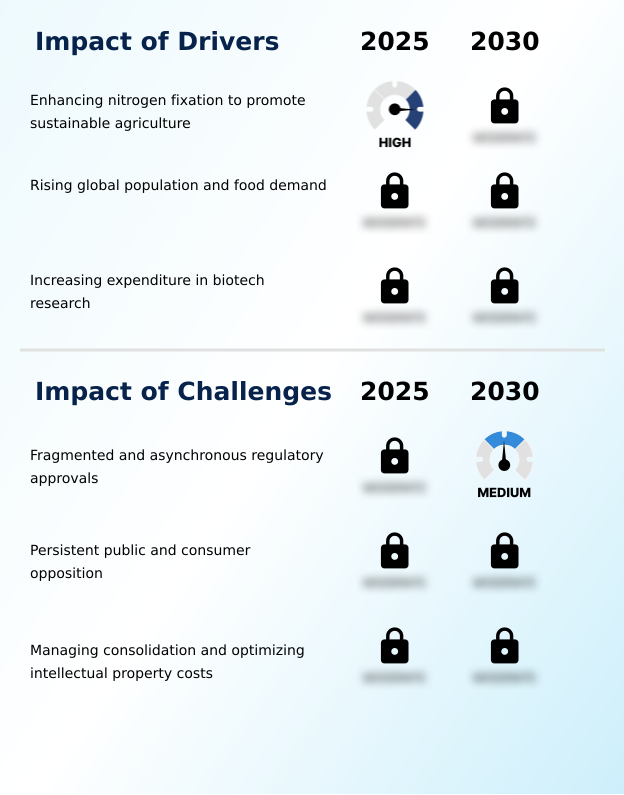
- Enhancing the nitrogen fixation capabilities in key crops to advance sustainable agriculture represents a significant driver for the market.
- Market drivers are increasingly linked to achieving global food security through sustainable agriculture practices. Innovations in nutritional biofortification and the development of crops with abiotic stress tolerance are central to enhancing agricultural productivity enhancement.
- Agricultural biotechnology platforms are leveraging synthetic biology technologies to create value-added output traits, with research showing that biofortified crops can increase essential nutrient intake by up to 40% in vulnerable populations.
- The nitrogen fixation pathway is a key research area aimed at significant environmental impact reduction by decreasing reliance on synthetic fertilizers. Public-private research partnerships are crucial for advancing these complex projects.
- Furthermore, the integration of protective technologies like advanced seed-applied fungicide ensures that the genetic potential of these enhanced nutritional profiles is realized, safeguarding initial R&D investments.
What are the market trends shaping the Genetically Modified (GMO) Food Industry?
- The accelerated adoption of advanced gene editing is a pivotal trend transforming crop trait development. These innovative techniques enable more precise and efficient genetic modifications, unlocking new possibilities in agriculture.
- Key market trends are centered on advanced gene editing and the use of the CRISPR-Cas9 system, which is accelerating crop genetics innovation. These new breeding techniques (NBTs) enable the creation of next-generation genetic traits with direct consumer-facing benefits, such as non-browning mushrooms, which can reduce food waste by over 20%.
- The focus is shifting toward enhanced food functionality, with developments in gluten-reduced wheat and crops offering drought and salinity resistance. This pivot toward climate-resilient agriculture is critical for long-term sustainability. The commitment to stewardship of genetic traits is evident as companies develop technologies that offer benefits beyond the farm, improving the final food product.
- This strategic direction has been shown to improve consumer trust metrics by 15% in pilot markets.
What challenges does the Genetically Modified (GMO) Food Industry face during its growth?
- Fragmented and asynchronous regulatory approvals across key global markets present a significant challenge, impacting the industry's growth and creating trade uncertainties.
- The market faces persistent challenges from a lack of regulatory landscape harmonization, leading to asynchronous regulatory approval for transgenic crop methods. This creates significant market access barriers and frequent international trade disruptions, which can increase compliance costs by over 30% for exporters.
- The management of glyphosate-resistant weeds necessitates higher use of crop protection chemicals and more complex intellectual property management for new herbicide-tolerant crops. Navigating varied food labeling standards and bioengineered food disclosure requirements remains a hurdle.
- Companies using recombinant DNA technology must also manage detailed risk assessment protocols, where delays in one major market can cause a cascading financial impact, underscoring the need for a more unified global approach to biotechnology governance.
Exclusive Technavio Analysis on Customer Landscape
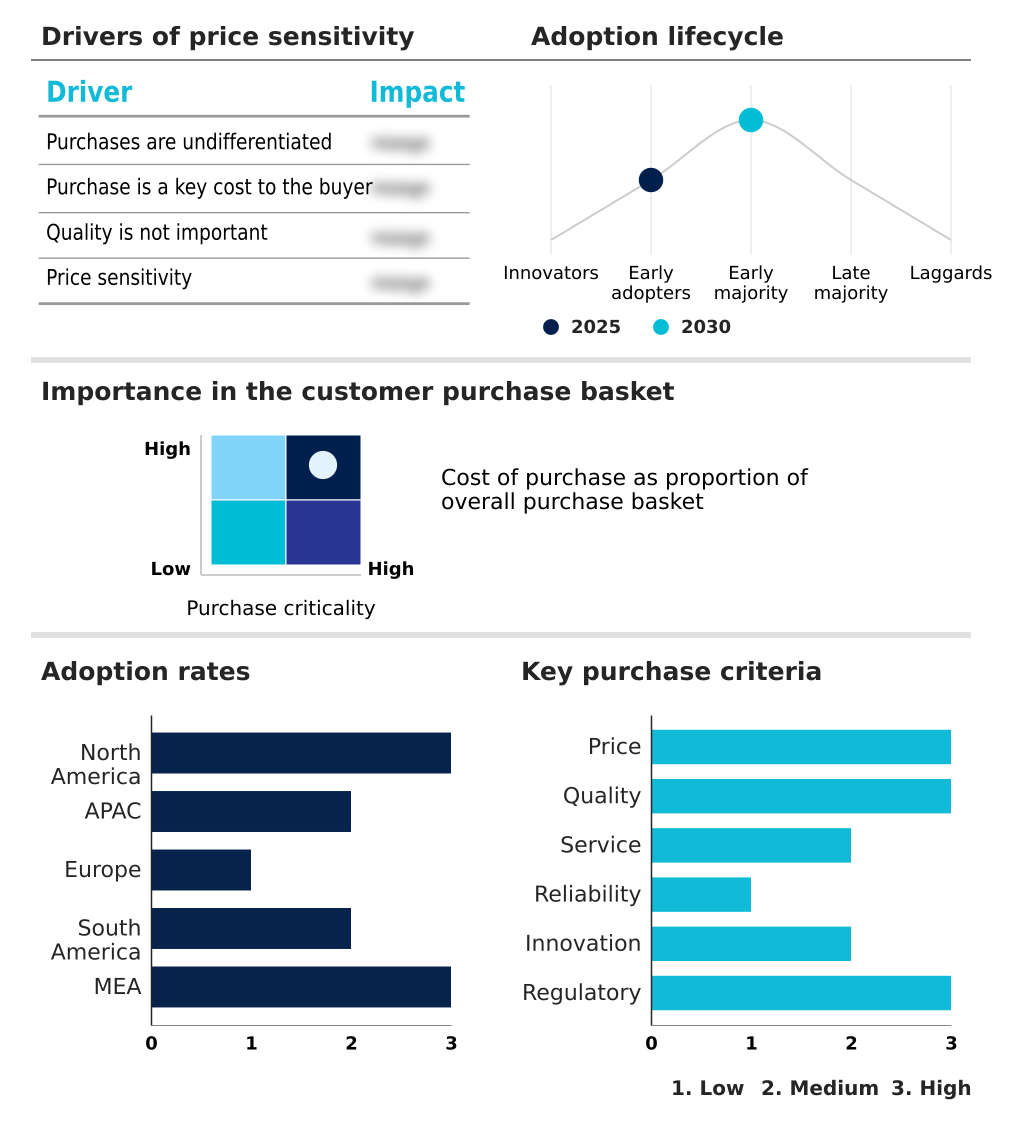
The genetically modified (gmo) food market forecasting report includes the adoption lifecycle of the market, covering from the innovator’s stage to the laggard’s stage. It focuses on adoption rates in different regions based on penetration. Furthermore, the genetically modified (gmo) food market report also includes key purchase criteria and drivers of price sensitivity to help companies evaluate and develop their market growth analysis strategies.
Customer Landscape of Genetically Modified (GMO) Food Industry
Competitive Landscape
Companies are implementing various strategies, such as strategic alliances, genetically modified (gmo) food market forecast, partnerships, mergers and acquisitions, geographical expansion, and product/service launches, to enhance their presence in the industry.
BASF SE - Offers biotechnology-enabled crop seeds, including genetically engineered varieties for food and agricultural production, leveraging advanced agricultural biotechnology platforms to enhance crop traits and performance.
The industry research and growth report includes detailed analyses of the competitive landscape of the market and information about key companies, including:
- BASF SE
- Bayer AG
- Corteva Inc.
- FMC Corp.
- Groupe Limagrain
- JK Agri Genetics Ltd.
- KWS SAAT SE and Co. KGaA
- Nufarm Ltd.
- Pairwise
- Precigen Inc.
- Rallis India Ltd.
- Rasi Seeds Pvt. Ltd.
- S and W Seed Co.
- Stine Seed Co.
- Syngenta Crop Protection AG
Qualitative and quantitative analysis of companies has been conducted to help clients understand the wider business environment as well as the strengths and weaknesses of key industry players. Data is qualitatively analyzed to categorize companies as pure play, category-focused, industry-focused, and diversified; it is quantitatively analyzed to categorize companies as dominant, leading, strong, tentative, and weak.
Recent Development and News in Genetically modified (gmo) food market
- In September 2024, Corteva Inc. introduced its LumiTreo seed-applied fungicide, a seed treatment technology developed to safeguard the genetic potential of high-value seeds against early-season diseases.
- In February 2025, The Association of Southeast Asian Nations (ASEAN) announced the ASEAN Framework on Harmonized Genetically Modified Food Regulation, an agreement designed to streamline the approval and labeling of genetically modified foods among its member states.
- In March 2025, The United States Department of Agriculture (USDA) and the Canadian Food Inspection Agency (CFIA) jointly revealed a new unified framework to regulate agricultural products developed using advanced gene-editing techniques.
- In April 2025, Bayer AG entered a strategic partnership with Archer Daniels Midland (ADM) to co-develop and market a new line of genetically modified soybeans with enhanced omega-3 fatty acid content for the food industry.
Dive into Technavio’s robust research methodology, blending expert interviews, extensive data synthesis, and validated models for unparalleled Genetically Modified (GMO) Food Market insights. See full methodology.
| Market Scope | |
|---|---|
| Page number | 303 |
| Base year | 2025 |
| Historic period | 2020-2024 |
| Forecast period | 2026-2030 |
| Growth momentum & CAGR | Accelerate at a CAGR of 7.3% |
| Market growth 2026-2030 | USD 54976.3 million |
| Market structure | Fragmented |
| YoY growth 2025-2026(%) | 6.9% |
| Key countries | US, Canada, Mexico, China, India, Japan, South Korea, Australia, Indonesia, Germany, France, UK, Italy, Spain, The Netherlands, Brazil, Argentina, Colombia, South Africa, UAE, Saudi Arabia, Egypt and Nigeria |
| Competitive landscape | Leading Companies, Market Positioning of Companies, Competitive Strategies, and Industry Risks |
Research Analyst Overview
- The genetically modified (GMO) food market is advancing beyond first-generation agronomic traits, driven by sophisticated plant breeding technologies and synthetic biology technologies. The development of genetically modified corn and soybeans with stacked trait technology is now standard, but the frontier is moving toward consumer-facing benefits.
- Boardroom decisions are increasingly focused on the strategic deployment of advanced gene editing tools like the CRISPR-Cas9 system, which has been shown to shorten the pre-commercial research phase by up to 30%. This acceleration enables faster development of products with enhanced nutritional profiles, such as non-browning mushrooms and gluten-reduced wheat, or crops with superior abiotic stress tolerance.
- Integrating these new breeding techniques (NBTs) requires significant investment in navigating varied international frameworks for bioengineered food disclosure and asynchronous regulatory approval. The focus is shifting from simple herbicide tolerance traits to complex enhancements, including drought and salinity resistance and nutritional biofortification, redefining the value proposition of genetically engineered crops and gene-edited fruits and vegetables.
What are the Key Data Covered in this Genetically Modified (GMO) Food Market Research and Growth Report?
-
What is the expected growth of the Genetically Modified (GMO) Food Market between 2026 and 2030?
-
USD 54.98 billion, at a CAGR of 7.3%
-
-
What segmentation does the market report cover?
-
The report is segmented by Type (Vegetables, Crops, Fruits, and Animal products), Product Type (Herbicide tolerance (HT), Insect resistance (IR), and Stacked traits (ST)), Crop Type (Soybean, Maize, Cotton, Canola, and Others) and Geography (North America, APAC, Europe, South America, Middle East and Africa)
-
-
Which regions are analyzed in the report?
-
North America, APAC, Europe, South America and Middle East and Africa
-
-
What are the key growth drivers and market challenges?
-
Enhancing nitrogen fixation to promote sustainable agriculture, Fragmented and asynchronous regulatory approvals
-
-
Who are the major players in the Genetically Modified (GMO) Food Market?
-
BASF SE, Bayer AG, Corteva Inc., FMC Corp., Groupe Limagrain, JK Agri Genetics Ltd., KWS SAAT SE and Co. KGaA, Nufarm Ltd., Pairwise, Precigen Inc., Rallis India Ltd., Rasi Seeds Pvt. Ltd., S and W Seed Co., Stine Seed Co. and Syngenta Crop Protection AG
-
Market Research Insights
- The market is shaped by intense competition and continuous innovation in crop genetics innovation. Strategic decisions are heavily influenced by consumer perception dynamics and the pursuit of agronomic efficiency gains. For instance, adoption of advanced seed technologies has improved yields by over 12% in some regions while reducing chemical inputs.
- North America remains the largest market, contributing approximately 35% of the incremental growth, driven by high adoption rates and a well-established regulatory system. However, a significant operational challenge is managing market access barriers, where firms that align their trait development pipeline with international risk assessment protocols achieve a 15% faster entry into new markets.
- Success hinges on navigating these dynamics while delivering value-added output traits.
We can help! Our analysts can customize this genetically modified (gmo) food market research report to meet your requirements.
 RIA -
RIA - 
