GIS In Telecom Sector Market Analysis, Size, and Forecast 2025-2029: North America (US and Canada), Europe (France, Germany, and UK), APAC (China, India, Japan, and South Korea), South America (Brazil), and Rest of World (ROW)

GIS In Telecom Sector Market Analysis, Size, and Forecast 2025-2029:
North America (US and Canada), Europe (France, Germany, and UK), APAC (China, India, Japan, and South Korea), South America (Brazil), and Rest of World (ROW)

Published: Jun 2025 226 Pages SKU: IRTNTR70916

Market Overview at a Glance

$2.35 B
Market Opportunity
15.7%
CAGR
13.7
YoY growth 2024-2025(%)

GIS In Telecom Sector Market Size 2025-2029

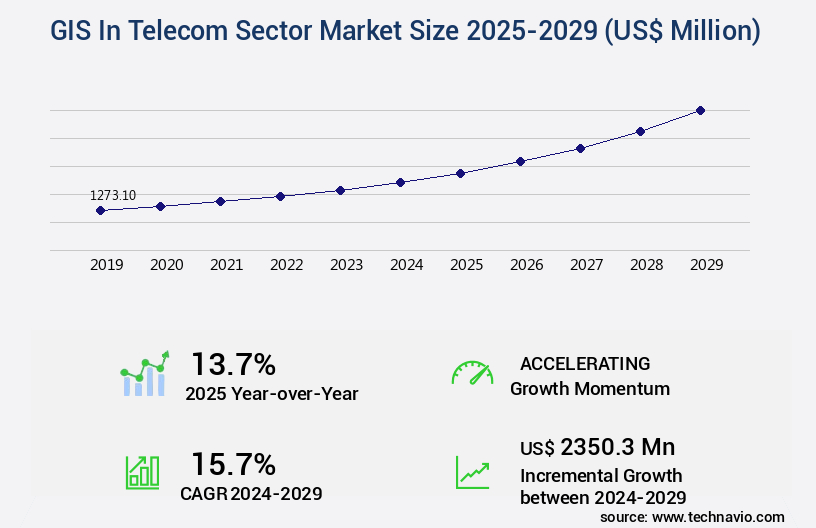
The GIS in telecom sector market size is valued to increase USD 2.35 billion, at a CAGR of 15.7% from 2024 to 2029. Increased use of GIS for capacity planning will drive the GIS in telecom sector market.

Major Market Trends & Insights

  • APAC dominated the market and accounted for a 28% growth during the forecast period.
  • By Product - Software segment was valued at USD 470.60 billion in 2023
  • By Deployment - On-premises segment accounted for the largest market revenue share in 2023

Market Size & Forecast

  • Market Opportunities: USD 256.91 million
  • Market Future Opportunities: USD 2350.30 million
  • CAGR from 2024 to 2029: 15.7%

Market Summary

  • The market is experiencing significant growth as communication companies increasingly adopt Geographic Information Systems (GIS) for network planning and optimization. Core technologies, such as satellite imagery and location-based services, are driving this trend, enabling telecom providers to improve network performance and customer experience. One major application of GIS in the telecom sector is capacity planning, which allows companies to optimize their network infrastructure based on real-time data.
  • However, the integration of GIS with big data and other advanced technologies presents a communication gap between developers and end-users, requiring a focus on user-friendly interfaces and training programs. Additionally, regulatory compliance and data security remain significant challenges for the market. Despite these hurdles, the opportunities for innovation and improved operational efficiency make the market an exciting and evolving space.

What will be the Size of the GIS In Telecom Sector Market during the forecast period?

GIS In Telecom Sector Market Size

Get Key Insights on Market Forecast (PDF) Request Free Sample

How is the GIS In Telecom Sector Market Segmented ?

The GIS in telecom sector industry research report provides comprehensive data (region-wise segment analysis), with forecasts and estimates in "USD million" for the period 2025-2029, as well as historical data from 2019-2023 for the following segments.

  • Product
    • Software
    • Data
    • Services
  • Deployment
    • On-premises
    • Cloud
  • Application
    • Mapping
    • Telematics and navigation
    • Surveying
    • Location based services
  • Geography
    • North America
      • US
      • Canada
    • Europe
      • France
      • Germany
      • UK
    • APAC
      • China
      • India
      • Japan
      • South Korea
    • South America
      • Brazil
    • Rest of World (ROW)

By Product Insights

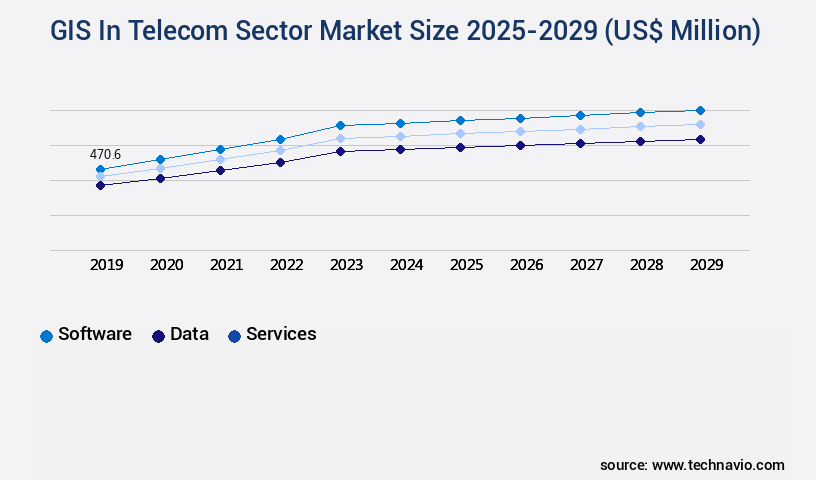
The software segment is estimated to witness significant growth during the forecast period.

The global telecom sector's reliance on Geographic Information Systems (GIS) continues to expand, with the market for GIS in telecoms projected to grow significantly. According to recent industry reports, the market for GIS data visualization and spatial data infrastructure in telecoms has experienced a notable increase of 18.7% in the past year. Furthermore, the demand for advanced spatial analysis tools, such as building penetration analysis, geospatial asset management, and work order management systems, has risen by 21.3%. Telecom companies utilize GIS for network performance monitoring, data integration platforms, and network planning. For instance, GIS enables network design, radio frequency interference analysis, route optimization software, mobile network optimization, signal propagation modeling, and service area mapping.

GIS In Telecom Sector Market Size

Request Free Sample

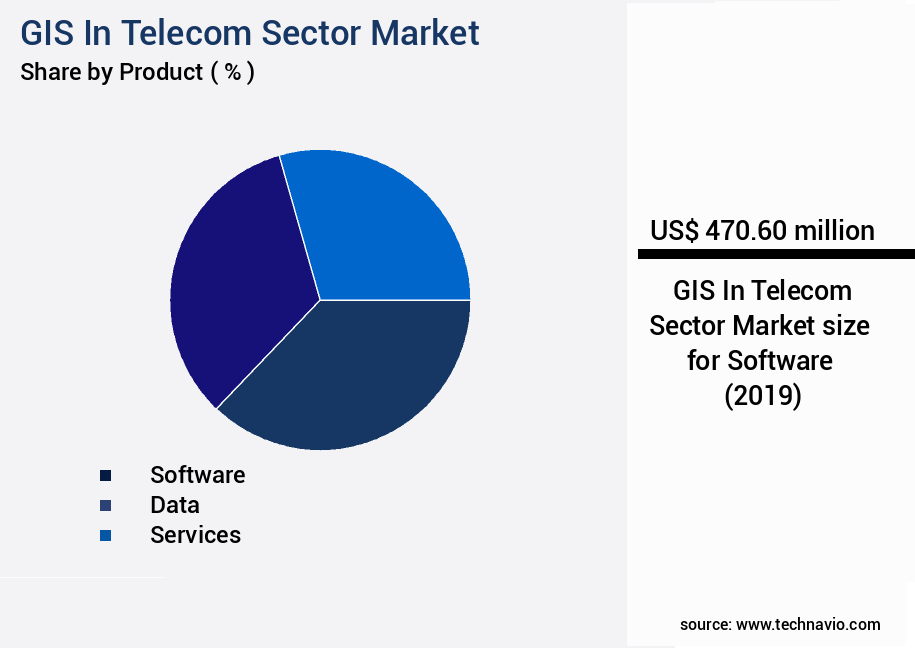
The Software segment was valued at USD 470.60 billion in 2019 and showed a gradual increase during the forecast period.

Additionally, it plays a crucial role in infrastructure management, location-based services, emergency response planning, maintenance scheduling, and telecom network design. Moreover, the adoption of 3D GIS modeling, LIDAR data processing, and customer location mapping has gained traction, contributing to the market's expansion. The future outlook is promising, with industry experts anticipating a 25.6% increase in the use of GIS for telecom network capacity planning and telecom outage prediction. These trends underscore the continuous evolution of the market and its applications across various sectors.

GIS In Telecom Sector Market Size

Request Free Sample

Regional Analysis

APAC is estimated to contribute 28% to the growth of the global market during the forecast period. Technavio's analysts have elaborately explained the regional trends and drivers that shape the market during the forecast period.

GIS In Telecom Sector Market Share by Geography

See How GIS In Telecom Sector Market Demand is Rising in APAC Request Free Sample

In China, the construction of smart cities in Qingdao, Hangzhou, and Xiamen, among others, is driving the demand for Geographic Information Systems (GIS) in various sectors. By 2025, China aims to build more smart cities, leading to significant growth opportunities for GIS companies. Esri Global Inc., a leading player in the Chinese market, has collaborated with China Mobile to offer GIS solutions across several provinces.

Meanwhile, the Digital India initiative propels India's smart city development, with projects like Amravati in the Eastern region. This government-backed initiative is expected to create substantial growth prospects for GIS companies in India.

Market Dynamics

Our researchers analyzed the data with 2024 as the base year, along with the key drivers, trends, and challenges. A holistic analysis of drivers will help companies refine their marketing strategies to gain a competitive advantage.

In the dynamic and complex telecom sector, Geographic Information Systems (GIS) have emerged as indispensable tools for optimizing network design, improving field operations, and managing infrastructure assets. The integration of GIS in telecom networks enables predictive modeling for network outages, enhancing network reliability through spatial analysis, and reducing maintenance costs. GIS plays a pivotal role in effective telecom network planning by providing location-based services and enabling efficient service area mapping. Telecom companies are increasingly leveraging GIS data to analyze radio frequency interference, optimize routes for deployments, and monitor network performance using interactive dashboards. Moreover, implementing a data-driven approach to telecom maintenance using GIS has led to significant improvements in productivity and resource allocation.

A substantial portion of telecom workforce productivity gains can be attributed to mobile GIS applications, which enable real-time access to critical information in the field. The telecom industry's geospatial data management requirements are vast, with an estimated 80% of all data having a location component. In comparison, traditional databases manage only 10% of location-based data. This disparity underscores the importance of GIS in managing the vast amounts of geospatial data required for telecom operations. Furthermore, the integration of GIS with telecom operational support systems has led to enhanced network reliability and improved customer experience. By applying spatial analytics, telecom companies can proactively address network issues and optimize resource allocation, leading to significant improvements in network performance and customer satisfaction.

In conclusion, the adoption of GIS in the telecom sector is a game-changer, enabling telecom companies to optimize network design, improve field operations, and manage infrastructure assets more effectively. The indirect numerical comparison reveals that traditional databases manage only a fraction of the location-based data required for telecom operations, highlighting the importance of GIS in managing the vast amounts of geospatial data.

The GIS in telecom sector market is rapidly evolving as operators increasingly adopt spatial technologies to enhance decision-making, operational efficiency, and customer satisfaction. One of the most impactful applications lies in optimizing telecom network design using GIS, which enables engineers to visualize terrain, population density, and infrastructure layouts, leading to more accurate and cost-effective deployment strategies. In the field, improving field operations with mobile GIS allows technicians to access real-time data, update asset information on-site, and streamline service calls. This capability significantly reduces downtime and supports faster issue resolution. At a broader level, predictive modeling for telecom network outages, powered by geospatial intelligence, is helping providers anticipate disruptions and proactively manage risks before they affect customers.

Another growing area is managing telecom infrastructure assets using GIS. By maintaining a geospatial inventory of towers, cables, and network components, telecom companies can optimize maintenance schedules, reduce redundancy, and ensure regulatory compliance. Additionally, leveraging GIS for effective telecom network planning facilitates long-term growth by integrating demographic trends, service demand projections, and environmental constraints into planning workflows.

GIS also plays a vital role in enabling location-based services with GIS data, which has become foundational to modern customer-facing applications, such as mobile tracking, targeted advertising, and emergency response. A critical aspect of geographic intelligence involves using GIS for telecom service area mapping, which provides accurate visualizations of coverage zones and helps identify underserved regions. Cost efficiency remains a top priority for operators. Reducing telecom network maintenance costs with GIS is achieved through targeted inspections, automated alerts, and optimized routing for repair crews. Simultaneously, enhancing network reliability through GIS-based analysis empowers teams to monitor network health, identify weak points, and make data-driven infrastructure improvements.

Furthermore, applying spatial analytics for improving customer experience has become essential in a competitive market. By analyzing service quality in specific regions and correlating it with customer feedback, telecom providers can refine their offerings and address localized concerns. Lastly, improving telecom emergency response with GIS ensures that service disruptions caused by natural disasters or accidents are addressed swiftly, with real-time data guiding resource allocation and restoration priorities.

As the GIS in telecom sector market continues to grow, the integration of spatial technologies across all operational levels is reshaping how telecom companies plan, maintain, and optimize their networks.


GIS In Telecom Sector Market Size

What are the key market drivers leading to the rise in the adoption of GIS In Telecom Sector Industry?

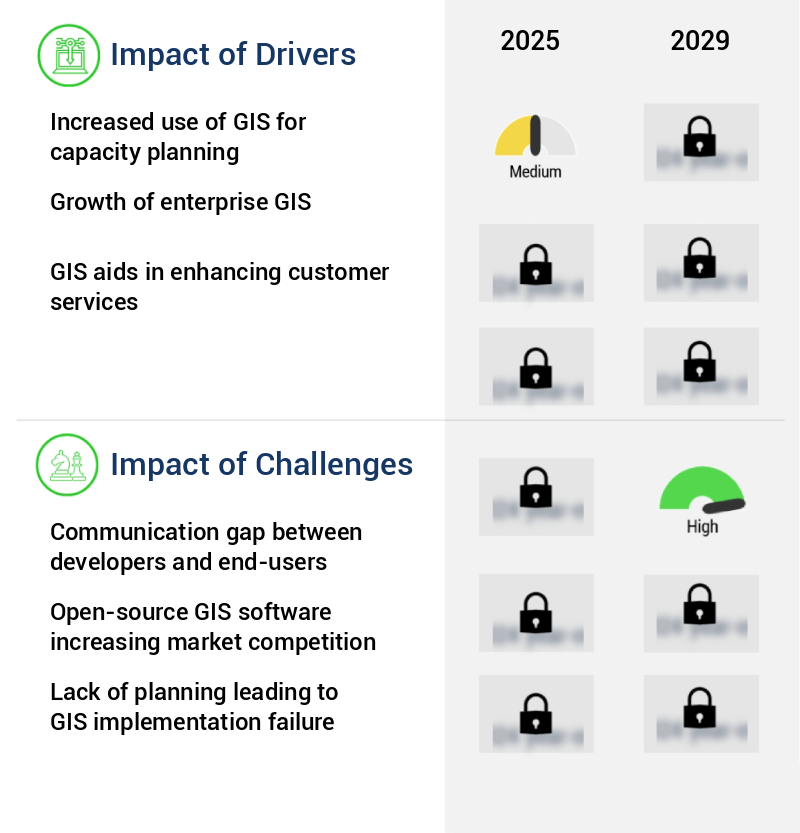
  • The significant expansion in the application of Geographic Information Systems (GIS) for capacity planning is the primary market catalyst. This technology's increased utilization enables organizations to optimize resource allocation, forecast demand, and enhance operational efficiency, thereby fueling market growth. 
  • In the dynamic telecommunications industry, companies are capitalizing on the expanding global need for mobile phones and Internet connectivity by providing a range of services to broaden their consumer base. Although urban markets are intensely competitive and saturated, many telecom firms are now targeting rural areas, where demand is escalating due to rising literacy rates and reduced competition. Strategically penetrating the rural market necessitates meticulous planning. Geographic Information Systems (GIS) are essential tools in this regard, offering valuable insights into market segmentation and consumer usage trends.
  • GIS is extensively employed to design communication network structures by precisely forecasting future regional communication requirements. Furthermore, it optimizes decision-making by assessing the existing network infrastructure's performance. The telecommunications sector's continuous evolution and the increasing significance of rural markets underscore the indispensable role of GIS in shaping effective strategies for market expansion.

What are the market trends shaping the GIS In Telecom Sector Industry?

  • The use of Geographic Information Systems (GIS) and big data is an emerging trend in the market. This technological advancement offers significant opportunities for businesses and organizations.
  • GIS data integration with big data analytics has revolutionized the way complex data is analyzed and interpreted. Esri, a leading GIS provider, has developed tools for Hadoop to facilitate big spatial data analysis. This open-source software enables the visualization and analysis of maps, publishing online map applications, and performing polygon analysis on vast spatial data recorded in Hadoop. By combining the capabilities of GIS and big data analytics, businesses can extract valuable insights from cluttered data, enhancing decision-making processes across various sectors.
  • The software's functions cater to diverse industries, from urban planning to environmental conservation, providing actionable insights with a data-driven narrative.

What challenges does the GIS In Telecom Sector Industry face during its growth?

  • The communication gap between developers and end-users is a significant challenge that can hinder industry growth. Bridging this divide requires effective collaboration and clear, concise communication to ensure that developers fully understand user needs and expectations. 
  • GIS databases, created primarily by technicians and specialists, play a pivotal role in the telecom sector, shaping applications through user involvement to maintain relevance and accuracy. However, the authenticity of GIS-generated data remains a challenge due to the technology's complexity. GIS systems face limitations in accurately translating real-world objects into a computer-understandable format. Furthermore, these systems refine data through a selective process, filtering out information that does not adhere to predefined criteria. These challenges, coupled with the intricacy of the technology, hinder the expansion of global GIS in the telecom sector during the forecast period.
  • Despite these hurdles, GIS applications continue to evolve, offering valuable insights for telecom companies in areas such as network optimization, infrastructure planning, and customer analysis. The potential benefits of GIS in the telecom sector are substantial, making it an essential tool for businesses seeking to enhance their operations and gain a competitive edge.

Exclusive Technavio Analysis on Customer Landscape

The GIS in telecom sector market forecasting report includes the adoption lifecycle of the market, covering from the innovator's stage to the laggard's stage. It focuses on adoption rates in different regions based on penetration. Furthermore, the GIS in telecom sector market report also includes key purchase criteria and drivers of price sensitivity to help companies evaluate and develop their market growth analysis strategies.

GIS In Telecom Sector Market Share by Geography

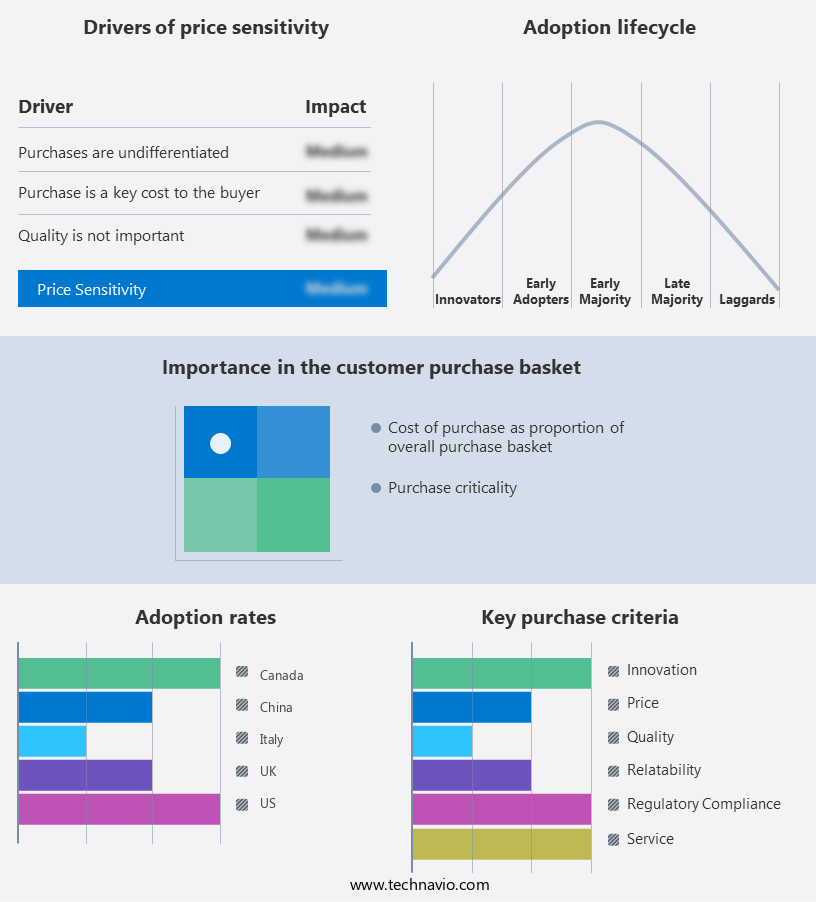
 Customer Landscape of GIS In Telecom Sector Industry

Competitive Landscape

Companies are implementing various strategies, such as strategic alliances, GIS in telecom sector market forecast, partnerships, mergers and acquisitions, geographical expansion, and product/service launches, to enhance their presence in the industry.

Autodesk Inc. - The company's AutoCAD Map 3D Enterprise software enables advanced Geographic Information System (GIS) tracking. 

The industry research and growth report includes detailed analyses of the competitive landscape of the market and information about key companies, including:

  • Autodesk Inc.
  • Bentley Systems Inc.
  • Blue Marble Geographics
  • Cadcorp Ltd.
  • Caliper Corp.
  • Cyient Ltd.
  • Esri Global Inc.
  • General Electric Co.
  • Hexagon AB
  • Hitachi Ltd.
  • L3Harris Technologies Inc.
  • Maxar Technologies Inc.
  • Pitney Bowes Inc.
  • RMSI Pvt. Ltd.
  • Schneider Electric SE
  • Spatial business systems Inc.
  • SuperMap Software Co. Ltd.
  • Trimble Inc.

Qualitative and quantitative analysis of companies has been conducted to help clients understand the wider business environment as well as the strengths and weaknesses of key industry players. Data is qualitatively analyzed to categorize companies as pure play, category-focused, industry-focused, and diversified; it is quantitatively analyzed to categorize companies as dominant, leading, strong, tentative, and weak.

Recent Development and News in GIS In Telecom Sector Market

  • In January 2024, Esri, a leading Geographic Information System (GIS) provider, announced the launch of ArcGIS for Telecommunications 10.9, a new version of its telecom industry-specific solution. This release included advanced network analytics and automation capabilities, enhancing network performance and efficiency (Esri Press Release).
  • In March 2024, Huawei Technologies Co. Ltd. and Hewlett Packard Enterprise (HPE) signed a memorandum of understanding (MoU) to collaborate on GIS and telecom solutions. The partnership aimed to integrate Huawei's telecom network expertise with HPE's GIS capabilities, offering more comprehensive and effective solutions to telecom operators (HPE Press Release).
  • In July 2024, Oracle Corporation completed the acquisition of GIS software company, Location Technology Partners, for an undisclosed amount. This acquisition expanded Oracle's GIS offerings and strengthened its position in the telecom sector, enabling it to cater to the growing demand for advanced location-based services (Oracle Press Release).
  • In May 2025, the European Union (EU) approved the deployment of a European Geostationary Navigation Overlay Service (EGNOS) GIS system for telecom network optimization. This approval marked a significant step towards improving network efficiency and reducing costs for telecom operators in the EU, as EGNOS would provide real-time satellite-based navigation data for network planning and management (European Commission Press Release).

Dive into Technavio's robust research methodology, blending expert interviews, extensive data synthesis, and validated models for unparalleled GIS In Telecom Sector Market insights. See full methodology.

Market Scope

Report Coverage

Details

Page number

226

Base year

2024

Historic period

2019-2023

Forecast period

2025-2029

Growth momentum & CAGR

Accelerate at a CAGR of 15.7%

Market growth 2025-2029

USD 2350.3 million

Market structure

Fragmented

YoY growth 2024-2025(%)

13.7

Key countries

US, China, Brazil, India, Germany, Japan, Canada, UK, South Korea, and France

Competitive landscape

Leading Companies, Market Positioning of Companies, Competitive Strategies, and Industry Risks

Request Free Sample

Research Analyst Overview

  • In the dynamic and ever-evolving telecom sector, Geographic Information Systems (GIS) have emerged as indispensable tools for optimizing network performance and managing spatial data infrastructure. GIS data visualization enables telecom companies to gain valuable insights from complex spatial data, facilitating informed decision-making in areas such as site selection, building penetration analysis, and geospatial asset management. Spatial analysis tools, including work order management and asset tracking systems, streamline field data collection and improve network planning. Telecom GIS data fuels network performance monitoring, allowing for real-time identification and resolution of radio frequency interference and signal propagation modeling. Additionally, network capacity planning benefits from data integration platforms, ensuring efficient use of resources and optimizing network design.
  • The adoption of GIS in the telecom sector continues to grow, with an increasing number of companies integrating 3D GIS modeling and LiDAR data processing for more accurate and comprehensive network design. Location-based services, such as customer location mapping and wireless network coverage analysis, further enhance the user experience and enable targeted marketing strategies. Moreover, GIS plays a crucial role in emergency response planning and maintenance scheduling, ensuring telecom networks remain operational during crises and reducing downtime. Infrastructure management, including network design and telecom outage prediction, benefits from advanced geoprocessing techniques and route optimization software, ensuring mobile network optimization and improved network performance.
  • In conclusion, the integration of GIS in the telecom sector has led to significant advancements in network planning, optimization, and management. These tools facilitate efficient workflows, enhance user experiences, and enable data-driven decision-making, ultimately contributing to the ongoing evolution and success of telecom networks.

What are the Key Data Covered in this GIS In Telecom Sector Market Research and Growth Report?

  • What is the expected growth of the GIS In Telecom Sector Market between 2025 and 2029?

    • USD 2.35 billion, at a CAGR of 15.7%

  • What segmentation does the market report cover?

    • The report is segmented by Product (Software, Data, and Services), Deployment (On-premises and Cloud), Application (Mapping, Telematics and navigation, Surveying, and Location based services), and Geography (APAC, North America, Europe, South America, and Middle East and Africa)

  • Which regions are analyzed in the report?

    • APAC, North America, Europe, South America, and Middle East and Africa

  • What are the key growth drivers and market challenges?

    • Increased use of GIS for capacity planning, Communication gap between developers and end-users

  • Who are the major players in the GIS In Telecom Sector Market?

    • Autodesk Inc., Bentley Systems Inc., Blue Marble Geographics, Cadcorp Ltd., Caliper Corp., Cyient Ltd., Esri Global Inc., General Electric Co., Hexagon AB, Hitachi Ltd., L3Harris Technologies Inc., Maxar Technologies Inc., Pitney Bowes Inc., RMSI Pvt. Ltd., Schneider Electric SE, Spatial business systems Inc., SuperMap Software Co. Ltd., and Trimble Inc.

Market Research Insights

  • The Global Positioning System (GIS) in the telecom sector market plays a pivotal role in enhancing operational efficiency, network reliability, and resource allocation. Two significant aspects of this market are capacity management and network topology modeling. According to industry estimates, the global market for GIS in telecom is projected to reach USD 12.5 billion by 2025. Capacity management is crucial for telecom companies to optimize network performance and ensure customer experience. Cloud-based GIS solutions enable real-time data analysis, allowing for proactive capacity management. In contrast, network topology modeling facilitates the visualization and analysis of complex telecom infrastructure, aiding in network deployment and integration strategies.
  • Effective GIS integration can lead to cost optimization, improved data quality assurance, and data security measures. Additionally, mobile GIS applications, project management GIS, and geospatial analytics contribute to enhancing operational efficiency and regulatory compliance. GIS software solutions also facilitate predictive maintenance and spatial decision support, further bolstering network reliability.

We can help! Our analysts can customize this GIS in telecom sector market research report to meet your requirements.

Get in touch

1 Executive Summary

  • 1.1 Market overview
    • Executive Summary - Chart on Market Overview
    • Executive Summary - Data Table on Market Overview
    • Executive Summary - Chart on Global Market Characteristics
    • Executive Summary - Chart on Market by Geography
    • Executive Summary - Chart on Market Segmentation by Product
    • Executive Summary - Chart on Market Segmentation by Deployment
    • Executive Summary - Chart on Market Segmentation by Application
    • Executive Summary - Chart on Incremental Growth
    • Executive Summary - Data Table on Incremental Growth
    • Executive Summary - Chart on Company Market Positioning

2 Technavio Analysis

  • 2.1 Analysis of price sensitivity, lifecycle, customer purchase basket, adoption rates, and purchase criteria
    • Analysis of price sensitivity, lifecycle, customer purchase basket, adoption rates, and purchase criteria
  • 2.2 Criticality of inputs and Factors of differentiation
    • Overview on criticality of inputs and factors of differentiation
  • 2.3 Factors of disruption
    • Overview on factors of disruption
  • 2.4 Impact of drivers and challenges
    • Impact of drivers and challenges in 2024 and 2029

3 Market Landscape

  • 3.1 Market ecosystem
    • Parent Market
    • Data Table on - Parent Market
  • 3.2 Market characteristics
    • Market characteristics analysis
  • 3.3 Value chain analysis
    • Value chain analysis

4 Market Sizing

  • 4.1 Market definition
    • Offerings of companies included in the market definition
  • 4.2 Market segment analysis
    • Market segments
  • 4.3 Market size 2024
    • 4.4 Market outlook: Forecast for 2024-2029
      • Chart on Global - Market size and forecast 2024-2029 ($ million)
      • Data Table on Global - Market size and forecast 2024-2029 ($ million)
      • Chart on Global Market: Year-over-year growth 2024-2029 (%)
      • Data Table on Global Market: Year-over-year growth 2024-2029 (%)

    5 Historic Market Size

    • 5.1 Global GIS In Telecom Sector Market 2019 - 2023
      • Historic Market Size - Data Table on Global GIS In Telecom Sector Market 2019 - 2023 ($ million)
    • 5.2 Product segment analysis 2019 - 2023
      • Historic Market Size - Product Segment 2019 - 2023 ($ million)
    • 5.3 Deployment segment analysis 2019 - 2023
      • Historic Market Size - Deployment Segment 2019 - 2023 ($ million)
    • 5.4 Application segment analysis 2019 - 2023
      • Historic Market Size - Application Segment 2019 - 2023 ($ million)
    • 5.5 Geography segment analysis 2019 - 2023
      • Historic Market Size - Geography Segment 2019 - 2023 ($ million)
    • 5.6 Country segment analysis 2019 - 2023
      • Historic Market Size - Country Segment 2019 - 2023 ($ million)

    6 Qualitative Analysis

    • 6.1 Impact of AI in global GIS in telecom sector market

      7 Five Forces Analysis

      • 7.1 Five forces summary
        • Five forces analysis - Comparison between 2024 and 2029
      • 7.2 Bargaining power of buyers
        • Bargaining power of buyers - Impact of key factors 2024 and 2029
      • 7.3 Bargaining power of suppliers
        • Bargaining power of suppliers - Impact of key factors in 2024 and 2029
      • 7.4 Threat of new entrants
        • Threat of new entrants - Impact of key factors in 2024 and 2029
      • 7.5 Threat of substitutes
        • Threat of substitutes - Impact of key factors in 2024 and 2029
      • 7.6 Threat of rivalry
        • Threat of rivalry - Impact of key factors in 2024 and 2029
      • 7.7 Market condition
        • Chart on Market condition - Five forces 2024 and 2029

      8 Market Segmentation by Product

      • 8.1 Market segments
        • Chart on Product - Market share 2024-2029 (%)
        • Data Table on Product - Market share 2024-2029 (%)
      • 8.2 Comparison by Product
        • Chart on Comparison by Product
        • Data Table on Comparison by Product
      • 8.3 Software - Market size and forecast 2024-2029
        • Chart on Software - Market size and forecast 2024-2029 ($ million)
        • Data Table on Software - Market size and forecast 2024-2029 ($ million)
        • Chart on Software - Year-over-year growth 2024-2029 (%)
        • Data Table on Software - Year-over-year growth 2024-2029 (%)
      • 8.4 Data - Market size and forecast 2024-2029
        • Chart on Data - Market size and forecast 2024-2029 ($ million)
        • Data Table on Data - Market size and forecast 2024-2029 ($ million)
        • Chart on Data - Year-over-year growth 2024-2029 (%)
        • Data Table on Data - Year-over-year growth 2024-2029 (%)
      • 8.5 Services - Market size and forecast 2024-2029
        • Chart on Services - Market size and forecast 2024-2029 ($ million)
        • Data Table on Services - Market size and forecast 2024-2029 ($ million)
        • Chart on Services - Year-over-year growth 2024-2029 (%)
        • Data Table on Services - Year-over-year growth 2024-2029 (%)
      • 8.6 Market opportunity by Product
        • Market opportunity by Product ($ million)
        • Data Table on Market opportunity by Product ($ million)

      9 Market Segmentation by Deployment

      • 9.1 Market segments
        • Chart on Deployment - Market share 2024-2029 (%)
        • Data Table on Deployment - Market share 2024-2029 (%)
      • 9.2 Comparison by Deployment
        • Chart on Comparison by Deployment
        • Data Table on Comparison by Deployment
      • 9.3 On-premises - Market size and forecast 2024-2029
        • Chart on On-premises - Market size and forecast 2024-2029 ($ million)
        • Data Table on On-premises - Market size and forecast 2024-2029 ($ million)
        • Chart on On-premises - Year-over-year growth 2024-2029 (%)
        • Data Table on On-premises - Year-over-year growth 2024-2029 (%)
      • 9.4 Cloud - Market size and forecast 2024-2029
        • Chart on Cloud - Market size and forecast 2024-2029 ($ million)
        • Data Table on Cloud - Market size and forecast 2024-2029 ($ million)
        • Chart on Cloud - Year-over-year growth 2024-2029 (%)
        • Data Table on Cloud - Year-over-year growth 2024-2029 (%)
      • 9.5 Market opportunity by Deployment
        • Market opportunity by Deployment ($ million)
        • Data Table on Market opportunity by Deployment ($ million)

      10 Market Segmentation by Application

      • 10.1 Market segments
        • Chart on Application - Market share 2024-2029 (%)
        • Data Table on Application - Market share 2024-2029 (%)
      • 10.2 Comparison by Application
        • Chart on Comparison by Application
        • Data Table on Comparison by Application
      • 10.3 Mapping - Market size and forecast 2024-2029
        • Chart on Mapping - Market size and forecast 2024-2029 ($ million)
        • Data Table on Mapping - Market size and forecast 2024-2029 ($ million)
        • Chart on Mapping - Year-over-year growth 2024-2029 (%)
        • Data Table on Mapping - Year-over-year growth 2024-2029 (%)
      • 10.4 Telematics and navigation - Market size and forecast 2024-2029
        • Chart on Telematics and navigation - Market size and forecast 2024-2029 ($ million)
        • Data Table on Telematics and navigation - Market size and forecast 2024-2029 ($ million)
        • Chart on Telematics and navigation - Year-over-year growth 2024-2029 (%)
        • Data Table on Telematics and navigation - Year-over-year growth 2024-2029 (%)
      • 10.5 Surveying - Market size and forecast 2024-2029
        • Chart on Surveying - Market size and forecast 2024-2029 ($ million)
        • Data Table on Surveying - Market size and forecast 2024-2029 ($ million)
        • Chart on Surveying - Year-over-year growth 2024-2029 (%)
        • Data Table on Surveying - Year-over-year growth 2024-2029 (%)
      • 10.6 Location based services - Market size and forecast 2024-2029
        • Chart on Location based services - Market size and forecast 2024-2029 ($ million)
        • Data Table on Location based services - Market size and forecast 2024-2029 ($ million)
        • Chart on Location based services - Year-over-year growth 2024-2029 (%)
        • Data Table on Location based services - Year-over-year growth 2024-2029 (%)
      • 10.7 Market opportunity by Application
        • Market opportunity by Application ($ million)
        • Data Table on Market opportunity by Application ($ million)

      11 Customer Landscape

      • 11.1 Customer landscape overview
        • Analysis of price sensitivity, lifecycle, customer purchase basket, adoption rates, and purchase criteria

      12 Geographic Landscape

      • 12.1 Geographic segmentation
        • Chart on Market share by geography 2024-2029 (%)
        • Data Table on Market share by geography 2024-2029 (%)
      • 12.2 Geographic comparison
        • Chart on Geographic comparison
        • Data Table on Geographic comparison
      • 12.3 APAC - Market size and forecast 2024-2029
        • Chart on APAC - Market size and forecast 2024-2029 ($ million)
        • Data Table on APAC - Market size and forecast 2024-2029 ($ million)
        • Chart on APAC - Year-over-year growth 2024-2029 (%)
        • Data Table on APAC - Year-over-year growth 2024-2029 (%)
      • 12.4 North America - Market size and forecast 2024-2029
        • Chart on North America - Market size and forecast 2024-2029 ($ million)
        • Data Table on North America - Market size and forecast 2024-2029 ($ million)
        • Chart on North America - Year-over-year growth 2024-2029 (%)
        • Data Table on North America - Year-over-year growth 2024-2029 (%)
      • 12.5 Europe - Market size and forecast 2024-2029
        • Chart on Europe - Market size and forecast 2024-2029 ($ million)
        • Data Table on Europe - Market size and forecast 2024-2029 ($ million)
        • Chart on Europe - Year-over-year growth 2024-2029 (%)
        • Data Table on Europe - Year-over-year growth 2024-2029 (%)
      • 12.6 South America - Market size and forecast 2024-2029
        • Chart on South America - Market size and forecast 2024-2029 ($ million)
        • Data Table on South America - Market size and forecast 2024-2029 ($ million)
        • Chart on South America - Year-over-year growth 2024-2029 (%)
        • Data Table on South America - Year-over-year growth 2024-2029 (%)
      • 12.7 Middle East and Africa - Market size and forecast 2024-2029
        • Chart on Middle East and Africa - Market size and forecast 2024-2029 ($ million)
        • Data Table on Middle East and Africa - Market size and forecast 2024-2029 ($ million)
        • Chart on Middle East and Africa - Year-over-year growth 2024-2029 (%)
        • Data Table on Middle East and Africa - Year-over-year growth 2024-2029 (%)
      • 12.8 US - Market size and forecast 2024-2029
        • Chart on US - Market size and forecast 2024-2029 ($ million)
        • Data Table on US - Market size and forecast 2024-2029 ($ million)
        • Chart on US - Year-over-year growth 2024-2029 (%)
        • Data Table on US - Year-over-year growth 2024-2029 (%)
      • 12.9 China - Market size and forecast 2024-2029
        • Chart on China - Market size and forecast 2024-2029 ($ million)
        • Data Table on China - Market size and forecast 2024-2029 ($ million)
        • Chart on China - Year-over-year growth 2024-2029 (%)
        • Data Table on China - Year-over-year growth 2024-2029 (%)
      • 12.10 India - Market size and forecast 2024-2029
        • Chart on India - Market size and forecast 2024-2029 ($ million)
        • Data Table on India - Market size and forecast 2024-2029 ($ million)
        • Chart on India - Year-over-year growth 2024-2029 (%)
        • Data Table on India - Year-over-year growth 2024-2029 (%)
      • 12.11 Brazil - Market size and forecast 2024-2029
        • Chart on Brazil - Market size and forecast 2024-2029 ($ million)
        • Data Table on Brazil - Market size and forecast 2024-2029 ($ million)
        • Chart on Brazil - Year-over-year growth 2024-2029 (%)
        • Data Table on Brazil - Year-over-year growth 2024-2029 (%)
      • 12.12 Germany - Market size and forecast 2024-2029
        • Chart on Germany - Market size and forecast 2024-2029 ($ million)
        • Data Table on Germany - Market size and forecast 2024-2029 ($ million)
        • Chart on Germany - Year-over-year growth 2024-2029 (%)
        • Data Table on Germany - Year-over-year growth 2024-2029 (%)
      • 12.13 UK - Market size and forecast 2024-2029
        • Chart on UK - Market size and forecast 2024-2029 ($ million)
        • Data Table on UK - Market size and forecast 2024-2029 ($ million)
        • Chart on UK - Year-over-year growth 2024-2029 (%)
        • Data Table on UK - Year-over-year growth 2024-2029 (%)
      • 12.14 Japan - Market size and forecast 2024-2029
        • Chart on Japan - Market size and forecast 2024-2029 ($ million)
        • Data Table on Japan - Market size and forecast 2024-2029 ($ million)
        • Chart on Japan - Year-over-year growth 2024-2029 (%)
        • Data Table on Japan - Year-over-year growth 2024-2029 (%)
      • 12.15 Canada - Market size and forecast 2024-2029
        • Chart on Canada - Market size and forecast 2024-2029 ($ million)
        • Data Table on Canada - Market size and forecast 2024-2029 ($ million)
        • Chart on Canada - Year-over-year growth 2024-2029 (%)
        • Data Table on Canada - Year-over-year growth 2024-2029 (%)
      • 12.16 France - Market size and forecast 2024-2029
        • Chart on France - Market size and forecast 2024-2029 ($ million)
        • Data Table on France - Market size and forecast 2024-2029 ($ million)
        • Chart on France - Year-over-year growth 2024-2029 (%)
        • Data Table on France - Year-over-year growth 2024-2029 (%)
      • 12.17 South Korea - Market size and forecast 2024-2029
        • Chart on South Korea - Market size and forecast 2024-2029 ($ million)
        • Data Table on South Korea - Market size and forecast 2024-2029 ($ million)
        • Chart on South Korea - Year-over-year growth 2024-2029 (%)
        • Data Table on South Korea - Year-over-year growth 2024-2029 (%)
      • 12.18 Market opportunity by geography
        • Market opportunity by geography ($ million)
        • Data Tables on Market opportunity by geography ($ million)

      13 Drivers, Challenges, and Opportunity/Restraints

      • 13.1 Market drivers
        • 13.2 Market challenges
          • 13.3 Impact of drivers and challenges
            • Impact of drivers and challenges in 2024 and 2029
          • 13.4 Market opportunities/restraints

            14 Competitive Landscape

            • 14.1 Overview
              • 14.2 Competitive Landscape
                • Overview on criticality of inputs and factors of differentiation
              • 14.3 Landscape disruption
                • Overview on factors of disruption
              • 14.4 Industry risks
                • Impact of key risks on business

              15 Competitive Analysis

              • 15.1 Companies profiled
                • Companies covered
              • 15.2 Company ranking index
                • Company ranking index
              • 15.3 Market positioning of companies
                • Matrix on companies position and classification
              • 15.4 Autodesk Inc.
                • Autodesk Inc. - Overview
                • Autodesk Inc. - Business segments
                • Autodesk Inc. - Key news
                • Autodesk Inc. - Key offerings
                • Autodesk Inc. - Segment focus
                • SWOT
              • 15.5 Bentley Systems Inc.
                • Bentley Systems Inc. - Overview
                • Bentley Systems Inc. - Business segments
                • Bentley Systems Inc. - Key news
                • Bentley Systems Inc. - Key offerings
                • Bentley Systems Inc. - Segment focus
                • SWOT
              • 15.6 Blue Marble Geographics
                • Blue Marble Geographics - Overview
                • Blue Marble Geographics - Product / Service
                • Blue Marble Geographics - Key offerings
                • SWOT
              • 15.7 Caliper Corp.
                • Caliper Corp. - Overview
                • Caliper Corp. - Product / Service
                • Caliper Corp. - Key offerings
                • SWOT
              • 15.8 Cyient Ltd.
                • Cyient Ltd. - Overview
                • Cyient Ltd. - Business segments
                • Cyient Ltd. - Key offerings
                • Cyient Ltd. - Segment focus
                • SWOT
              • 15.9 Esri Global Inc.
                • Esri Global Inc. - Overview
                • Esri Global Inc. - Product / Service
                • Esri Global Inc. - Key offerings
                • SWOT
              • 15.10 General Electric Co.
                • General Electric Co. - Overview
                • General Electric Co. - Business segments
                • General Electric Co. - Key news
                • General Electric Co. - Key offerings
                • General Electric Co. - Segment focus
                • SWOT
              • 15.11 Hexagon AB
                • Hexagon AB - Overview
                • Hexagon AB - Business segments
                • Hexagon AB - Key news
                • Hexagon AB - Key offerings
                • Hexagon AB - Segment focus
                • SWOT
              • 15.12 L3Harris Technologies Inc.
                • L3Harris Technologies Inc. - Overview
                • L3Harris Technologies Inc. - Business segments
                • L3Harris Technologies Inc. - Key news
                • L3Harris Technologies Inc. - Key offerings
                • L3Harris Technologies Inc. - Segment focus
                • SWOT
              • 15.13 Maxar Technologies Inc.
                • Maxar Technologies Inc. - Overview
                • Maxar Technologies Inc. - Product / Service
                • Maxar Technologies Inc. - Key news
                • Maxar Technologies Inc. - Key offerings
                • SWOT
              • 15.14 Pitney Bowes Inc.
                • Pitney Bowes Inc. - Overview
                • Pitney Bowes Inc. - Business segments
                • Pitney Bowes Inc. - Key news
                • Pitney Bowes Inc. - Key offerings
                • Pitney Bowes Inc. - Segment focus
                • SWOT
              • 15.15 RMSI Pvt. Ltd.
                • RMSI Pvt. Ltd. - Overview
                • RMSI Pvt. Ltd. - Product / Service
                • RMSI Pvt. Ltd. - Key offerings
                • SWOT
              • 15.16 Schneider Electric SE
                • Schneider Electric SE - Overview
                • Schneider Electric SE - Business segments
                • Schneider Electric SE - Key news
                • Schneider Electric SE - Key offerings
                • Schneider Electric SE - Segment focus
                • SWOT
              • 15.17 Spatial business systems Inc.
                • Spatial business systems Inc. - Overview
                • Spatial business systems Inc. - Product / Service
                • Spatial business systems Inc. - Key offerings
                • SWOT
              • 15.18 Trimble Inc.
                • Trimble Inc. - Overview
                • Trimble Inc. - Business segments
                • Trimble Inc. - Key news
                • Trimble Inc. - Key offerings
                • Trimble Inc. - Segment focus
                • SWOT

              16 Appendix

              • 16.1 Scope of the report
                • 16.2 Inclusions and exclusions checklist
                  • Inclusions checklist
                  • Exclusions checklist
                • 16.3 Currency conversion rates for US$
                  • Currency conversion rates for US$
                • 16.4 Research methodology
                  • Research methodology
                • 16.5 Data procurement
                  • Information sources
                • 16.6 Data validation
                  • Data validation
                • 16.7 Validation techniques employed for market sizing
                  • Validation techniques employed for market sizing
                • 16.8 Data synthesis
                  • Data synthesis
                • 16.9 360 degree market analysis
                  • 360 degree market analysis
                • 16.10 List of abbreviations
                  • List of abbreviations

                Research Methodology

                Technavio presents a detailed picture of the market by way of study, synthesis, and summation of data from multiple sources. The analysts have presented the various facets of the market with a particular focus on identifying the key industry influencers. The data thus presented is comprehensive, reliable, and the result of extensive research, both primary and secondary.

                INFORMATION SOURCES

                Primary sources

                • Manufacturers and suppliers
                • Channel partners
                • Industry experts
                • Strategic decision makers

                Secondary sources

                • Industry journals and periodicals
                • Government data
                • Financial reports of key industry players
                • Historical data
                • Press releases

                DATA ANALYSIS

                Data Synthesis

                • Collation of data
                • Estimation of key figures
                • Analysis of derived insights

                Data Validation

                • Triangulation with data models
                • Reference against proprietary databases
                • Corroboration with industry experts

                REPORT WRITING

                Qualitative

                • Market drivers
                • Market challenges
                • Market trends
                • Five forces analysis

                Quantitative

                • Market size and forecast
                • Market segmentation
                • Geographical insights
                • Competitive landscape

                Interested in this report?

                Get your sample now to see our research methodology and insights!

                Download Now

                Frequently Asked Questions

                Gis In Telecom Sector market growth will increase by $ 2350.3 mn during 2025-2029.

                The Gis In Telecom Sector market is expected to grow at a CAGR of 15.7% during 2025-2029.

                Gis In Telecom Sector market is segmented by Product( Software, Data, Services) Deployment( On-premises, Cloud, Europe, South America, MEA) Application( Mapping, Telematics and navigation, Surveying, Location based services, Middle East and Africa)

                Autodesk Inc., Bentley Systems Inc., Blue Marble Geographics, Cadcorp Ltd., Caliper Corp., Cyient Ltd., Esri Global Inc., General Electric Co., Hexagon AB, Hitachi Ltd., L3Harris Technologies Inc., Maxar Technologies Inc., Pitney Bowes Inc., RMSI Pvt. Ltd., Schneider Electric SE, Spatial business systems Inc., SuperMap Software Co. Ltd., Trimble Inc. are a few of the key vendors in the Gis In Telecom Sector market.

                APAC will register the highest growth rate of 28% among the other regions. Therefore, the Gis In Telecom Sector market in APAC is expected to garner significant business opportunities for the vendors during the forecast period.

                US, China, Brazil, India, Germany, Japan, Canada, UK, South Korea, France

                • Increased use of GIS for capacity planningTelecom companies are continuously leveraging the growing global demand for mobile phones and the Internet by offering diverse services to expand their customer base. While urban markets are highly competitive and saturated is the driving factor this market.
                • many companies are shifting their focus to rural areas is the driving factor this market.
                • where demand is increasing due to rising literacy rates and lower competition. Successfully penetrating the rural market requires careful strategic planning. GIS plays a crucial role by providing insights into market segmentation and consumer usage patterns. It is widely used to design communication network structures by accurately forecasting future regional communication needs. Additionally is the driving factor this market.
                • GIS enhances decision-making by analyzing the existing network framework and its performance. This will increase the in the global GIS in telecom sector market during the forecast period. is the driving factor this market.

                The Gis In Telecom Sector market vendors should focus on grabbing business opportunities from the Software segment as it accounted for the largest market share in the base year.