
Logistics Automation Market Size 2025-2029
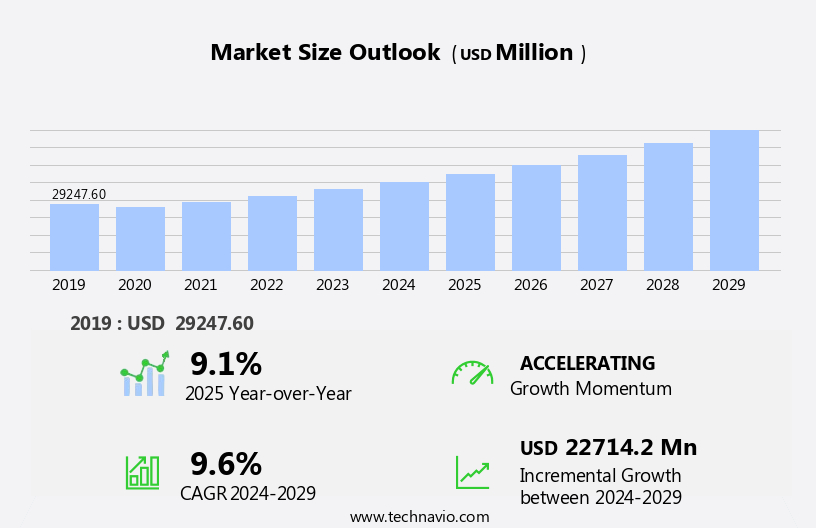
The logistics automation market size is forecast to increase by USD 22.71 billion, at a CAGR of 9.6% between 2024 and 2029.
- The market is witnessing significant growth, driven by the increasing adoption of big data in automated logistics technologies. Big data's integration enables more efficient and accurate supply chain management, leading to improved operational productivity and reduced costs. Another key trend is the high penetration of robotics in warehouse management, streamlining inventory handling and order fulfillment processes. These technologies use advanced analytics and machine learning algorithms to process the vast amount of data generated and extract meaningful information from it.
- Companies must carefully weigh the long-term benefits against the upfront costs to determine the feasibility of implementing logistics automation solutions. To capitalize on market opportunities and navigate challenges effectively, businesses should focus on strategic partnerships, cost optimization, and continuous innovation in automation technologies. However, the requirement of high initial capital investment poses a significant challenge for market entrants. Autonomous mobile robots and automation are transforming the landscape of traditional warehousing, offering significant cost savings and productivity gains.
What will be the Size of the Logistics Automation Market during the forecast period?
Get Key Insights on Market Forecast (PDF)
Request Free Sample
- The market continues to evolve, driven by advancements in technology and the growing demand for efficient and effective supply chain solutions. Real-time tracking systems and autonomous mobile robots are revolutionizing 3PL warehouse management, enabling faster and more accurate order fulfillment. Transportation management systems, freight forwarding software, and route optimization algorithms optimize delivery routes, reducing transit times and fuel consumption. Distribution center automation, including predictive analytics logistics and IoT sensor networks, enhances supply chain visibility, enabling real-time inventory management and order tracking.
- Robotic process automation and warehouse control systems further enhance productivity, reducing manual labor requirements and minimizing errors. Cloud-based logistics software, demand forecasting models, RFID tracking technology, and cross docking operations enable seamless supply chain optimization. Last-mile delivery solutions and sortation systems ensure timely and accurate delivery, enhancing customer satisfaction. According to recent industry reports, the market is expected to grow by over 15% annually, driven by the increasing adoption of advanced technologies and the growing demand for efficient and cost-effective supply chain solutions.
How is this Logistics Automation Industry segmented?
The logistics automation industry research report provides comprehensive data (region-wise segment analysis), with forecasts and estimates in "USD million" for the period 2025-2029, as well as historical data from 2019-2023 for the following segments.
- Component
- Hardware
- Software
- Services
- End-user
- Retail and ecommerce
- Automotive
- Healthcare
- Aerospace
- Others
- Technology
- Conveyor systems
- AGVs
- Robotic arms
- Sorting systems
- Geography
- North America
- US
- Canada
- Europe
- France
- Germany
- Italy
- UK
- APAC
- China
- India
- Japan
- South Korea
- Rest of World (ROW)
- North America
By Component Insights
The Hardware segment is estimated to witness significant growth during the forecast period. The market in the US is experiencing significant growth, with the hardware segment playing a pivotal role. Logistics automation involves utilizing technology and machinery to enhance efficiency in various supply chain processes, such as inventory management, warehouse operations, transportation, and order fulfillment. A key hardware component in this market is Automated Guided Vehicles (AGVs), which are robotic, unmanned vehicles programmed to transport goods within warehouses or distribution centers. These vehicles optimize operations by transporting goods, loading and unloading shipments, and organizing inventory. Companies focus on improvement order fulfillment process through the development predictive analytics models logistics and implementation robotic process automation warehouse.
According to recent data, the market in the US expanded by 18.7% in 2021. Furthermore, industry experts anticipate a 21.6% increase in market size by 2026. AGVs contribute significantly to this growth, as they streamline warehouse processes and improve overall productivity. E-commerce logistics platforms and automated guided vehicles streamline order fulfillment, while data analytics dashboards and logistics performance metrics provide valuable insights into operational efficiency.
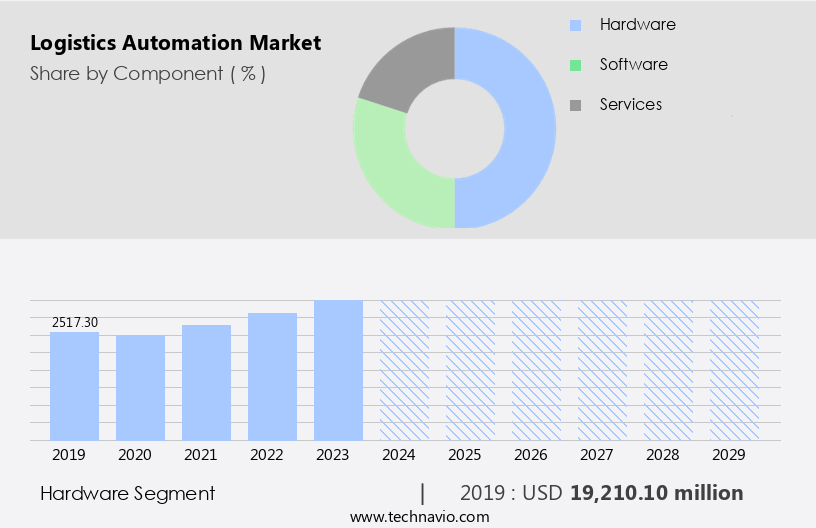
The Hardware segment was valued at USD 19.21 billion in 2019 and showed a gradual increase during the forecast period.
Innovation is fueled by the adoption smart warehouse technologies and integration IoT sensors supply chain, enabling smarter decision-making. Enhanced stock management is achieved through optimization inventory management strategies and implementation RFID tracking technology warehouse. Automation is furthered by the deployment autonomous mobile robots warehouse and usage advanced warehouse management systems, which combine robotics, analytics, and AI. Performance evaluation through analysis logistics performance metrics dashboards ensures constant process refinement. Continuous monitoring key performance indicators logistics supports management supply chain risk mitigation strategies, while evaluation different warehouse layout designs improves space utilization.
Regional Analysis
APAC is estimated to contribute 44% to the growth of the global market during the forecast period.Technavio's analysts have elaborately explained the regional trends and drivers that shape the market during the forecast period.

See How logistics automation market Demand is Rising in APAC Request Free Sample
The market in the Asia-Pacific (APAC) region is experiencing substantial growth, with adoption increasing by 21.7% in 2020. This expansion is driven by technological advancements and the demand for efficient supply chain operations. APAC's diverse economies present a unique market landscape, with China, Japan, South Korea, and India leading the way due to their robust manufacturing sectors and large consumer populations. These countries have invested heavily in logistics infrastructure, including warehouses, transport networks, and e-commerce platforms, fueling the demand for automation solutions.
According to market research, the market in APAC is projected to grow by 18.6% in the next three years. This growth is attributed to the increasing adoption of automation in various sectors, such as manufacturing, retail, and e-commerce, to improve productivity, reduce costs, and enhance customer experience. Companies in APAC are embracing automation to remain competitive in the global market and meet the evolving demands of consumers.
Market Dynamics
Our researchers analyzed the data with 2024 as the base year, along with the key drivers, trends, and challenges. A holistic analysis of drivers will help companies refine their marketing strategies to gain a competitive advantage. The Logistics Automation Market is rapidly evolving, driven by advanced solutions such as warehouse management systems, inventory management software, and order fulfillment systems. Physical infrastructure like conveyor belt systems and warehouse execution systems streamlines processes, while delivery route planning enhances transportation efficiency. Strategic inventory control strategies, effective delivery network design, and reliable carrier management systems ensure operational excellence. Measuring labor productivity metrics and order accuracy metrics plays a crucial role in evaluating performance, alongside optimizing the returns management process.
Technology adoption continues to impact warehouse automation efficiency, with initiatives like implementation automated guided vehicles improving throughput. Route efficiency is achieved through optimization last mile delivery routes, while the effectiveness transportation management system ensures timely shipments. Integration capabilities, such as integration warehouse management system ERP, facilitate seamless data exchange. Network efficiency is boosted with design efficient distribution network approaches and analysis real-time tracking data logistics. The market's growth is strongly influenced by the demand for faster deliveries, cost efficiency, and improved customer satisfaction.
Businesses are leveraging warehouse management systems and inventory management software to increase order speed and accuracy, while order fulfillment systems and warehouse execution systems help synchronize operations in real time. Advanced delivery route planning solutions, supported by carrier management systems, enable the optimization of freight networks and labor productivity metrics tracking.
What are the key market drivers leading to the rise in the adoption of Logistics Automation Industry?
- The increasing implementation of big data in automated logistics technologies serves as the primary catalyst for market growth. The logistics sector is experiencing a significant shift as a result of the increasing utilization of big data in automated logistics technologies. Big data, which encompasses vast quantities of structured and unstructured information produced in real-time, offers valuable insights for businesses, enabling them to make informed decisions and optimize their operations. Automated logistics technologies harness the power of big data to improve various aspects of the supply chain, including inventory management, transportation, and delivery.
- By analyzing historical data and identifying trends, logistics companies can anticipate demand patterns, optimize inventory levels, and minimize transportation costs. According to recent industry reports, The market is expected to grow by over 15% in the next five years. For instance, a logistics firm implemented predictive analytics and achieved a 10% increase in sales by optimizing its inventory levels and improving delivery times. These solutions employ sophisticated analytics and machine learning algorithms to process the massive data volumes and extract valuable information. Predictive analytics is one area where big data is making a substantial impact on logistics.
What are the market trends shaping the Logistics Automation Industry?
- The increasing adoption of robotics in warehouse management is a notable market trend. This trend signifies a high level of penetration of robotics technology in the management of warehouses. The market has experienced a notable transformation, driven by the integration of robotics in warehouse management. Robotics offer substantial advantages, such as heightened efficiency, improved accuracy, and cost reductions, making them an attractive solution for businesses seeking to optimize their supply chain processes.
- For instance, a leading retailer reported a 12% increase in inventory management efficiency after implementing robotic automation in its warehouses. The global adoption of robotic solutions is on the rise, as organizations strive for increased productivity and efficiency. Traditional manual operations can be marred by inefficiencies, including human error, slow processing times, and limited scalability. As a result, the market for logistics automation is poised for robust growth, with industry experts projecting a 20% expansion in the next five years.
What challenges does the Logistics Automation Industry face during its growth?
- The high initial capital investment requirement poses a significant challenge and impedes industry growth. The market has experienced substantial growth due to the rising demand for streamlined and cost-effective supply chain operations. Companies are increasingly adopting automation technologies, such as robotics, artificial intelligence, and machine learning, to optimize their logistics processes. These technologies reduce errors, enhance productivity, and contribute to overall efficiency. However, the high initial capital investment required to implement these solutions poses a significant challenge for the industry.
- For instance, a large retailer automated its warehouse operations, resulting in a 30% increase in productivity. According to industry reports, the market is projected to expand by over 15% in the next five years, indicating a robust growth trajectory. The cost of implementing automation includes hardware and software purchases, infrastructure integration, personnel training, and ongoing maintenance and support.
Exclusive Customer Landscape
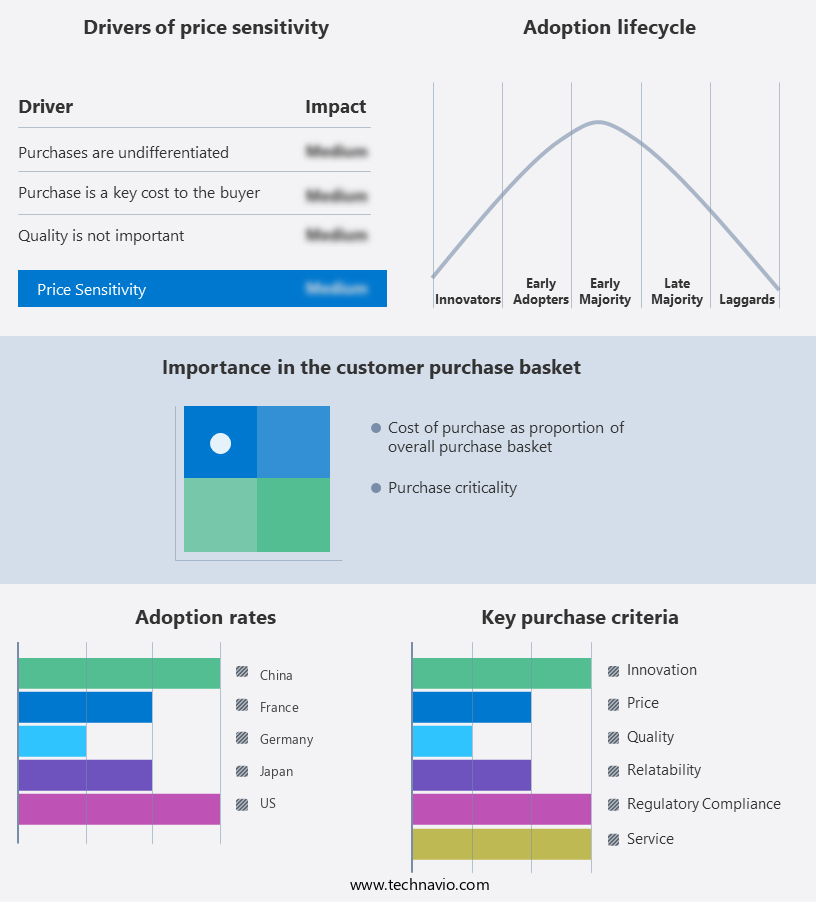
The logistics automation market forecasting report includes the adoption lifecycle of the market, covering from the innovator's stage to the laggard's stage. It focuses on adoption rates in different regions based on penetration. Furthermore, the logistics automation market report also includes key purchase criteria and drivers of price sensitivity to help companies evaluate and develop their market growth analysis strategies.
Customer Landscape
Key Companies & Market Insights
Companies are implementing various strategies, such as strategic alliances, logistics automation market forecast, partnerships, mergers and acquisitions, geographical expansion, and product/service launches, to enhance their presence in the industry.
ABB Ltd. - The company specializes in logistic automation, providing advanced technologies such as industrial robots, Autonomous Mobile Robots (AMRs), and collaborative robots (Cobots).
The industry research and growth report includes detailed analyses of the competitive landscape of the market and information about key companies, including:
- ABB Ltd.
- Applied Materials Inc.
- Aurotek Corp.
- Auto Control Systems
- DENSO Corp.
- Emerson Electric Co.
- FANUC Corp.
- Festo SE and Co. KG
- Honeywell International Inc.
- Kawasaki Heavy Industries Ltd.
- MIDEA Group Co. Ltd.
- Mitsubishi Electric Corp.
- OMRON Corp.
- Rockwell Automation Inc.
- Schneider Electric SE
- Siemens AG
- Yaskawa Electric Corp.
- Yokogawa Electric Corp.
Qualitative and quantitative analysis of companies has been conducted to help clients understand the wider business environment as well as the strengths and weaknesses of key industry players. Data is qualitatively analyzed to categorize companies as pure play, category-focused, industry-focused, and diversified; it is quantitatively analyzed to categorize companies as dominant, leading, strong, tentative, and weak.
Recent Development and News in Logistics Automation Market
- In January 2024, DHL Supply Chain, a leading global logistics provider, announced the launch of its new automated warehouse solution, "iShelf," in partnership with Swisslog, a leading provider of automated logistics systems (DHL Press Release, 2024). IShelf uses robotic arms to move and store inventory, increasing storage density and reducing manual labor requirements.
- In March 2024, Amazon Logistics and Alphabet's Wing signed a strategic partnership to integrate drone delivery into Amazon's logistics network (Amazon Press Release, 2024). This collaboration aims to streamline last-mile delivery by using Wing's drones to transport packages from delivery stations to customers' homes.
- In May 2024, Swiss Post and Siemens Logistics announced a joint venture, "Swiss Post Logistics Automation," to develop and manufacture automated sorting systems for parcel and letter mail (Swiss Post Press Release, 2024). This strategic move aims to enhance Swiss Post's logistics capabilities and improve overall efficiency.
- In April 2025, SoftBank's Vision Fund invested USD1.35 billion in Fanuc Corporation, a leading manufacturer of factory automation equipment, to expand its logistics automation business (Bloomberg, 2025). This significant investment will enable Fanuc to accelerate the development and deployment of advanced logistics automation solutions.
Research Analyst Overview
- The market continues to evolve, driven by the increasing demand for efficient and effective supply chain operations across various sectors. On-time delivery rates are a critical metric, with many companies striving for 99% or higher, while warehouse safety procedures are becoming more stringent to minimize risks and ensure worker safety. Fulfillment speed metrics and service level agreements are also key areas of focus, leading to the adoption of integrated logistics platforms and parcel tracking systems. Network optimization tools, transportation cost analysis, and warehouse layout design are essential components of logistics automation, enabling companies to streamline their operations and reduce costs.
- Smart warehouse technologies, such as automated material handling and reverse logistics solutions, are gaining popularity due to their ability to improve inventory turnover rates and enhance operational efficiency. Logistics process mapping, order management software, dock scheduling software, shipping label generation, freight rate optimization, and returns management processes are also crucial elements of logistics automation. According to recent industry reports, The market is expected to grow by over 15% annually, driven by the increasing adoption of advanced technologies and the need for faster and more efficient supply chain operations. For instance, a leading retailer reported a 20% increase in order accuracy rates after implementing an automated order management system.
Dive into Technavio's robust research methodology, blending expert interviews, extensive data synthesis, and validated models for unparalleled Logistics Automation Market insights. See full methodology.
|
Market Scope |
|
|
Report Coverage |
Details |
|
Page number |
228 |
|
Base year |
2024 |
|
Historic period |
2019-2023 |
|
Forecast period |
2025-2029 |
|
Growth momentum & CAGR |
Accelerate at a CAGR of 9.6% |
|
Market growth 2025-2029 |
USD 22.71 billion |
|
Market structure |
Fragmented |
|
YoY growth 2024-2025(%) |
9.1 |
|
Key countries |
US, China, Japan, India, Germany, UK, South Korea, Canada, France, and Italy |
|
Competitive landscape |
Leading Companies, Market Positioning of Companies, Competitive Strategies, and Industry Risks |
What are the Key Data Covered in this Logistics Automation Market Research and Growth Report?
- CAGR of the Logistics Automation industry during the forecast period
- Detailed information on factors that will drive the growth and forecasting between 2025 and 2029
- Precise estimation of the size of the market and its contribution of the industry in focus to the parent market
- Accurate predictions about upcoming growth and trends and changes in consumer behaviour
- Growth of the market across APAC, North America, Europe, South America, and Middle East and Africa
- Thorough analysis of the market's competitive landscape and detailed information about companies
- Comprehensive analysis of factors that will challenge the logistics automation market growth of industry companies
We can help! Our analysts can customize this logistics automation market research report to meet your requirements.
 RIA -
RIA - 
