Mushroom Market Analysis, Size, and Forecast 2026-2030: Europe (UK, Germany, and The Netherlands), APAC (China, India, and Japan), North America (US, Canada, and Mexico), South America (Brazil, Argentina, and Chile), Middle East and Africa (Turkey, South Africa, and Saudi Arabia), and Rest of World (ROW)

Mushroom Market Analysis, Size, and Forecast 2026-2030:
Europe (UK, Germany, and The Netherlands), APAC (China, India, and Japan), North America (US, Canada, and Mexico), South America (Brazil, Argentina, and Chile), Middle East and Africa (Turkey, South Africa, and Saudi Arabia), and Rest of World (ROW)

Published: Oct 2026 307 Pages SKU: IRTNTR71702

Market Overview at a Glance

$28.47 B
Market Opportunity
7%
CAGR 2025 - 2030
42.3%
APAC Growth
$58.52 B
Fresh mushroom segment 2024

Mushroom Market Size 2026-2030

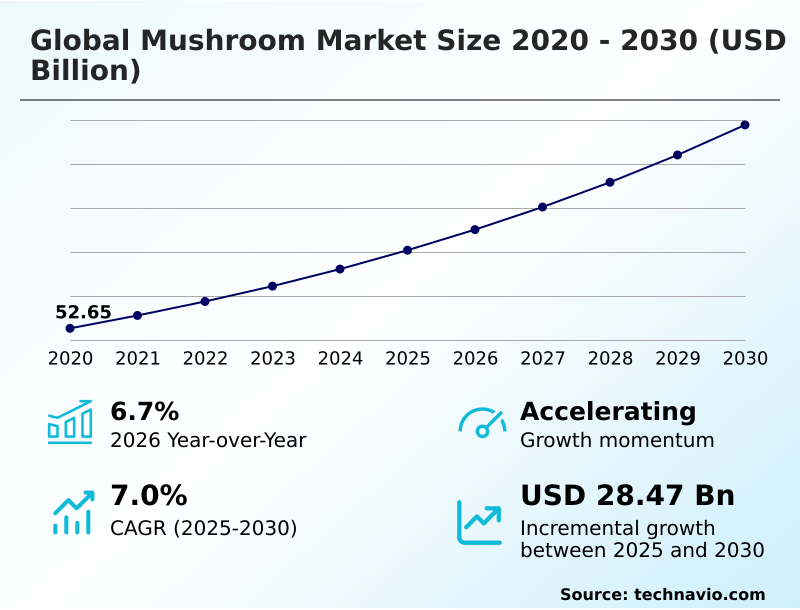
The mushroom market size is valued to increase by USD 28.47 billion, at a CAGR of 7% from 2025 to 2030. Increasing consumer shift toward plant-based diets will drive the mushroom market.

Major Market Trends & Insights

  • APAC dominated the market and accounted for a 42.3% growth during the forecast period.
  • By Type - Fresh mushroom segment was valued at USD 58.52 billion in 2024
  • By Product - Button mushroom segment accounted for the largest market revenue share in 2024

Market Size & Forecast

  • Market Opportunities: USD 46.23 billion
  • Market Future Opportunities: USD 28.47 billion
  • CAGR from 2025 to 2030 : 7%

Market Summary

  • The Mushroom Market demonstrates robust operational expansion driven by an aggressive shift toward sustainable, plant-based nutrition across commercial retail channels. Contemporary food manufacturers continuously integrate edible fungi into diverse product lines to accurately replicate the texture and flavor profiles of traditional meat proteins.
  • Because health-conscious consumers demand clean-label functional ingredients, cultivators scale indoor farming infrastructures to ensure consistent, year-round agricultural output. Implementing automated climate-control systems directly optimizes supply chain resilience, allowing producers to achieve a 25% improvement in crop yield efficiency compared to seasonal outdoor farming.
  • The transition toward flexitarian diets acts as a primary market driver, compelling large-scale commercial caterers to permanently increase their wholesale procurement of specialty fungi. Conversely, the inherently short shelf life of fresh produce presents a severe logistical challenge, causing rapid structural degradation if strict temperature parameters fluctuate during regional transit.
  • To mitigate these specific risks, distributors utilize advanced modified atmosphere packaging to preserve product integrity. These essential technological interventions guarantee consistent retail availability and stabilize long-term operational profitability across the entire supply chain.

What will be the Size of the Mushroom Market during the forecast period?
Get Key Insights on Market Forecast (PDF) Get Free Sample

How is the Mushroom Market Segmented?

The mushroom industry research report provides comprehensive data (region-wise segment analysis), with forecasts and estimates in "USD million" for the period 2026-2030, as well as historical data from 2020-2024 for the following segments.

  • Type
    • Fresh mushroom
    • Canned mushroom
    • Dried mushroom
  • Product
    • Button mushroom
    • Shiitake mushroom
    • Oyster mushroom
    • Others
  • Distribution channel
    • Supermarkets and hypermarkets
    • Grocery stores and convenience stores
    • Specialty stores and direct-to-consumer
    • Foodservice
    • Online
  • Geography
    • Europe
      • UK
      • Germany
      • The Netherlands
      • France
      • Italy
      • Spain
    • APAC
      • China
      • India
      • Japan
      • South Korea
      • Indonesia
      • Australia
    • North America
      • US
      • Canada
      • Mexico
    • South America
      • Brazil
      • Argentina
      • Chile
    • Middle East and Africa
      • Turkey
      • South Africa
      • Saudi Arabia
      • UAE
      • Israel

By Type Insights

The fresh mushroom segment is estimated to witness significant growth during the forecast period.

The fresh segment drives continuous retail engagement by fulfilling the rising demand for unprocessed nutritional profiles, requiring highly optimized supply chain operations. Cultivators deploy controlled environment agriculture and precision agricultural technologies to ensure consistent yields despite external climate volatility.

The integration of modified atmosphere containers directly tackles structural fragility management, reducing spoilage and enhancing shelf viability. By utilizing cold chain logistics, distributors achieve a 15% improvement in post-harvest loss mitigation compared to traditional transit methods.

This efficiency gain allows producers to expand geographic reach without compromising product integrity. Focusing on biological efficiency maximization and eco-friendly cultivation methods, large-scale commercial facilities lower resource expenditure, which increases operational profitability by 12%.

These advanced frameworks guarantee stable revenue streams and dictate fundamental market strategies across regional production hubs.
Get Free Sample

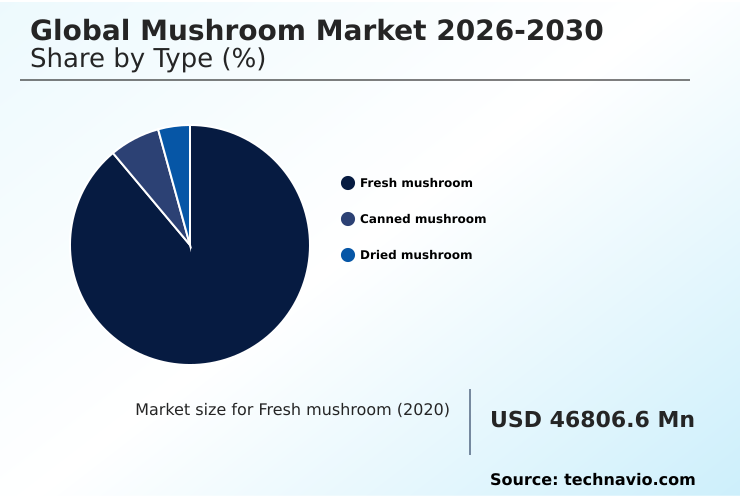
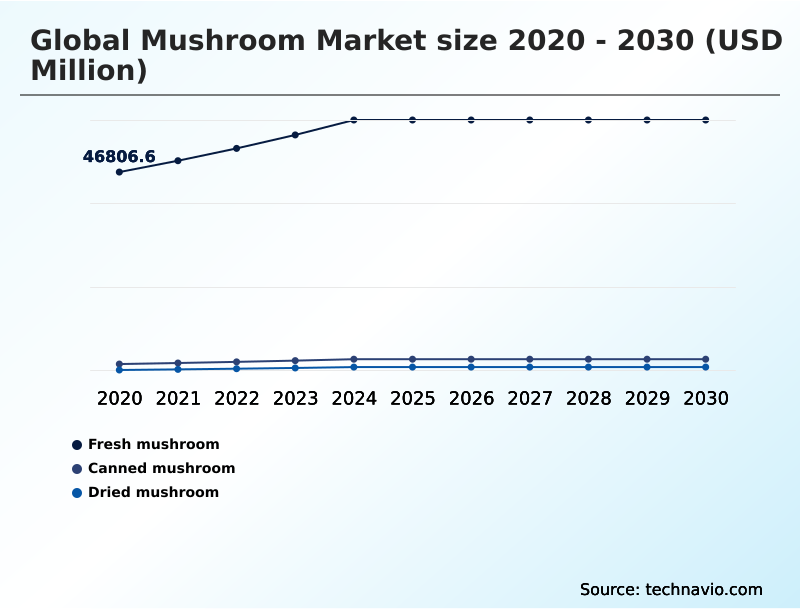
The Fresh mushroom segment was valued at USD 58.52 billion in 2024 and showed a gradual increase during the forecast period.
Get Free Sample

Regional Analysis

APAC is estimated to contribute 42.3% to the growth of the global market during the forecast period.Technavio’s analysts have elaborately explained the regional trends and drivers that shape the market during the forecast period.
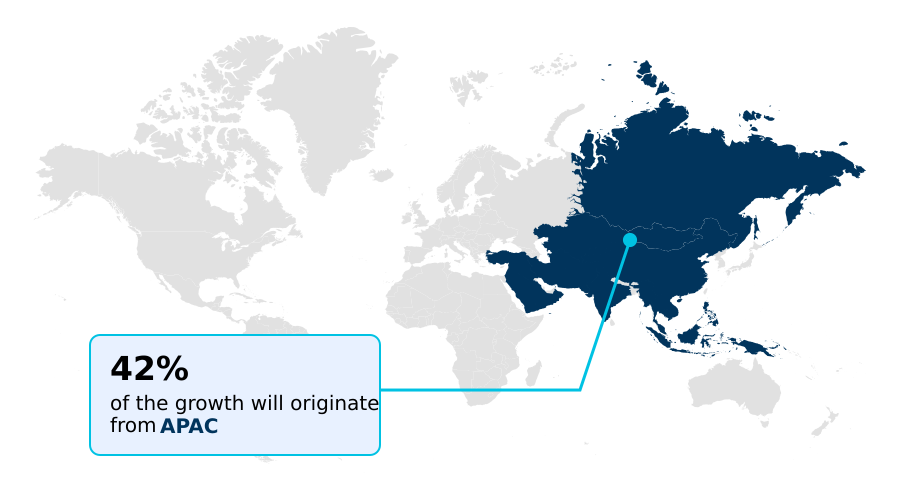
See How Mushroom Market Demand is Rising in APAC Get Free Sample

APAC dominates market production through rapid structural modernization, while Europe accelerates adoption by prioritizing sustainable circular frameworks.

Because the APAC region actively scales urban agriculture solutions, local cultivators integrating automated substrate filling and synthetic substrate blocks achieve a 42% higher yield efficiency than traditional open-field farmers.

Conversely, European enterprises offset high regional labor costs by deploying electronic climate monitoring and climate regulation sensors, reducing energy expenditures by 15%.

To enhance crop uniformity, leading facilities optimize phase three compost and substrate formulation optimization, thereby maximizing mycelial network expansion.

Furthermore, the implementation of advanced water-recycling climate systems in arid environments decreases fresh water usage by 30%, drastically lowering baseline utility expenses.

These specific technological interventions enable multinational producers to adapt local supply chains effectively, ensuring robust profitability across diverse regional landscapes.

Market Dynamics

Our researchers analyzed the data with 2025 as the base year, along with the key drivers, trends, and challenges. A holistic analysis of drivers will help companies refine their marketing strategies to gain a competitive advantage.

  • The commercial viability of the Mushroom Market increasingly relies on the seamless integration of advanced agricultural methodologies and optimized resource management. As consumer demand for high-quality fresh produce surges, operators actively deploy controlled environment agriculture for fungi to eliminate seasonal supply chain disruptions.
  • This structural transition guarantees consistent crop yields and significantly mitigates the risks associated with unpredictable external climate fluctuations. By implementing automated harvesting systems in vertical farming, commercial facilities reduce manual labor requirements, resulting in a 30% operational cost efficiency improvement compared to traditional ground-level cultivation.
  • Furthermore, the pursuit of superior biological output drives enterprises to maximize phase three compost yield efficiency, ensuring robust mycelial growth and minimizing expensive substrate waste. The industry is also witnessing aggressive expansion into non-food sectors, particularly regarding the bioactive compound extraction from mycelium, which supplies highly concentrated ingredients to the rapidly expanding global nutraceutical sector.
  • Simultaneously, corporate mandates prioritizing environmental responsibility accelerate the adoption of sustainable circular agriculture waste upcycling, allowing producers to repurpose agricultural byproducts into valuable compostable materials. These strategic operational pivots fundamentally lower raw material procurement expenses and enhance enterprise compliance with stringent sustainability regulations.
  • Through continuous technological investment and refined biological processing, agricultural stakeholders maintain resilient distribution networks and secure long-term financial stability across diverse commercial channels.
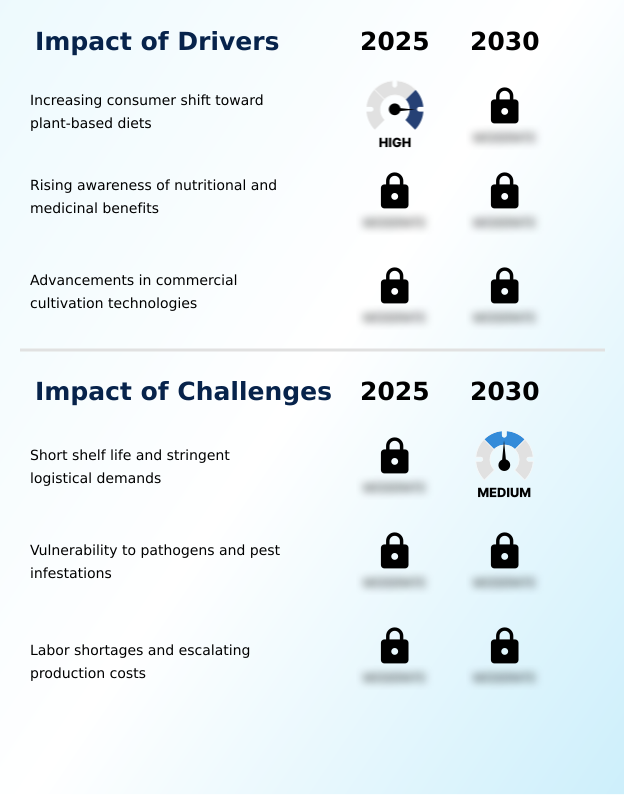
What are the key market drivers leading to the rise in the adoption of Mushroom Industry?

  • The increasing consumer shift toward plant-based diets serves as the primary driver propelling overall market expansion.

  • Surging consumer demand for proactive health management and functional dietary supplements significantly accelerates cultivation volume and profitability. Because contemporary consumers prioritize optimal physiological function, manufacturers increasingly focus on bioactive compound extraction to produce adaptogenic medicinal variants.
  • This strategic pivot toward high-margin wellness products improves overall enterprise revenue by 25% compared to conventional commodity sales. Producers leverage indoor vertical farming to ensure precise environmental control, facilitating consistent beta-glucans concentration and nutritional profile retention.
  • Consequently, the commercial extraction of specific fungi for their moisture retention properties directly enhances product efficacy, boosting customer retention rates by 14%.
  • By integrating these specialized extracts into daily nutritional regimens, commercial cultivators experience a 20% reduction in seasonal sales volatility, stabilizing long-term corporate growth.

What are the market trends shaping the Mushroom Industry?

  • The expansion of fungi-based sustainable packaging and materials represents a significant upcoming market trend. This development introduces eco-friendly alternatives to conventional synthetic logistics solutions.

  • The commercial utilization of mycelium based materials for sustainable packaging fundamentally diversifies industry revenue streams beyond traditional food applications. Because regulatory pressures strictly mandate plastic reduction, manufacturers actively integrate agricultural waste upcycling into compostable organic structures. This operational shift lowers packaging material costs by 22% while improving corporate compliance metrics by 18% compared to synthetic foam alternatives.
  • As producers adopt sustainable circular agriculture, the integration of bioremediation processes and organic growing media enhances resource efficiency. Cultivators expanding into urban agriculture solutions effectively repurpose organic byproducts, establishing a highly profitable circular economy model. This material innovation provides a 30% reduction in overall carbon footprint, directly impacting enterprise sustainability goals.
  • Consequently, the development of plant-based alternative proteins and fungi-derived industrial components guarantees long-term commercial resilience and market expansion.

What challenges does the Mushroom Industry face during its growth?

  • Short shelf life and stringent logistical demands constitute a critical challenge significantly restraining overall industry growth.

  • The inherent perishability and extreme vulnerability of commercial fungi to rapid microbial proliferation present severe logistical and operational constraints. Because enclosed cultivation environments create ideal conditions for pathogens, facilities must implement rigorous hygienic sterilization protocols and biological pest controls to prevent total crop failure. These strict sanitary requirements inflate baseline production expenses by 18% compared to traditional field agriculture.
  • Furthermore, the reliance on manual labor drives a 25% increase in operational costs, forcing enterprises to invest heavily in automated harvesting systems and robotic harvesting mechanisms. To combat enzymatic degradation prevention during transit, distributors utilize hermetic thermal sealing, which reduces regional inventory loss by 12%.
  • Until cultivators fully commercialize resilient disease-resistant strains, these rigorous logistical demands and elevated pathogen risks will continuously compress overall profit margins.

Exclusive Technavio Analysis on Customer Landscape

The mushroom market forecasting report includes the adoption lifecycle of the market, covering from the innovator’s stage to the laggard’s stage. It focuses on adoption rates in different regions based on penetration. Furthermore, the mushroom market report also includes key purchase criteria and drivers of price sensitivity to help companies evaluate and develop their market growth analysis strategies.
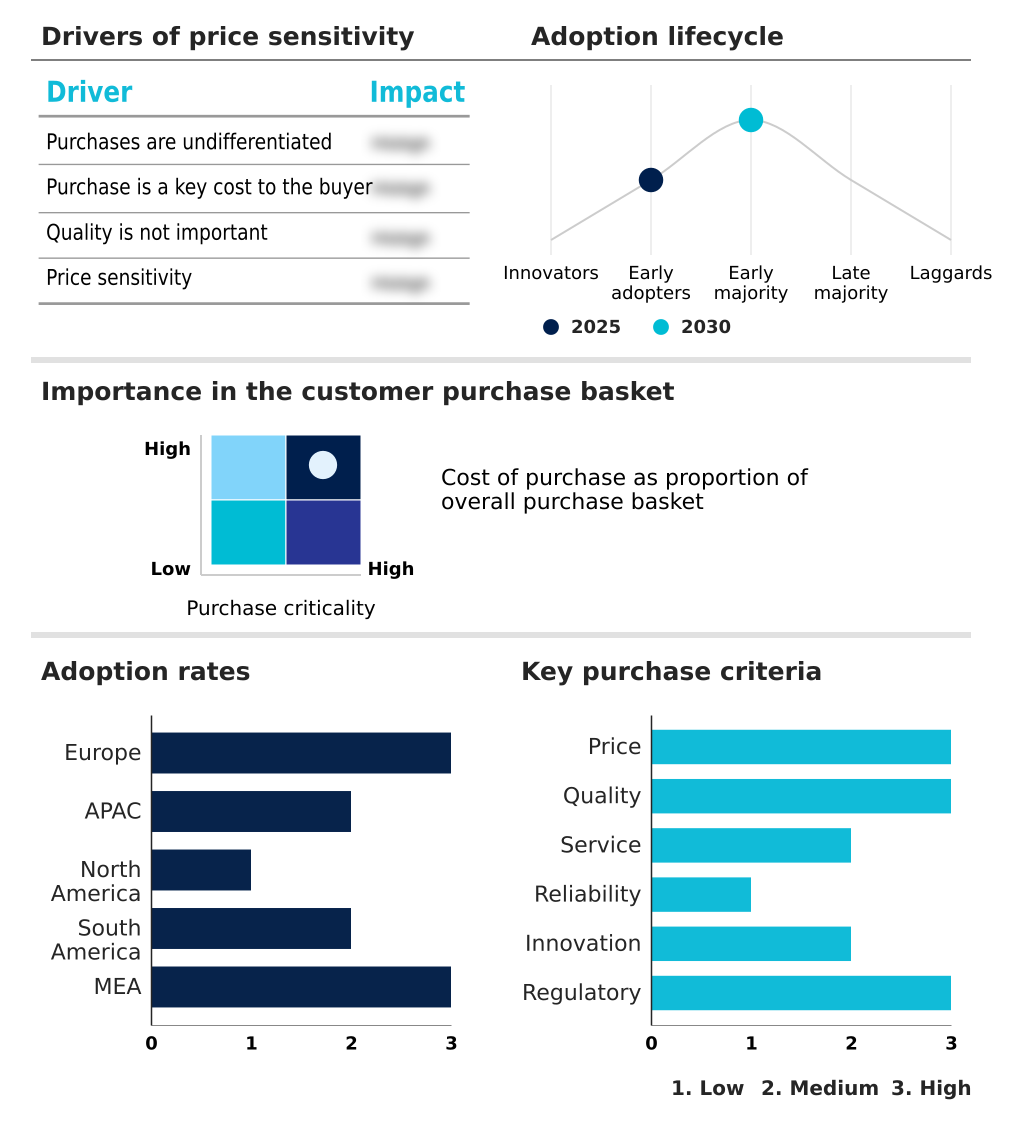
Customer Landscape of Mushroom Industry

Competitive Landscape

Companies are implementing various strategies, such as strategic alliances, mushroom market forecast, partnerships, mergers and acquisitions, geographical expansion, and product/service launches, to enhance their presence in the industry.

Banken Champignons B.V. - The organization cultivates, trades, and distributes a comprehensive portfolio of fresh conventional and specialty fungi, ensuring consistent supply chain operations for diverse commercial retail networks.

The industry research and growth report includes detailed analyses of the competitive landscape of the market and information about key companies, including:

  • Banken Champignons B.V.
  • Basciani Foods Inc.
  • Bonduelle SA
  • Costa Group Holdings Ltd.
  • Dole plc
  • Giorgio Fresh Co.
  • Greenyard
  • Highline Mushrooms
  • HOKUTO Corp.
  • Hughes Group
  • Monaghan Group
  • Monterey Mushrooms Inc.
  • Phillips Mushroom Farms
  • Qihe Biotechnology Co. Ltd.
  • Scelta Mushrooms
  • Smallhold Inc.
  • Smithy Mushrooms Ltd.
  • South Mill Champs
  • Weikfield Foods Pvt. Ltd.
  • White Prince Mushrooms
  • Windmill Mushrooms

Qualitative and quantitative analysis of companies has been conducted to help clients understand the wider business environment as well as the strengths and weaknesses of key industry players. Data is qualitatively analyzed to categorize companies as pure play, category-focused, industry-focused, and diversified; it is quantitatively analyzed to categorize companies as dominant, leading, strong, tentative, and weak.

Recent Development and News in Mushroom market

  • In the Packaged Foods and Meats industry, the widespread integration of plant-based alternative proteins into mainstream retail channels has catalyzed a 35% increase in product reformulation, directly impacting Mushroom demand as manufacturers heavily source dense fungi to replicate traditional meat textures.
  • The implementation of stringent synthetic plastic reduction mandates, such as the European Union Single-Use Plastics Directive, has accelerated the adoption of compostable organic structures, driving cultivators to scale mycelium based materials to fulfill a 40% rise in eco-friendly packaging requirements.
  • Advancements in automated packaging lines and modified atmosphere containers have extended the shelf viability of perishable goods by up to 20%, enabling distributors to mitigate structural fragility management risks and successfully access distant international retail markets.
  • Rising consumer prioritization of optimal physiological function has spurred a 25% expansion in functional dietary supplements, directly boosting overall consumption as food processors actively extract adaptogenic medicinal variants to enhance the nutritional profile retention of premium wellness beverages.

Dive into Technavio’s robust research methodology, blending expert interviews, extensive data synthesis, and validated models for unparalleled Mushroom Market insights. See full methodology.

Market Scope
Page number 307
Base year 2025
Historic period 2020-2024
Forecast period 2026-2030
Growth momentum & CAGR Accelerate at a CAGR of 7%
Market growth 2026-2030 USD 28474.5 million
Market structure Fragmented
YoY growth 2025-2026(%) 6.7%
Key countries UK, Germany, The Netherlands, France, Italy, Spain, China, India, Japan, South Korea, Indonesia, Australia, US, Canada, Mexico, Brazil, Argentina, Chile, Turkey, South Africa, Saudi Arabia, UAE and Israel
Competitive landscape Leading Companies, Market Positioning of Companies, Competitive Strategies, and Industry Risks

Request Free Sample

Research Analyst Overview

  • The Mushroom Market undergoes a profound operational transformation driven by the escalating implementation of controlled environment agriculture. Commercial facilities increasingly leverage automated harvesting systems to mitigate chronic labor shortages, resulting in a 30% reduction in base operational expenses compared to traditional manual harvesting.
  • To ensure consistent crop uniformity, agronomic experts prioritize substrate formulation optimization and utilize high-quality phase three compost, which significantly accelerates mycelial network expansion. This precise environmental management guarantees flawless fruiting body development and robust spore-bearing reproduction throughout the entire calendar year.
  • By maintaining absolute control over temperature and humidity, producers achieve superior beta-glucans concentration, directly catering to the surging demand from the functional wellness sector. This strategic shift away from weather-dependent farming directly aligns with corporate compliance goals and long-term budgetary planning.
  • The continuous refinement of these advanced cultivation protocols stabilizes global supply chains and insulates commercial enterprises against severe seasonal volatility, ensuring resilient commercial distribution.

What are the Key Data Covered in this Mushroom Market Research and Growth Report?

  • What is the expected growth of the Mushroom Market between 2026 and 2030?

    • USD 28.47 billion, at a CAGR of 7%

  • What segmentation does the market report cover?

    • The report is segmented by Type (Fresh mushroom, Canned mushroom, and Dried mushroom), Product (Button mushroom, Shiitake mushroom, Oyster mushroom, and Others), Distribution Channel (Supermarkets and hypermarkets, Grocery stores and convenience stores, Specialty stores and direct-to-consumer, Foodservice, and Online) and Geography (Europe, APAC, North America, South America, Middle East and Africa)

  • Which regions are analyzed in the report?

    • Europe, APAC, North America, South America and Middle East and Africa

  • What are the key growth drivers and market challenges?

    • Increasing consumer shift toward plant-based diets, Short shelf life and stringent logistical demands

  • Who are the major players in the Mushroom Market?

    • Banken Champignons B.V., Basciani Foods Inc., Bonduelle SA, Costa Group Holdings Ltd., Dole plc, Giorgio Fresh Co., Greenyard, Highline Mushrooms, HOKUTO Corp., Hughes Group, Monaghan Group, Monterey Mushrooms Inc., Phillips Mushroom Farms, Qihe Biotechnology Co. Ltd., Scelta Mushrooms, Smallhold Inc., Smithy Mushrooms Ltd., South Mill Champs, Weikfield Foods Pvt. Ltd., White Prince Mushrooms and Windmill Mushrooms

Market Research Insights

  • The Mushroom Market effectively leverages precision agricultural technologies to enhance commercial yield consistency and operational profitability. By integrating smart farming integration and electronic climate monitoring, facility managers reduce energy consumption by 18% and decrease manual labor dependencies. This modernization ensures superior nutritional profile retention and minimizes the risks of structural degradation during rapid transit.
  • Consequently, distributors utilizing advanced thermal processing parameters achieve a 15% reduction in overall post-harvest loss mitigation compared to conventional shipping methodologies. These specific efficiency improvements allow corporate stakeholders to optimize supply chain resilience and maintain stable product availability. The strategic deployment of these automated frameworks ultimately lowers baseline production expenses by 22%, cementing long-term financial viability.

We can help! Our analysts can customize this mushroom market research report to meet your requirements.

Get in touch

1. Executive Summary

1.1 Market overview

Executive Summary - Chart on Market Overview
Executive Summary - Data Table on Market Overview
Executive Summary - Chart on Global Market Characteristics
Executive Summary - Chart on Market by Geography
Executive Summary - Chart on Market Segmentation by Type
Executive Summary - Chart on Market Segmentation by Product
Executive Summary - Chart on Market Segmentation by Distribution Channel
Executive Summary - Chart on Incremental Growth
Executive Summary - Data Table on Incremental Growth
Executive Summary - Chart on Company Market Positioning

2. Technavio Analysis

2.1 Analysis of price sensitivity, lifecycle, customer purchase basket, adoption rates, and purchase criteria

2.2 Criticality of inputs and Factors of differentiation

Chart on Overview on criticality of inputs and factors of differentiation

2.3 Factors of disruption

Chart on Overview on factors of disruption

2.4 Impact of drivers and challenges

Chart on Impact of drivers and challenges in 2025 and 2030

3. Market Landscape

3.1 Market ecosystem

Chart on Parent Market
Data Table on - Parent Market

3.2 Market characteristics

Chart on Market characteristics analysis

3.3 Value chain analysis

Chart on Value chain analysis

4. Market Sizing

4.1 Market definition

Data Table on Offerings of companies included in the market definition

4.2 Market segment analysis

Market segments

4.3 Market size 2025

4.4 Market outlook: Forecast for 2025-2030

Chart on Global - Market size and forecast 2025-2030 ($ million)
Data Table on Global - Market size and forecast 2025-2030 ($ million)
Chart on Global Market: Year-over-year growth 2025-2030 (%)
Data Table on Global Market: Year-over-year growth 2025-2030 (%)

5. Historic Market Size

5.1 Global Mushroom Market 2020 - 2024

Historic Market Size - Data Table on Global Mushroom Market 2020 - 2024 ($ million)

5.2 Type segment analysis 2020 - 2024

Historic Market Size - Type Segment 2020 - 2024 ($ million)

5.3 Product segment analysis 2020 - 2024

Historic Market Size - Product Segment 2020 - 2024 ($ million)

5.4 Distribution Channel segment analysis 2020 - 2024

Historic Market Size - Distribution Channel Segment 2020 - 2024 ($ million)

5.5 Geography segment analysis 2020 - 2024

Historic Market Size - Geography Segment 2020 - 2024 ($ million)

5.6 Country segment analysis 2020 - 2024

Historic Market Size - Country Segment 2020 - 2024 ($ million)

6. Qualitative Analysis

6.1 Impact of AI on global mushroom market

6.2 Impact of geopolitical conflicts on global mushroom market

7. Five Forces Analysis

7.1 Five forces summary

Five forces analysis - Comparison between 2025 and 2030

7.2 Bargaining power of buyers

Bargaining power of buyers - Impact of key factors 2025 and 2030

7.3 Bargaining power of suppliers

Bargaining power of suppliers - Impact of key factors in 2025 and 2030

7.4 Threat of new entrants

Threat of new entrants - Impact of key factors in 2025 and 2030

7.5 Threat of substitutes

Threat of substitutes - Impact of key factors in 2025 and 2030

7.6 Threat of rivalry

Threat of rivalry - Impact of key factors in 2025 and 2030

7.7 Market condition

Chart on Market condition - Five forces 2025 and 2030

8. Market Segmentation by Type

8.1 Market segments

Chart on Type - Market share 2025-2030 (%)
Data Table on Type - Market share 2025-2030 (%)

8.2 Comparison by Type

Chart on Comparison by Type
Data Table on Comparison by Type

8.3 Fresh mushroom - Market size and forecast 2025-2030

Chart on Fresh mushroom - Market size and forecast 2025-2030 ($ million)
Data Table on Fresh mushroom - Market size and forecast 2025-2030 ($ million)
Chart on Fresh mushroom - Year-over-year growth 2025-2030 (%)
Data Table on Fresh mushroom - Year-over-year growth 2025-2030 (%)

8.4 Canned mushroom - Market size and forecast 2025-2030

Chart on Canned mushroom - Market size and forecast 2025-2030 ($ million)
Data Table on Canned mushroom - Market size and forecast 2025-2030 ($ million)
Chart on Canned mushroom - Year-over-year growth 2025-2030 (%)
Data Table on Canned mushroom - Year-over-year growth 2025-2030 (%)

8.5 Dried mushroom - Market size and forecast 2025-2030

Chart on Dried mushroom - Market size and forecast 2025-2030 ($ million)
Data Table on Dried mushroom - Market size and forecast 2025-2030 ($ million)
Chart on Dried mushroom - Year-over-year growth 2025-2030 (%)
Data Table on Dried mushroom - Year-over-year growth 2025-2030 (%)

8.6 Market opportunity by Type

Market opportunity by Type ($ million)
Data Table on Market opportunity by Type ($ million)

9. Market Segmentation by Product

9.1 Market segments

Chart on Product - Market share 2025-2030 (%)
Data Table on Product - Market share 2025-2030 (%)

9.2 Comparison by Product

Chart on Comparison by Product
Data Table on Comparison by Product

9.3 Button mushroom - Market size and forecast 2025-2030

Chart on Button mushroom - Market size and forecast 2025-2030 ($ million)
Data Table on Button mushroom - Market size and forecast 2025-2030 ($ million)
Chart on Button mushroom - Year-over-year growth 2025-2030 (%)
Data Table on Button mushroom - Year-over-year growth 2025-2030 (%)

9.4 Shiitake mushroom - Market size and forecast 2025-2030

Chart on Shiitake mushroom - Market size and forecast 2025-2030 ($ million)
Data Table on Shiitake mushroom - Market size and forecast 2025-2030 ($ million)
Chart on Shiitake mushroom - Year-over-year growth 2025-2030 (%)
Data Table on Shiitake mushroom - Year-over-year growth 2025-2030 (%)

9.5 Oyster mushroom - Market size and forecast 2025-2030

Chart on Oyster mushroom - Market size and forecast 2025-2030 ($ million)
Data Table on Oyster mushroom - Market size and forecast 2025-2030 ($ million)
Chart on Oyster mushroom - Year-over-year growth 2025-2030 (%)
Data Table on Oyster mushroom - Year-over-year growth 2025-2030 (%)

9.6 Others - Market size and forecast 2025-2030

Chart on Others - Market size and forecast 2025-2030 ($ million)
Data Table on Others - Market size and forecast 2025-2030 ($ million)
Chart on Others - Year-over-year growth 2025-2030 (%)
Data Table on Others - Year-over-year growth 2025-2030 (%)

9.7 Market opportunity by Product

Market opportunity by Product ($ million)
Data Table on Market opportunity by Product ($ million)

10. Market Segmentation by Distribution Channel

10.1 Market segments

Chart on Distribution Channel - Market share 2025-2030 (%)
Data Table on Distribution Channel - Market share 2025-2030 (%)

10.2 Comparison by Distribution Channel

Chart on Comparison by Distribution Channel
Data Table on Comparison by Distribution Channel

10.3 Supermarkets and hypermarkets - Market size and forecast 2025-2030

Chart on Supermarkets and hypermarkets - Market size and forecast 2025-2030 ($ million)
Data Table on Supermarkets and hypermarkets - Market size and forecast 2025-2030 ($ million)
Chart on Supermarkets and hypermarkets - Year-over-year growth 2025-2030 (%)
Data Table on Supermarkets and hypermarkets - Year-over-year growth 2025-2030 (%)

10.4 Grocery stores and convenience stores - Market size and forecast 2025-2030

Chart on Grocery stores and convenience stores - Market size and forecast 2025-2030 ($ million)
Data Table on Grocery stores and convenience stores - Market size and forecast 2025-2030 ($ million)
Chart on Grocery stores and convenience stores - Year-over-year growth 2025-2030 (%)
Data Table on Grocery stores and convenience stores - Year-over-year growth 2025-2030 (%)

10.5 Specialty stores and direct-to-consumer - Market size and forecast 2025-2030

Chart on Specialty stores and direct-to-consumer - Market size and forecast 2025-2030 ($ million)
Data Table on Specialty stores and direct-to-consumer - Market size and forecast 2025-2030 ($ million)
Chart on Specialty stores and direct-to-consumer - Year-over-year growth 2025-2030 (%)
Data Table on Specialty stores and direct-to-consumer - Year-over-year growth 2025-2030 (%)

10.6 Foodservice - Market size and forecast 2025-2030

Chart on Foodservice - Market size and forecast 2025-2030 ($ million)
Data Table on Foodservice - Market size and forecast 2025-2030 ($ million)
Chart on Foodservice - Year-over-year growth 2025-2030 (%)
Data Table on Foodservice - Year-over-year growth 2025-2030 (%)

10.7 Online - Market size and forecast 2025-2030

Chart on Online - Market size and forecast 2025-2030 ($ million)
Data Table on Online - Market size and forecast 2025-2030 ($ million)
Chart on Online - Year-over-year growth 2025-2030 (%)
Data Table on Online - Year-over-year growth 2025-2030 (%)

10.8 Market opportunity by Distribution Channel

Market opportunity by Distribution Channel ($ million)
Data Table on Market opportunity by Distribution Channel ($ million)

11. Customer Landscape

11.1 Customer landscape overview

Analysis of price sensitivity, lifecycle, customer purchase basket, adoption rates, and purchase criteria

12. Geographic Landscape

12.1 Geographic segmentation

Chart on Market share by geography 2025-2030 (%)
Data Table on Market share by geography 2025-2030 (%)

12.2 Geographic comparison

Chart on Geographic comparison
Data Table on Geographic comparison

12.3 Europe - Market size and forecast 2025-2030

Chart on Europe - Market size and forecast 2025-2030 ($ million)
Data Table on Europe - Market size and forecast 2025-2030 ($ million)
Chart on Europe - Year-over-year growth 2025-2030 (%)
Data Table on Europe - Year-over-year growth 2025-2030 (%)
Chart on Regional Comparison - Europe
Data Table on Regional Comparison - Europe

12.3.1 UK - Market size and forecast 2025-2030

Chart on UK - Market size and forecast 2025-2030 ($ million)
Data Table on UK - Market size and forecast 2025-2030 ($ million)
Chart on UK - Year-over-year growth 2025-2030 (%)
Data Table on UK - Year-over-year growth 2025-2030 (%)

12.3.2 Germany - Market size and forecast 2025-2030

Chart on Germany - Market size and forecast 2025-2030 ($ million)
Data Table on Germany - Market size and forecast 2025-2030 ($ million)
Chart on Germany - Year-over-year growth 2025-2030 (%)
Data Table on Germany - Year-over-year growth 2025-2030 (%)

12.3.3 The Netherlands - Market size and forecast 2025-2030

Chart on The Netherlands - Market size and forecast 2025-2030 ($ million)
Data Table on The Netherlands - Market size and forecast 2025-2030 ($ million)
Chart on The Netherlands - Year-over-year growth 2025-2030 (%)
Data Table on The Netherlands - Year-over-year growth 2025-2030 (%)

12.3.4 France - Market size and forecast 2025-2030

Chart on France - Market size and forecast 2025-2030 ($ million)
Data Table on France - Market size and forecast 2025-2030 ($ million)
Chart on France - Year-over-year growth 2025-2030 (%)
Data Table on France - Year-over-year growth 2025-2030 (%)

12.3.5 Italy - Market size and forecast 2025-2030

Chart on Italy - Market size and forecast 2025-2030 ($ million)
Data Table on Italy - Market size and forecast 2025-2030 ($ million)
Chart on Italy - Year-over-year growth 2025-2030 (%)
Data Table on Italy - Year-over-year growth 2025-2030 (%)

12.3.6 Spain - Market size and forecast 2025-2030

Chart on Spain - Market size and forecast 2025-2030 ($ million)
Data Table on Spain - Market size and forecast 2025-2030 ($ million)
Chart on Spain - Year-over-year growth 2025-2030 (%)
Data Table on Spain - Year-over-year growth 2025-2030 (%)

12.4 APAC - Market size and forecast 2025-2030

Chart on APAC - Market size and forecast 2025-2030 ($ million)
Data Table on APAC - Market size and forecast 2025-2030 ($ million)
Chart on APAC - Year-over-year growth 2025-2030 (%)
Data Table on APAC - Year-over-year growth 2025-2030 (%)
Chart on Regional Comparison - APAC
Data Table on Regional Comparison - APAC

12.4.1 China - Market size and forecast 2025-2030

Chart on China - Market size and forecast 2025-2030 ($ million)
Data Table on China - Market size and forecast 2025-2030 ($ million)
Chart on China - Year-over-year growth 2025-2030 (%)
Data Table on China - Year-over-year growth 2025-2030 (%)

12.4.2 India - Market size and forecast 2025-2030

Chart on India - Market size and forecast 2025-2030 ($ million)
Data Table on India - Market size and forecast 2025-2030 ($ million)
Chart on India - Year-over-year growth 2025-2030 (%)
Data Table on India - Year-over-year growth 2025-2030 (%)

12.4.3 Japan - Market size and forecast 2025-2030

Chart on Japan - Market size and forecast 2025-2030 ($ million)
Data Table on Japan - Market size and forecast 2025-2030 ($ million)
Chart on Japan - Year-over-year growth 2025-2030 (%)
Data Table on Japan - Year-over-year growth 2025-2030 (%)

12.4.4 South Korea - Market size and forecast 2025-2030

Chart on South Korea - Market size and forecast 2025-2030 ($ million)
Data Table on South Korea - Market size and forecast 2025-2030 ($ million)
Chart on South Korea - Year-over-year growth 2025-2030 (%)
Data Table on South Korea - Year-over-year growth 2025-2030 (%)

12.4.5 Indonesia - Market size and forecast 2025-2030

Chart on Indonesia - Market size and forecast 2025-2030 ($ million)
Data Table on Indonesia - Market size and forecast 2025-2030 ($ million)
Chart on Indonesia - Year-over-year growth 2025-2030 (%)
Data Table on Indonesia - Year-over-year growth 2025-2030 (%)

12.4.6 Australia - Market size and forecast 2025-2030

Chart on Australia - Market size and forecast 2025-2030 ($ million)
Data Table on Australia - Market size and forecast 2025-2030 ($ million)
Chart on Australia - Year-over-year growth 2025-2030 (%)
Data Table on Australia - Year-over-year growth 2025-2030 (%)

12.5 North America - Market size and forecast 2025-2030

Chart on North America - Market size and forecast 2025-2030 ($ million)
Data Table on North America - Market size and forecast 2025-2030 ($ million)
Chart on North America - Year-over-year growth 2025-2030 (%)
Data Table on North America - Year-over-year growth 2025-2030 (%)
Chart on Regional Comparison - North America
Data Table on Regional Comparison - North America

12.5.1 US - Market size and forecast 2025-2030

Chart on US - Market size and forecast 2025-2030 ($ million)
Data Table on US - Market size and forecast 2025-2030 ($ million)
Chart on US - Year-over-year growth 2025-2030 (%)
Data Table on US - Year-over-year growth 2025-2030 (%)

12.5.2 Canada - Market size and forecast 2025-2030

Chart on Canada - Market size and forecast 2025-2030 ($ million)
Data Table on Canada - Market size and forecast 2025-2030 ($ million)
Chart on Canada - Year-over-year growth 2025-2030 (%)
Data Table on Canada - Year-over-year growth 2025-2030 (%)

12.5.3 Mexico - Market size and forecast 2025-2030

Chart on Mexico - Market size and forecast 2025-2030 ($ million)
Data Table on Mexico - Market size and forecast 2025-2030 ($ million)
Chart on Mexico - Year-over-year growth 2025-2030 (%)
Data Table on Mexico - Year-over-year growth 2025-2030 (%)

12.6 South America - Market size and forecast 2025-2030

Chart on South America - Market size and forecast 2025-2030 ($ million)
Data Table on South America - Market size and forecast 2025-2030 ($ million)
Chart on South America - Year-over-year growth 2025-2030 (%)
Data Table on South America - Year-over-year growth 2025-2030 (%)
Chart on Regional Comparison - South America
Data Table on Regional Comparison - South America

12.6.1 Brazil - Market size and forecast 2025-2030

Chart on Brazil - Market size and forecast 2025-2030 ($ million)
Data Table on Brazil - Market size and forecast 2025-2030 ($ million)
Chart on Brazil - Year-over-year growth 2025-2030 (%)
Data Table on Brazil - Year-over-year growth 2025-2030 (%)

12.6.2 Argentina - Market size and forecast 2025-2030

Chart on Argentina - Market size and forecast 2025-2030 ($ million)
Data Table on Argentina - Market size and forecast 2025-2030 ($ million)
Chart on Argentina - Year-over-year growth 2025-2030 (%)
Data Table on Argentina - Year-over-year growth 2025-2030 (%)

12.6.3 Chile - Market size and forecast 2025-2030

Chart on Chile - Market size and forecast 2025-2030 ($ million)
Data Table on Chile - Market size and forecast 2025-2030 ($ million)
Chart on Chile - Year-over-year growth 2025-2030 (%)
Data Table on Chile - Year-over-year growth 2025-2030 (%)

12.7 Middle East and Africa - Market size and forecast 2025-2030

Chart on Middle East and Africa - Market size and forecast 2025-2030 ($ million)
Data Table on Middle East and Africa - Market size and forecast 2025-2030 ($ million)
Chart on Middle East and Africa - Year-over-year growth 2025-2030 (%)
Data Table on Middle East and Africa - Year-over-year growth 2025-2030 (%)
Chart on Regional Comparison - Middle East and Africa
Data Table on Regional Comparison - Middle East and Africa

12.7.1 Turkey - Market size and forecast 2025-2030

Chart on Turkey - Market size and forecast 2025-2030 ($ million)
Data Table on Turkey - Market size and forecast 2025-2030 ($ million)
Chart on Turkey - Year-over-year growth 2025-2030 (%)
Data Table on Turkey - Year-over-year growth 2025-2030 (%)

12.7.2 South Africa - Market size and forecast 2025-2030

Chart on South Africa - Market size and forecast 2025-2030 ($ million)
Data Table on South Africa - Market size and forecast 2025-2030 ($ million)
Chart on South Africa - Year-over-year growth 2025-2030 (%)
Data Table on South Africa - Year-over-year growth 2025-2030 (%)

12.7.3 Saudi Arabia - Market size and forecast 2025-2030

Chart on Saudi Arabia - Market size and forecast 2025-2030 ($ million)
Data Table on Saudi Arabia - Market size and forecast 2025-2030 ($ million)
Chart on Saudi Arabia - Year-over-year growth 2025-2030 (%)
Data Table on Saudi Arabia - Year-over-year growth 2025-2030 (%)

12.7.4 UAE - Market size and forecast 2025-2030

Chart on UAE - Market size and forecast 2025-2030 ($ million)
Data Table on UAE - Market size and forecast 2025-2030 ($ million)
Chart on UAE - Year-over-year growth 2025-2030 (%)
Data Table on UAE - Year-over-year growth 2025-2030 (%)

12.7.5 Israel - Market size and forecast 2025-2030

Chart on Israel - Market size and forecast 2025-2030 ($ million)
Data Table on Israel - Market size and forecast 2025-2030 ($ million)
Chart on Israel - Year-over-year growth 2025-2030 (%)
Data Table on Israel - Year-over-year growth 2025-2030 (%)

12.8 Market opportunity by geography

Market opportunity by geography ($ million)
Data Tables on Market opportunity by geography ($ million)

13. Drivers, Challenges, and Opportunity

13.1 Market drivers

Increasing consumer shift toward plant-based diets
Rising awareness of nutritional and medicinal benefits
Advancements in commercial cultivation technologies

13.2 Market challenges

Short shelf life and stringent logistical demands
Vulnerability to pathogens and pest infestations
Labor shortages and escalating production costs

13.3 Impact of drivers and challenges

Impact of drivers and challenges in 2025 and 2030

13.4 Market opportunities

Expansion of fungi-based sustainable packaging and materials
Integration of fungal derivatives in cosmetics and personal care
Rising popularity of at-home cultivation kits and hobbyist farming

14. Competitive Landscape

14.1 Overview

14.2

Overview on criticality of inputs and factors of differentiation

14.3 Landscape disruption

Overview on factors of disruption

14.4 Industry risks

Impact of key risks on business

15. Competitive Analysis

15.1 Companies profiled

Companies covered

15.2 Company ranking index

15.3 Market positioning of companies

Matrix on companies position and classification

15.4 Banken Champignons B.V.

Banken Champignons B.V. - Overview
Banken Champignons B.V. - Product / Service
Banken Champignons B.V. - Key offerings
SWOT

15.5 Basciani Foods Inc.

Basciani Foods Inc. - Overview
Basciani Foods Inc. - Product / Service
Basciani Foods Inc. - Key offerings
SWOT

15.6 Bonduelle SA

Bonduelle SA - Overview
Bonduelle SA - Business segments
Bonduelle SA - Key offerings
Bonduelle SA - Segment focus
SWOT

15.7 Costa Group Holdings Ltd.

Costa Group Holdings Ltd. - Overview
Costa Group Holdings Ltd. - Product / Service
Costa Group Holdings Ltd. - Key offerings
SWOT

15.8 Dole plc

Dole plc - Overview
Dole plc - Business segments
Dole plc - Key offerings
Dole plc - Segment focus
SWOT

15.9 Giorgio Fresh Co.

Giorgio Fresh Co. - Overview
Giorgio Fresh Co. - Product / Service
Giorgio Fresh Co. - Key offerings
SWOT

15.10 Greenyard

Greenyard - Overview
Greenyard - Product / Service
Greenyard - Key offerings
SWOT

15.11 Highline Mushrooms

Highline Mushrooms - Overview
Highline Mushrooms - Product / Service
Highline Mushrooms - Key offerings
SWOT

15.12 HOKUTO Corp.

HOKUTO Corp. - Overview
HOKUTO Corp. - Product / Service
HOKUTO Corp. - Key offerings
SWOT

15.13 Hughes Group

Hughes Group - Overview
Hughes Group - Product / Service
Hughes Group - Key offerings
SWOT

15.14 Monaghan Group

Monaghan Group - Overview
Monaghan Group - Product / Service
Monaghan Group - Key offerings
SWOT

15.15 Monterey Mushrooms Inc.

Monterey Mushrooms Inc. - Overview
Monterey Mushrooms Inc. - Product / Service
Monterey Mushrooms Inc. - Key offerings
SWOT

15.16 Phillips Mushroom Farms

Phillips Mushroom Farms - Overview
Phillips Mushroom Farms - Product / Service
Phillips Mushroom Farms - Key offerings
SWOT

15.17 Qihe Biotechnology Co. Ltd.

Qihe Biotechnology Co. Ltd. - Overview
Qihe Biotechnology Co. Ltd. - Product / Service
Qihe Biotechnology Co. Ltd. - Key offerings
SWOT

15.18 Weikfield Foods Pvt. Ltd.

Weikfield Foods Pvt. Ltd. - Overview
Weikfield Foods Pvt. Ltd. - Product / Service
Weikfield Foods Pvt. Ltd. - Key offerings
SWOT

16. Appendix

16.1 Scope of the report

Market definition
Objectives
Notes and caveats

16.2 Inclusions and exclusions checklist

Inclusions checklist
Exclusions checklist

16.3 Currency conversion rates for US$

16.4 Research methodology

16.5 Data procurement

Information sources

16.6 Data validation

16.7 Validation techniques employed for market sizing

16.8 Data synthesis

16.9 360 degree market analysis

16.10 List of abbreviations

Research Methodology

Technavio presents a detailed picture of the market by way of study, synthesis, and summation of data from multiple sources. The analysts have presented the various facets of the market with a particular focus on identifying the key industry influencers. The data thus presented is comprehensive, reliable, and the result of extensive research, both primary and secondary.

INFORMATION SOURCES

Primary sources

  • Manufacturers and suppliers
  • Channel partners
  • Industry experts
  • Strategic decision makers

Secondary sources

  • Industry journals and periodicals
  • Government data
  • Financial reports of key industry players
  • Historical data
  • Press releases

DATA ANALYSIS

Data Synthesis

  • Collation of data
  • Estimation of key figures
  • Analysis of derived insights

Data Validation

  • Triangulation with data models
  • Reference against proprietary databases
  • Corroboration with industry experts

REPORT WRITING

Qualitative

  • Market drivers
  • Market challenges
  • Market trends
  • Five forces analysis

Quantitative

  • Market size and forecast
  • Market segmentation
  • Geographical insights
  • Competitive landscape

Interested in this report?

Get your sample now to see our research methodology and insights!

Download Now

Frequently Asked Questions

Mushroom market growth will increase by USD 28474.5 million during 2026-2030.

The Mushroom market is expected to grow at a CAGR of 7% during 2026-2030.

Mushroom market is segmented by Type (Fresh mushroom, Canned mushroom, Dried mushroom) Product (Button mushroom, Shiitake mushroom, Oyster mushroom, Others) Distribution channel (Supermarkets and hypermarkets, Grocery stores and convenience stores, Specialty stores and direct-to-consumer, Foodservice, Online)

Banken Champignons B.V., Basciani Foods Inc., Bonduelle SA, Costa Group Holdings Ltd., Dole plc, Giorgio Fresh Co., Greenyard, Highline Mushrooms, HOKUTO Corp., Hughes Group, Monaghan Group, Monterey Mushrooms Inc., Phillips Mushroom Farms, Qihe Biotechnology Co. Ltd., Scelta Mushrooms, Smallhold Inc., Smithy Mushrooms Ltd., South Mill Champs, Weikfield Foods Pvt. Ltd., White Prince Mushrooms, Windmill Mushrooms are a few of the key vendors in the Mushroom market.

APAC will register the highest growth rate of 42.3% among the other regions. Therefore, the Mushroom market in APAC is expected to garner significant business opportunities for the vendors during the forecast period.

UK, Germany, The Netherlands, France, Italy, Spain, China, India, Japan, South Korea, Indonesia, Australia, US, Canada, Mexico, Brazil, Argentina, Chile, Turkey, South Africa, Saudi Arabia, UAE, Israel

  • Increasing consumer shift toward plant-based diets is the driving factor this market.

The Mushroom market vendors should focus on grabbing business opportunities from the Type segment as it accounted for the largest market share in the base year.
RIA - Research AI Assistant
Ask RIA
