
Naval Vessels MRO Market Analysis, Size, and Forecast 2026-2030: North America (US, Canada, and Mexico), APAC (China, Japan, and India), Europe (Germany, UK, and France), South America (Brazil, Argentina, and Chile), Middle East and Africa (Saudi Arabia, UAE, and South Africa), and Rest of World (ROW)

Naval Vessels MRO Market Analysis, Size, and Forecast 2026-2030:
North America (US, Canada, and Mexico), APAC (China, Japan, and India), Europe (Germany, UK, and France), South America (Brazil, Argentina, and Chile), Middle East and Africa (Saudi Arabia, UAE, and South Africa), and Rest of World (ROW)

Published: Oct 2026 312 Pages SKU: IRTNTR45495

Market Overview at a Glance

$9.86 B
Market Opportunity
7.2%
CAGR 2025 - 2030
48.9%
North America Growth
$8.76 B
Dry dock MRO segment 2024

Naval Vessels Mro Market Size 2026-2030

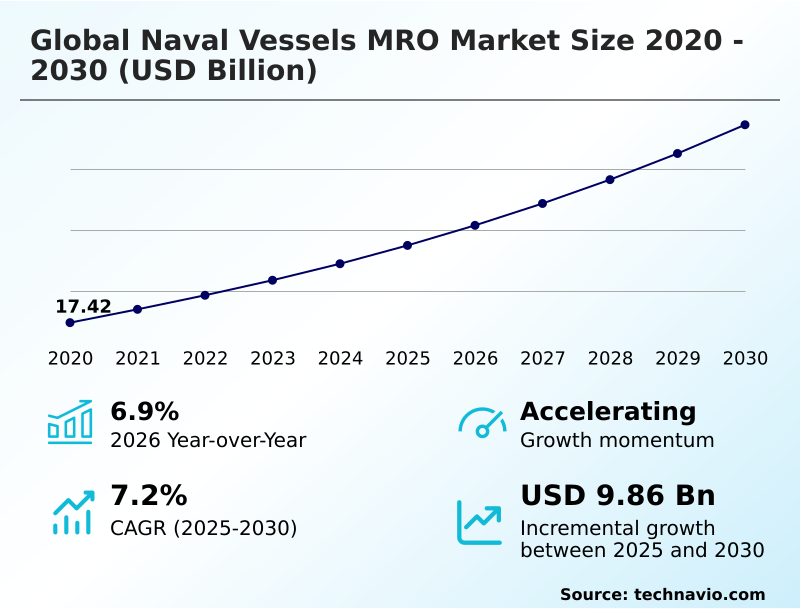
The naval vessels mro market size is valued to increase by USD 9.86 billion, at a CAGR of 7.2% from 2025 to 2030. Aging naval fleets and the extension of operational lifecycles will drive the naval vessels mro market.

Major Market Trends & Insights

  • North America dominated the market and accounted for a 48.9% growth during the forecast period.
  • By Type - Dry dock MRO segment was valued at USD 8.76 billion in 2024
  • By Vessel Orientation - Destroyers segment accounted for the largest market revenue share in 2024

Market Size & Forecast

  • Market Opportunities: USD 16.18 billion
  • Market Future Opportunities: USD 9.86 billion
  • CAGR from 2025 to 2030 : 7.2%

Market Summary

  • The Naval Vessels MRO functions as a highly specialized industrial ecosystem dedicated to sustaining and upgrading sophisticated maritime defense platforms. The continuous aging of maritime assets combined with escalating geopolitical security mandates drives intense demand for comprehensive life extension program initiatives and electronic warfare suite upgrade installations.
  • By prioritizing fleet readiness optimization, defense ministries frequently bypass capital-intensive new builds in favor of deep structural retrofits. However, severe capacity limitations in deep-water shipyard capacity and persistent shortages of certified marine engineers create critical project scheduling bottlenecks.
  • In a real-world supply chain optimization scenario, shipyards adopting advanced automated diagnostic tool networks have successfully mitigated parts obsolescence, reducing component procurement delays by 20% compared to traditional reactive ordering methods. This technological pivot allows operators to execute rapid acoustic signature management and marine gas turbine maintenance with greater precision.
  • Ultimately, balancing intense operational deployment cycles against fragile defense supply chains dictates the strategic execution of complex refit operation workflows across the maritime defense industrial base.

What will be the Size of the Naval Vessels Mro Market during the forecast period?
Get Key Insights on Market Forecast (PDF) Get Free Sample

How is the Naval Vessels Mro Market Segmented?

The naval vessels mro industry research report provides comprehensive data (region-wise segment analysis), with forecasts and estimates in "USD million" for the period 2026-2030, as well as historical data from 2020-2024 for the following segments.

  • Type
    • Dry dock MRO
    • Component MRO
    • Engine MRO
    • Modification
  • Vessel orientation
    • Destroyers
    • Submarines
    • Frigates
    • Aircraft carriers
    • Others
  • Service
    • Preventive maintenance
    • Corrective maintenance
    • Overhaul and refurbishment
  • Geography
    • North America
      • US
      • Canada
      • Mexico
    • APAC
      • China
      • Japan
      • India
      • South Korea
      • Australia
      • Indonesia
    • Europe
      • Germany
      • UK
      • France
      • Italy
      • Spain
      • The Netherlands
    • South America
      • Brazil
      • Argentina
      • Chile
    • Middle East and Africa
      • Saudi Arabia
      • UAE
      • South Africa
      • Israel
      • Turkey

By Type Insights

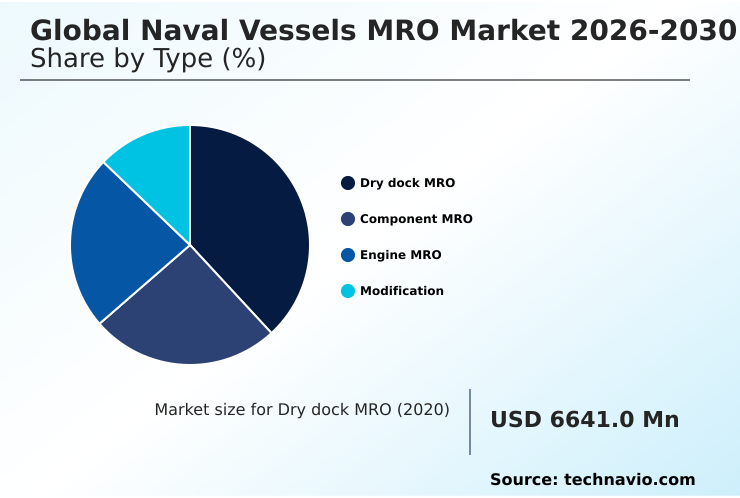
The dry dock mro segment is estimated to witness significant growth during the forecast period.

The dry dock segment serves as a fundamental operational pillar for maritime defense forces, facilitating critical deep-level interventions that cannot be executed while vessels remain afloat.

This phase encompasses specialized underwater hull inspection and critical auxiliary machinery refurbishment to ensure optimal hydrodynamics.

By utilizing a high-capacity dry dock dewatering system, engineers successfully apply an advanced anti-fouling coating, directly extending the deployment lifecycle of strategic assets during a major amphibious assault ship overhaul.

Integrating structured performance-based logistics has enhanced structural longevity, with targeted hull preservation reducing unexpected operational downtime by 15% annually.

This structured approach to deep-water maintenance guarantees baseline buoyancy and mission safety, ensuring fleet commanders maintain reliable marine gas turbine maintenance cycles and secure ongoing rotary-wing aviation support during prolonged geopolitical deployments.
Get Free Sample

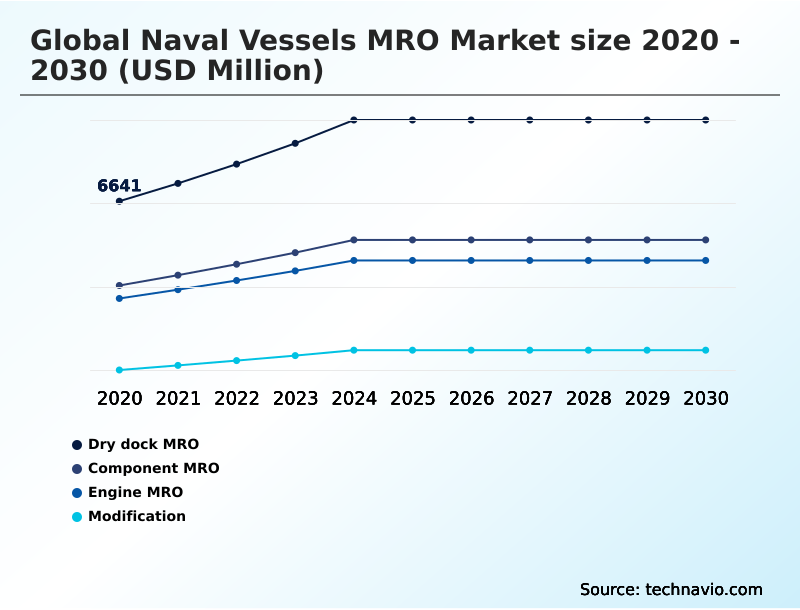
The Dry dock MRO segment was valued at USD 8.76 billion in 2024 and showed a gradual increase during the forecast period.
Get Free Sample

Regional Analysis

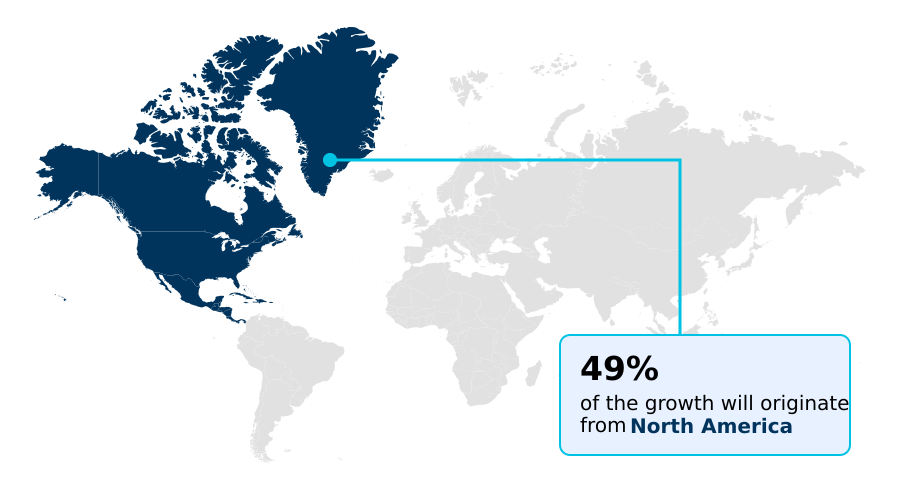
North America is estimated to contribute 48.9% to the growth of the global market during the forecast period.Technavio’s analysts have elaborately explained the regional trends and drivers that shape the market during the forecast period.
See How Naval Vessels Mro Market Demand is Rising in North America Get Free Sample

The geographic distribution of the Naval Vessels MRO highlights distinct operational disparities between North America and APAC.

North America maintains dominant infrastructure geared toward nuclear reactor refueling and a complex refit operation, achieving a 25% higher efficiency rate in executing a scheduled dry dock overhaul cycle.

Regional yards utilize advanced non-destructive testing to perfect acoustic signature management and deep-water sonar array calibration. Conversely, the expanding APAC theater focuses heavily on forward-deployed maintenance and littoral combat ship sustainment, addressing wear from aggressive patrols.

APAC shipyards have increased specialized capacity investments by 30%, prioritizing offshore patrol vessel upkeep and rigorous submarine pressure hull certification to meet surging readiness demands.

This contrast demonstrates how North American yards focus on deep legacy asset preservation, while APAC facilities prioritize scalable, high-velocity turnaround capabilities.

Market Dynamics

Our researchers analyzed the data with 2025 as the base year, along with the key drivers, trends, and challenges. A holistic analysis of drivers will help companies refine their marketing strategies to gain a competitive advantage.

  • The execution of complex maritime defense support requires deep integration of cutting-edge technology and resilient logistics. Within the modern shipyard environment, engineers prioritizing an advanced marine gas turbine overhaul consistently achieve superior operational readiness compared to facilities relying on traditional analog diagnostic methods.
  • For instance, the implementation of naval predictive maintenance artificial intelligence enables fleet commanders to detect microscopic component anomalies well before catastrophic failures occur, effectively reducing unscheduled repair delays by more than 15%. This proactive operational planning directly supports the rigorous demands of a nuclear powered aircraft carrier refit, where continuous mission availability is a non-negotiable strategic requirement.
  • Furthermore, targeted surface combatant structural hull preservation protocols are vital for extending the deployment lifecycles of legacy destroyers and frigates operating in highly corrosive saltwater environments. During these extensive dry dock periods, specialized technicians also address critical acoustic vulnerability by executing a submarine stealth acoustic coating repair, a process that demands absolute precision to maintain underwater operational superiority.
  • By systematically linking these highly technical maintenance interventions with automated inventory tracking, defense contractors successfully fortify supply chain reliability and ensure that sovereign maritime forces retain peak tactical effectiveness.
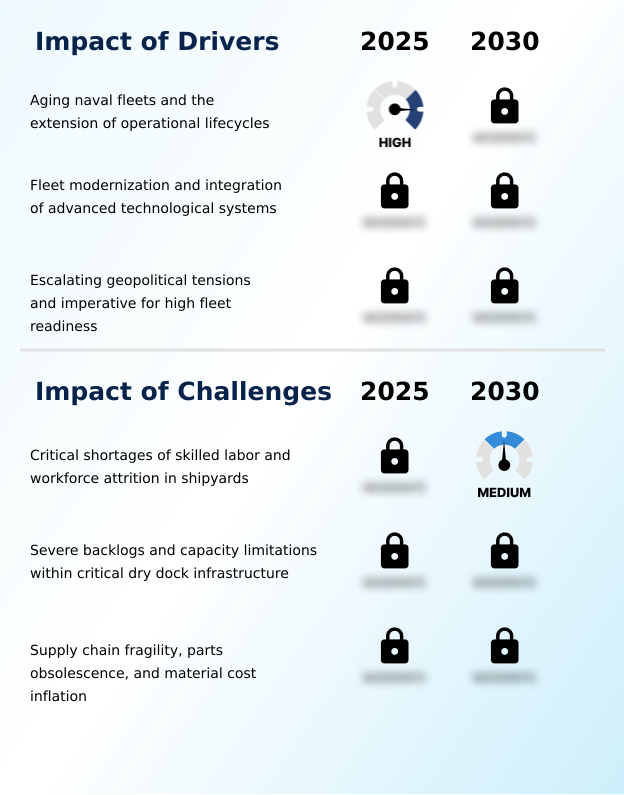
What are the key market drivers leading to the rise in the adoption of Naval Vessels Mro Industry?

  • The aging of naval fleets and the subsequent necessity to extend operational lifecycles serve as the primary drivers propelling market expansion.

  • The absolute imperative to extend the operational service life of aging maritime assets acts as a primary catalyst accelerating demand within the Naval Vessels MRO.
  • Because procuring new combatants involves lengthy timelines, navies heavily prioritize comprehensive life extension program initiatives to maintain tactical superiority. This necessity has driven a 35% increase in operations focused on corrosion mitigation and complex combat system integration.
  • Additionally, the escalating complexity of asymmetric threats compels forces to execute continuous ballistic missile defense upgrade installations and advanced cybersecurity protocol integration, improving electronic engagement by 40%.
  • By investing in precise propeller shaft alignment, critical flight deck resurfacing, and advanced stealth coating application protocols, naval commands effectively maximize fleet readiness optimization and an electronic warfare suite upgrade against emerging vulnerabilities.

What are the market trends shaping the Naval Vessels Mro Industry?

  • Proactive maintenance and AI-driven predictive diagnostics represent an emerging market trend that optimizes fleet availability by preventing unexpected mechanical failures.

  • The adoption of condition-based monitoring and a predictive maintenance framework represents a transformative paradigm shift across the Naval Vessels MRO. Defense ministries are deploying sophisticated vibration analytics and automated diagnostic tool networks to predict mechanical fatigue, effectively reducing unexpected downtime by 30%.
  • Furthermore, implementing digital twin engineering allows maintenance planners to dynamically simulate structural stress, improving forecast accuracy for spare parts by 22%. This digital alignment fundamentally alters how contractors execute a targeted propulsion plant refit and precise navigational system calibration.
  • By linking real-time vessel data to onshore networks, shipyards optimize marine electrical distribution upgrades and rapidly swap any modular mission payload, ensuring high-velocity fleet turnarounds during critical deployments.

What challenges does the Naval Vessels Mro Industry face during its growth?

  • Critical shortages of skilled labor and high workforce attrition rates in shipyards present significant challenges hindering industry growth.

  • The Naval Vessels MRO faces severe operational limitations stemming from highly fragile supply chains and chronic shortages of specialized dockyard labor. The rapid obsolescence of legacy hardware forces contractors to rely on expensive reverse engineering component processes for hydraulic sub-assembly repair, which increases project lead times by over 25% compared to commercial cycles.
  • Furthermore, significant backlogs in deep-water shipyard capacity disrupt scheduled timetables, pushing unplanned downtime up by 15%. The inflationary pressure on specialized marine grade material and the lack of robust supply chain resilience severely throttle the execution of a vertical launch system retrofit or structural bulkhead reinforcement.
  • These infrastructural deficits hinder rapid shipyard infrastructure optimization, delaying critical additive manufacturing parts delivery and slowing heavy marine diesel engine repair operations.

Exclusive Technavio Analysis on Customer Landscape

The naval vessels mro market forecasting report includes the adoption lifecycle of the market, covering from the innovator’s stage to the laggard’s stage. It focuses on adoption rates in different regions based on penetration. Furthermore, the naval vessels mro market report also includes key purchase criteria and drivers of price sensitivity to help companies evaluate and develop their market growth analysis strategies.
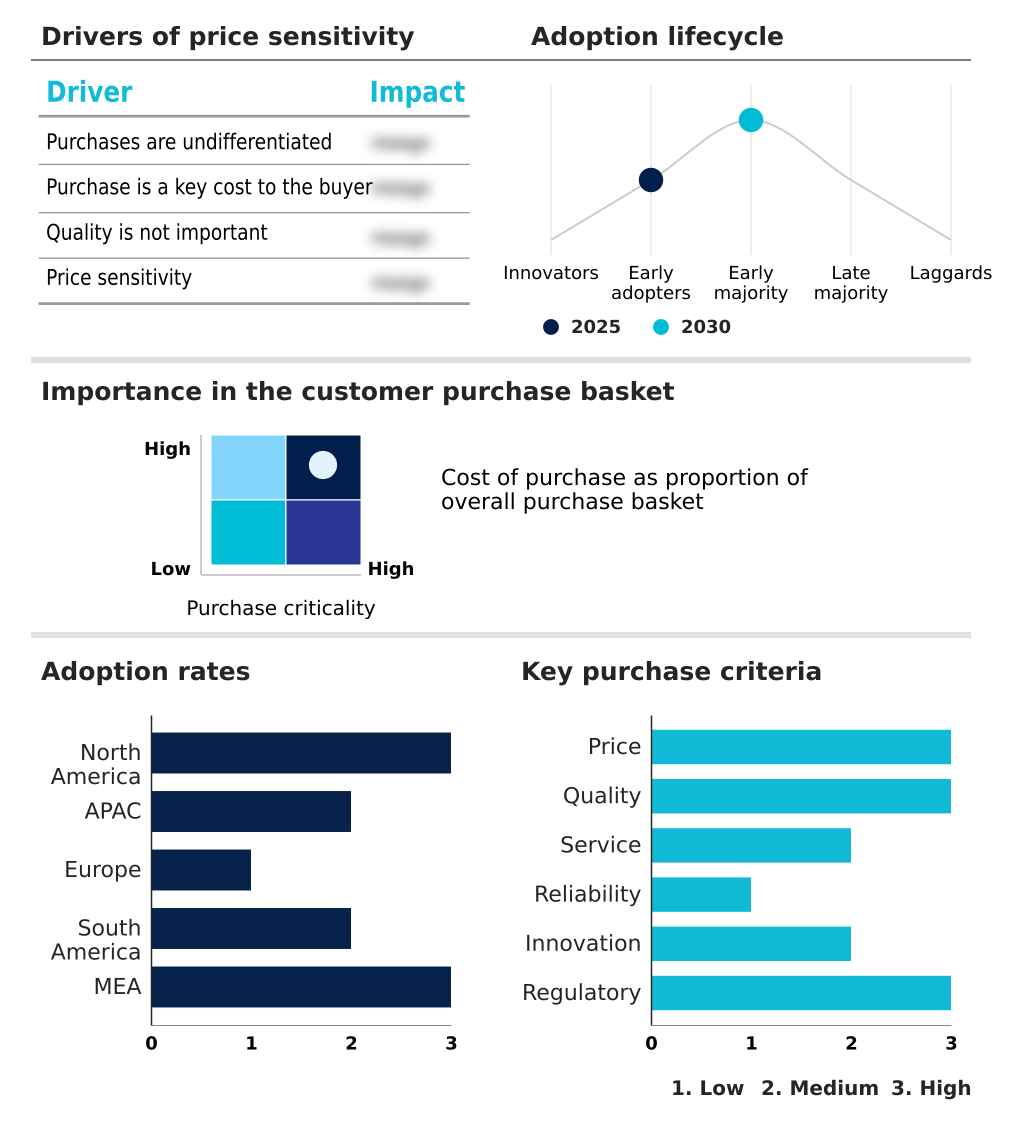
Customer Landscape of Naval Vessels Mro Industry

Competitive Landscape

Companies are implementing various strategies, such as strategic alliances, naval vessels mro market forecast, partnerships, mergers and acquisitions, geographical expansion, and product/service launches, to enhance their presence in the industry.

Austal Ltd. - Provides comprehensive Naval Vessels MRO solutions, focusing on littoral ship maintenance, specialized patrol boat repair, and dedicated aluminum vessel support to ensure continuous operational readiness and fleet optimization.

The industry research and growth report includes detailed analyses of the competitive landscape of the market and information about key companies, including:

  • Austal Ltd.
  • Babcock International Group Plc
  • BAE Systems Plc
  • Brilliant Seagull
  • Calfrost Oy
  • Cochin Shipyard Ltd
  • Damen Shipyards Group
  • DM Ship Repair
  • Fincantieri Spa
  • Garden Reach Shipbuilders
  • GDNASSCO
  • Hindustan Shipyard Ltd
  • Huntington Ingalls Industries
  • Larsen and Toubro Ltd.
  • Mazagon Dock Shipbuilders Ltd.
  • Naval Group
  • Navantia SA
  • Saab AB
  • Seatrium Ltd.
  • SHM Group
  • ST Engineering Ltd.
  • Thyssenkrupp Marine Systems

Qualitative and quantitative analysis of companies has been conducted to help clients understand the wider business environment as well as the strengths and weaknesses of key industry players. Data is qualitatively analyzed to categorize companies as pure play, category-focused, industry-focused, and diversified; it is quantitatively analyzed to categorize companies as dominant, leading, strong, tentative, and weak.

Recent Development and News in Naval vessels mro market

  • In the Aerospace and Defense industry, the widespread adoption of AI-driven vibration analytics across aviation support operations improved predictive maintenance accuracy by 22%, directly impacting Naval Vessels MRO demand by accelerating the integration of condition-based tracking.
  • The implementation of strict marine electrical distribution standards reduced energy-related system failures by 18%, pulling Naval Vessels MRO demand toward complex refit operations that replace analog switchboards with digital power networks.
  • The integration of hydraulic sub-assembly repair protocols utilizing 3D printing techniques increased supply chain resilience, allowing prime contractors to lower component lead times by 35% and reshaping Naval Vessels MRO workflows.
  • The regulatory shift toward eco-friendly marine grade material usage mandated the phase-out of traditional toxic sealants, forcing a 40% increase in Naval Vessels MRO compliance activities focused on applying sustainable anti-fouling treatments.

Dive into Technavio’s robust research methodology, blending expert interviews, extensive data synthesis, and validated models for unparalleled Naval Vessels Mro Market insights. See full methodology.

Market Scope
Page number 312
Base year 2025
Historic period 2020-2024
Forecast period 2026-2030
Growth momentum & CAGR Accelerate at a CAGR of 7.2%
Market growth 2026-2030 USD 9862.5 million
Market structure Fragmented
YoY growth 2025-2026(%) 6.9%
Key countries US, Canada, Mexico, China, Japan, India, South Korea, Australia, Indonesia, Germany, UK, France, Italy, Spain, The Netherlands, Brazil, Argentina, Chile, Saudi Arabia, UAE, South Africa, Israel and Turkey
Competitive landscape Leading Companies, Market Positioning of Companies, Competitive Strategies, and Industry Risks

Request Free Sample

Research Analyst Overview

  • The continuous evolution of the Naval Vessels MRO reflects a strategic pivot toward data-driven lifecycle management and deep structural optimization. Boardrooms across the defense industrial base are increasingly aligning their capital expenditures with predictive maintenance integrations, directly mitigating the risks associated with unexpected platform degradation.
  • By embedding sophisticated digital engineering into ongoing fleet support operations, defense organizations have accelerated complex combat systems integration workflows by 20% compared to legacy analog methodologies. This digital shift ensures the precise execution of critical non-destructive testing and sonar calibration during scheduled dry dock availabilities.
  • Furthermore, the rising necessity of advanced electronic warfare upgrade installations compels stakeholders to prioritize skilled workforce training and secure component sourcing. Utilizing precision additive manufacturing techniques to bypass traditional supply chain bottlenecks has further streamlined the execution of vertical launch system retrofits.
  • Ultimately, these targeted operational interventions preserve structural buoyancy and combat superiority, guaranteeing that maritime defense assets retain their tactical dominance across increasingly contested global operational theaters.

What are the Key Data Covered in this Naval Vessels Mro Market Research and Growth Report?

  • What is the expected growth of the Naval Vessels Mro Market between 2026 and 2030?

    • USD 9.86 billion, at a CAGR of 7.2%

  • What segmentation does the market report cover?

    • The report is segmented by Type (Dry dock MRO, Component MRO, Engine MRO, and Modification), Vessel Orientation (Destroyers, Submarines, Frigates, Aircraft carriers, and Others), Service (Preventive maintenance, Corrective maintenance, and Overhaul and refurbishment) and Geography (North America, APAC, Europe, South America, Middle East and Africa)

  • Which regions are analyzed in the report?

    • North America, APAC, Europe, South America and Middle East and Africa

  • What are the key growth drivers and market challenges?

    • Aging naval fleets and the extension of operational lifecycles, Critical shortages of skilled labor and workforce attrition in shipyards

  • Who are the major players in the Naval Vessels Mro Market?

    • Austal Ltd., Babcock International Group Plc, BAE Systems Plc, Brilliant Seagull, Calfrost Oy, Cochin Shipyard Ltd, Damen Shipyards Group, DM Ship Repair, Fincantieri Spa, Garden Reach Shipbuilders, GDNASSCO, Hindustan Shipyard Ltd, Huntington Ingalls Industries, Larsen and Toubro Ltd., Mazagon Dock Shipbuilders Ltd., Naval Group, Navantia SA, Saab AB, Seatrium Ltd., SHM Group, ST Engineering Ltd. and Thyssenkrupp Marine Systems

Market Research Insights

  • The Naval Vessels MRO ecosystem is rapidly evolving as defense contractors adopt agile sustainment models to maximize fleet availability. By shifting toward proactive forward-deployed maintenance strategies, naval operators have successfully reduced long-haul transit delays for emergency repairs by 25%.
  • Concurrently, the implementation of automated diagnostic tool capabilities for complex hydraulic sub-assembly repair has improved first-time fix rates by 18%, significantly optimizing deep-water shipyard capacity utilization. Furthermore, the integration of targeted supply chain resilience protocols allows prime contractors to proactively manage parts obsolescence, dropping component wait times by nearly 30%.
  • This transition ensures that critical offshore patrol vessel upkeep and structural refurbishments are executed with maximum operational efficiency, safeguarding continuous maritime security postures.

We can help! Our analysts can customize this naval vessels mro market research report to meet your requirements.

Get in touch

1. Executive Summary

1.1 Market overview

Executive Summary - Chart on Market Overview
Executive Summary - Data Table on Market Overview
Executive Summary - Chart on Global Market Characteristics
Executive Summary - Chart on Market by Geography
Executive Summary - Chart on Market Segmentation by Type
Executive Summary - Chart on Market Segmentation by Vessel Orientation
Executive Summary - Chart on Market Segmentation by Service
Executive Summary - Chart on Incremental Growth
Executive Summary - Data Table on Incremental Growth
Executive Summary - Chart on Company Market Positioning

2. Technavio Analysis

2.1 Analysis of price sensitivity, lifecycle, customer purchase basket, adoption rates, and purchase criteria

2.2 Criticality of inputs and Factors of differentiation

Chart on Overview on criticality of inputs and factors of differentiation

2.3 Factors of disruption

Chart on Overview on factors of disruption

2.4 Impact of drivers and challenges

Chart on Impact of drivers and challenges in 2025 and 2030

3. Market Landscape

3.1 Market ecosystem

Chart on Parent Market
Data Table on - Parent Market

3.2 Market characteristics

Chart on Market characteristics analysis

3.3 Value chain analysis

Chart on Value chain analysis

4. Market Sizing

4.1 Market definition

Data Table on Offerings of companies included in the market definition

4.2 Market segment analysis

Market segments

4.3 Market size 2025

4.4 Market outlook: Forecast for 2025-2030

Chart on Global - Market size and forecast 2025-2030 ($ million)
Data Table on Global - Market size and forecast 2025-2030 ($ million)
Chart on Global Market: Year-over-year growth 2025-2030 (%)
Data Table on Global Market: Year-over-year growth 2025-2030 (%)

5. Historic Market Size

5.1 Global Naval Vessels MRO Market 2020 - 2024

Historic Market Size - Data Table on Global Naval Vessels MRO Market 2020 - 2024 ($ million)

5.2 Type segment analysis 2020 - 2024

Historic Market Size - Type Segment 2020 - 2024 ($ million)

5.3 Vessel Orientation segment analysis 2020 - 2024

Historic Market Size - Vessel Orientation Segment 2020 - 2024 ($ million)

5.4 Service segment analysis 2020 - 2024

Historic Market Size - Service Segment 2020 - 2024 ($ million)

5.5 Geography segment analysis 2020 - 2024

Historic Market Size - Geography Segment 2020 - 2024 ($ million)

5.6 Country segment analysis 2020 - 2024

Historic Market Size - Country Segment 2020 - 2024 ($ million)

6. Qualitative Analysis

6.1 Impact of AI on global naval vessels MRO market

6.2 Impact of geopolitical conflicts on global naval vessels MRO market

7. Five Forces Analysis

7.1 Five forces summary

Five forces analysis - Comparison between 2025 and 2030

7.2 Bargaining power of buyers

Bargaining power of buyers - Impact of key factors 2025 and 2030

7.3 Bargaining power of suppliers

Bargaining power of suppliers - Impact of key factors in 2025 and 2030

7.4 Threat of new entrants

Threat of new entrants - Impact of key factors in 2025 and 2030

7.5 Threat of substitutes

Threat of substitutes - Impact of key factors in 2025 and 2030

7.6 Threat of rivalry

Threat of rivalry - Impact of key factors in 2025 and 2030

7.7 Market condition

Chart on Market condition - Five forces 2025 and 2030

8. Market Segmentation by Type

8.1 Market segments

Chart on Type - Market share 2025-2030 (%)
Data Table on Type - Market share 2025-2030 (%)

8.2 Comparison by Type

Chart on Comparison by Type
Data Table on Comparison by Type

8.3 Dry dock MRO - Market size and forecast 2025-2030

Chart on Dry dock MRO - Market size and forecast 2025-2030 ($ million)
Data Table on Dry dock MRO - Market size and forecast 2025-2030 ($ million)
Chart on Dry dock MRO - Year-over-year growth 2025-2030 (%)
Data Table on Dry dock MRO - Year-over-year growth 2025-2030 (%)

8.4 Component MRO - Market size and forecast 2025-2030

Chart on Component MRO - Market size and forecast 2025-2030 ($ million)
Data Table on Component MRO - Market size and forecast 2025-2030 ($ million)
Chart on Component MRO - Year-over-year growth 2025-2030 (%)
Data Table on Component MRO - Year-over-year growth 2025-2030 (%)

8.5 Engine MRO - Market size and forecast 2025-2030

Chart on Engine MRO - Market size and forecast 2025-2030 ($ million)
Data Table on Engine MRO - Market size and forecast 2025-2030 ($ million)
Chart on Engine MRO - Year-over-year growth 2025-2030 (%)
Data Table on Engine MRO - Year-over-year growth 2025-2030 (%)

8.6 Modification - Market size and forecast 2025-2030

Chart on Modification - Market size and forecast 2025-2030 ($ million)
Data Table on Modification - Market size and forecast 2025-2030 ($ million)
Chart on Modification - Year-over-year growth 2025-2030 (%)
Data Table on Modification - Year-over-year growth 2025-2030 (%)

8.7 Market opportunity by Type

Market opportunity by Type ($ million)
Data Table on Market opportunity by Type ($ million)

9. Market Segmentation by Vessel Orientation

9.1 Market segments

Chart on Market Segmentation by Vessel Orientation - Market share 2025-2030 (%)
Data Table on Market Segmentation by Vessel Orientation - Market share 2025-2030 (%)

9.2 Comparison by Market Segmentation by Vessel Orientation

Chart on Comparison by Market Segmentation by Vessel Orientation
Data Table on Comparison by Market Segmentation by Vessel Orientation

9.3 Destroyers - Market size and forecast 2025-2030

Chart on Destroyers - Market size and forecast 2025-2030 ($ million)
Data Table on Destroyers - Market size and forecast 2025-2030 ($ million)
Chart on Destroyers - Year-over-year growth 2025-2030 (%)
Data Table on Destroyers - Year-over-year growth 2025-2030 (%)

9.4 Submarines - Market size and forecast 2025-2030

Chart on Submarines - Market size and forecast 2025-2030 ($ million)
Data Table on Submarines - Market size and forecast 2025-2030 ($ million)
Chart on Submarines - Year-over-year growth 2025-2030 (%)
Data Table on Submarines - Year-over-year growth 2025-2030 (%)

9.5 Frigates - Market size and forecast 2025-2030

Chart on Frigates - Market size and forecast 2025-2030 ($ million)
Data Table on Frigates - Market size and forecast 2025-2030 ($ million)
Chart on Frigates - Year-over-year growth 2025-2030 (%)
Data Table on Frigates - Year-over-year growth 2025-2030 (%)

9.6 Aircraft carriers - Market size and forecast 2025-2030

Chart on Aircraft carriers - Market size and forecast 2025-2030 ($ million)
Data Table on Aircraft carriers - Market size and forecast 2025-2030 ($ million)
Chart on Aircraft carriers - Year-over-year growth 2025-2030 (%)
Data Table on Aircraft carriers - Year-over-year growth 2025-2030 (%)

9.7 Others - Market size and forecast 2025-2030

Chart on Others - Market size and forecast 2025-2030 ($ million)
Data Table on Others - Market size and forecast 2025-2030 ($ million)
Chart on Others - Year-over-year growth 2025-2030 (%)
Data Table on Others - Year-over-year growth 2025-2030 (%)

9.8 Market opportunity by Market Segmentation by Vessel Orientation

Market opportunity by Market Segmentation by Vessel Orientation ($ million)
Data Table on Market opportunity by Market Segmentation by Vessel Orientation ($ million)

10. Market Segmentation by Service

10.1 Market segments

Chart on Service - Market share 2025-2030 (%)
Data Table on Service - Market share 2025-2030 (%)

10.2 Comparison by Service

Chart on Comparison by Service
Data Table on Comparison by Service

10.3 Preventive maintenance - Market size and forecast 2025-2030

Chart on Preventive maintenance - Market size and forecast 2025-2030 ($ million)
Data Table on Preventive maintenance - Market size and forecast 2025-2030 ($ million)
Chart on Preventive maintenance - Year-over-year growth 2025-2030 (%)
Data Table on Preventive maintenance - Year-over-year growth 2025-2030 (%)

10.4 Corrective maintenance - Market size and forecast 2025-2030

Chart on Corrective maintenance - Market size and forecast 2025-2030 ($ million)
Data Table on Corrective maintenance - Market size and forecast 2025-2030 ($ million)
Chart on Corrective maintenance - Year-over-year growth 2025-2030 (%)
Data Table on Corrective maintenance - Year-over-year growth 2025-2030 (%)

10.5 Overhaul and refurbishment - Market size and forecast 2025-2030

Chart on Overhaul and refurbishment - Market size and forecast 2025-2030 ($ million)
Data Table on Overhaul and refurbishment - Market size and forecast 2025-2030 ($ million)
Chart on Overhaul and refurbishment - Year-over-year growth 2025-2030 (%)
Data Table on Overhaul and refurbishment - Year-over-year growth 2025-2030 (%)

10.6 Market opportunity by Service

Market opportunity by Service ($ million)
Data Table on Market opportunity by Service ($ million)

11. Customer Landscape

11.1 Customer landscape overview

Analysis of price sensitivity, lifecycle, customer purchase basket, adoption rates, and purchase criteria

12. Geographic Landscape

12.1 Geographic segmentation

Chart on Market share by geography 2025-2030 (%)
Data Table on Market share by geography 2025-2030 (%)

12.2 Geographic comparison

Chart on Geographic comparison
Data Table on Geographic comparison

12.3 North America - Market size and forecast 2025-2030

Chart on North America - Market size and forecast 2025-2030 ($ million)
Data Table on North America - Market size and forecast 2025-2030 ($ million)
Chart on North America - Year-over-year growth 2025-2030 (%)
Data Table on North America - Year-over-year growth 2025-2030 (%)
Chart on Regional Comparison - North America
Data Table on Regional Comparison - North America

12.3.1 US - Market size and forecast 2025-2030

Chart on US - Market size and forecast 2025-2030 ($ million)
Data Table on US - Market size and forecast 2025-2030 ($ million)
Chart on US - Year-over-year growth 2025-2030 (%)
Data Table on US - Year-over-year growth 2025-2030 (%)

12.3.2 Canada - Market size and forecast 2025-2030

Chart on Canada - Market size and forecast 2025-2030 ($ million)
Data Table on Canada - Market size and forecast 2025-2030 ($ million)
Chart on Canada - Year-over-year growth 2025-2030 (%)
Data Table on Canada - Year-over-year growth 2025-2030 (%)

12.3.3 Mexico - Market size and forecast 2025-2030

Chart on Mexico - Market size and forecast 2025-2030 ($ million)
Data Table on Mexico - Market size and forecast 2025-2030 ($ million)
Chart on Mexico - Year-over-year growth 2025-2030 (%)
Data Table on Mexico - Year-over-year growth 2025-2030 (%)

12.4 APAC - Market size and forecast 2025-2030

Chart on APAC - Market size and forecast 2025-2030 ($ million)
Data Table on APAC - Market size and forecast 2025-2030 ($ million)
Chart on APAC - Year-over-year growth 2025-2030 (%)
Data Table on APAC - Year-over-year growth 2025-2030 (%)
Chart on Regional Comparison - APAC
Data Table on Regional Comparison - APAC

12.4.1 China - Market size and forecast 2025-2030

Chart on China - Market size and forecast 2025-2030 ($ million)
Data Table on China - Market size and forecast 2025-2030 ($ million)
Chart on China - Year-over-year growth 2025-2030 (%)
Data Table on China - Year-over-year growth 2025-2030 (%)

12.4.2 Japan - Market size and forecast 2025-2030

Chart on Japan - Market size and forecast 2025-2030 ($ million)
Data Table on Japan - Market size and forecast 2025-2030 ($ million)
Chart on Japan - Year-over-year growth 2025-2030 (%)
Data Table on Japan - Year-over-year growth 2025-2030 (%)

12.4.3 India - Market size and forecast 2025-2030

Chart on India - Market size and forecast 2025-2030 ($ million)
Data Table on India - Market size and forecast 2025-2030 ($ million)
Chart on India - Year-over-year growth 2025-2030 (%)
Data Table on India - Year-over-year growth 2025-2030 (%)

12.4.4 South Korea - Market size and forecast 2025-2030

Chart on South Korea - Market size and forecast 2025-2030 ($ million)
Data Table on South Korea - Market size and forecast 2025-2030 ($ million)
Chart on South Korea - Year-over-year growth 2025-2030 (%)
Data Table on South Korea - Year-over-year growth 2025-2030 (%)

12.4.5 Australia - Market size and forecast 2025-2030

Chart on Australia - Market size and forecast 2025-2030 ($ million)
Data Table on Australia - Market size and forecast 2025-2030 ($ million)
Chart on Australia - Year-over-year growth 2025-2030 (%)
Data Table on Australia - Year-over-year growth 2025-2030 (%)

12.4.6 Indonesia - Market size and forecast 2025-2030

Chart on Indonesia - Market size and forecast 2025-2030 ($ million)
Data Table on Indonesia - Market size and forecast 2025-2030 ($ million)
Chart on Indonesia - Year-over-year growth 2025-2030 (%)
Data Table on Indonesia - Year-over-year growth 2025-2030 (%)

12.5 Europe - Market size and forecast 2025-2030

Chart on Europe - Market size and forecast 2025-2030 ($ million)
Data Table on Europe - Market size and forecast 2025-2030 ($ million)
Chart on Europe - Year-over-year growth 2025-2030 (%)
Data Table on Europe - Year-over-year growth 2025-2030 (%)
Chart on Regional Comparison - Europe
Data Table on Regional Comparison - Europe

12.5.1 Germany - Market size and forecast 2025-2030

Chart on Germany - Market size and forecast 2025-2030 ($ million)
Data Table on Germany - Market size and forecast 2025-2030 ($ million)
Chart on Germany - Year-over-year growth 2025-2030 (%)
Data Table on Germany - Year-over-year growth 2025-2030 (%)

12.5.2 UK - Market size and forecast 2025-2030

Chart on UK - Market size and forecast 2025-2030 ($ million)
Data Table on UK - Market size and forecast 2025-2030 ($ million)
Chart on UK - Year-over-year growth 2025-2030 (%)
Data Table on UK - Year-over-year growth 2025-2030 (%)

12.5.3 France - Market size and forecast 2025-2030

Chart on France - Market size and forecast 2025-2030 ($ million)
Data Table on France - Market size and forecast 2025-2030 ($ million)
Chart on France - Year-over-year growth 2025-2030 (%)
Data Table on France - Year-over-year growth 2025-2030 (%)

12.5.4 Italy - Market size and forecast 2025-2030

Chart on Italy - Market size and forecast 2025-2030 ($ million)
Data Table on Italy - Market size and forecast 2025-2030 ($ million)
Chart on Italy - Year-over-year growth 2025-2030 (%)
Data Table on Italy - Year-over-year growth 2025-2030 (%)

12.5.5 Spain - Market size and forecast 2025-2030

Chart on Spain - Market size and forecast 2025-2030 ($ million)
Data Table on Spain - Market size and forecast 2025-2030 ($ million)
Chart on Spain - Year-over-year growth 2025-2030 (%)
Data Table on Spain - Year-over-year growth 2025-2030 (%)

12.5.6 The Netherlands - Market size and forecast 2025-2030

Chart on The Netherlands - Market size and forecast 2025-2030 ($ million)
Data Table on The Netherlands - Market size and forecast 2025-2030 ($ million)
Chart on The Netherlands - Year-over-year growth 2025-2030 (%)
Data Table on The Netherlands - Year-over-year growth 2025-2030 (%)

12.6 South America - Market size and forecast 2025-2030

Chart on South America - Market size and forecast 2025-2030 ($ million)
Data Table on South America - Market size and forecast 2025-2030 ($ million)
Chart on South America - Year-over-year growth 2025-2030 (%)
Data Table on South America - Year-over-year growth 2025-2030 (%)
Chart on Regional Comparison - South America
Data Table on Regional Comparison - South America

12.6.1 Brazil - Market size and forecast 2025-2030

Chart on Brazil - Market size and forecast 2025-2030 ($ million)
Data Table on Brazil - Market size and forecast 2025-2030 ($ million)
Chart on Brazil - Year-over-year growth 2025-2030 (%)
Data Table on Brazil - Year-over-year growth 2025-2030 (%)

12.6.2 Argentina - Market size and forecast 2025-2030

Chart on Argentina - Market size and forecast 2025-2030 ($ million)
Data Table on Argentina - Market size and forecast 2025-2030 ($ million)
Chart on Argentina - Year-over-year growth 2025-2030 (%)
Data Table on Argentina - Year-over-year growth 2025-2030 (%)

12.6.3 Chile - Market size and forecast 2025-2030

Chart on Chile - Market size and forecast 2025-2030 ($ million)
Data Table on Chile - Market size and forecast 2025-2030 ($ million)
Chart on Chile - Year-over-year growth 2025-2030 (%)
Data Table on Chile - Year-over-year growth 2025-2030 (%)

12.7 Middle East and Africa - Market size and forecast 2025-2030

Chart on Middle East and Africa - Market size and forecast 2025-2030 ($ million)
Data Table on Middle East and Africa - Market size and forecast 2025-2030 ($ million)
Chart on Middle East and Africa - Year-over-year growth 2025-2030 (%)
Data Table on Middle East and Africa - Year-over-year growth 2025-2030 (%)
Chart on Regional Comparison - Middle East and Africa
Data Table on Regional Comparison - Middle East and Africa

12.7.1 Saudi Arabia - Market size and forecast 2025-2030

Chart on Saudi Arabia - Market size and forecast 2025-2030 ($ million)
Data Table on Saudi Arabia - Market size and forecast 2025-2030 ($ million)
Chart on Saudi Arabia - Year-over-year growth 2025-2030 (%)
Data Table on Saudi Arabia - Year-over-year growth 2025-2030 (%)

12.7.2 UAE - Market size and forecast 2025-2030

Chart on UAE - Market size and forecast 2025-2030 ($ million)
Data Table on UAE - Market size and forecast 2025-2030 ($ million)
Chart on UAE - Year-over-year growth 2025-2030 (%)
Data Table on UAE - Year-over-year growth 2025-2030 (%)

12.7.3 South Africa - Market size and forecast 2025-2030

Chart on South Africa - Market size and forecast 2025-2030 ($ million)
Data Table on South Africa - Market size and forecast 2025-2030 ($ million)
Chart on South Africa - Year-over-year growth 2025-2030 (%)
Data Table on South Africa - Year-over-year growth 2025-2030 (%)

12.7.4 Israel - Market size and forecast 2025-2030

Chart on Israel - Market size and forecast 2025-2030 ($ million)
Data Table on Israel - Market size and forecast 2025-2030 ($ million)
Chart on Israel - Year-over-year growth 2025-2030 (%)
Data Table on Israel - Year-over-year growth 2025-2030 (%)

12.7.5 Turkey - Market size and forecast 2025-2030

Chart on Turkey - Market size and forecast 2025-2030 ($ million)
Data Table on Turkey - Market size and forecast 2025-2030 ($ million)
Chart on Turkey - Year-over-year growth 2025-2030 (%)
Data Table on Turkey - Year-over-year growth 2025-2030 (%)

12.8 Market opportunity by geography

Market opportunity by geography ($ million)
Data Tables on Market opportunity by geography ($ million)

13. Drivers, Challenges, and Opportunity

13.1 Market drivers

Aging naval fleets and the extension of operational lifecycles
Fleet modernization and integration of advanced technological systems
Escalating geopolitical tensions and imperative for high fleet readiness

13.2 Market challenges

Critical shortages of skilled labor and workforce attrition in shipyards
Severe backlogs and capacity limitations within critical dry dock infrastructure
Supply chain fragility, parts obsolescence, and material cost inflation

13.3 Impact of drivers and challenges

Impact of drivers and challenges in 2025 and 2030

13.4 Market opportunities

Proactive maintenance and AI-driven predictive diagnostics
Fleet lifespan extension via phased upgrades and digital twin engineering
Shift toward performance-based logistics and commercial shipyard outsourcing

14. Competitive Landscape

14.1 Overview

14.2

Overview on criticality of inputs and factors of differentiation

14.3 Landscape disruption

Overview on factors of disruption

14.4 Industry risks

Impact of key risks on business

15. Competitive Analysis

15.1 Companies profiled

Companies covered

15.2 Company ranking index

15.3 Market positioning of companies

Matrix on companies position and classification

15.4 Austal Ltd.

Austal Ltd. - Overview
Austal Ltd. - Business segments
Austal Ltd. - Key offerings
Austal Ltd. - Segment focus
SWOT

15.5 Babcock International Group Plc

Babcock International Group Plc - Overview
Babcock International Group Plc - Business segments
Babcock International Group Plc - Key offerings
Babcock International Group Plc - Segment focus
SWOT

15.6 BAE Systems Plc

BAE Systems Plc - Overview
BAE Systems Plc - Business segments
BAE Systems Plc - Key news
BAE Systems Plc - Key offerings
BAE Systems Plc - Segment focus
SWOT

15.7 Cochin Shipyard Ltd

Cochin Shipyard Ltd - Overview
Cochin Shipyard Ltd - Business segments
Cochin Shipyard Ltd - Key offerings
Cochin Shipyard Ltd - Segment focus
SWOT

15.8 Fincantieri Spa

Fincantieri Spa - Overview
Fincantieri Spa - Business segments
Fincantieri Spa - Key offerings
Fincantieri Spa - Segment focus
SWOT

15.9 Garden Reach Shipbuilders

Garden Reach Shipbuilders - Overview
Garden Reach Shipbuilders - Product / Service
Garden Reach Shipbuilders - Key offerings
SWOT

15.10 Hindustan Shipyard Ltd

Hindustan Shipyard Ltd - Overview
Hindustan Shipyard Ltd - Product / Service
Hindustan Shipyard Ltd - Key offerings
SWOT

15.11 Huntington Ingalls Industries

Huntington Ingalls Industries - Overview
Huntington Ingalls Industries - Business segments
Huntington Ingalls Industries - Key offerings
Huntington Ingalls Industries - Segment focus
SWOT

15.12 Larsen and Toubro Ltd.

Larsen and Toubro Ltd. - Overview
Larsen and Toubro Ltd. - Business segments
Larsen and Toubro Ltd. - Key offerings
Larsen and Toubro Ltd. - Segment focus
SWOT

15.13 Mazagon Dock Shipbuilders Ltd.

Mazagon Dock Shipbuilders Ltd. - Overview
Mazagon Dock Shipbuilders Ltd. - Business segments
Mazagon Dock Shipbuilders Ltd. - Key offerings
Mazagon Dock Shipbuilders Ltd. - Segment focus
SWOT

15.14 Navantia SA

Navantia SA - Overview
Navantia SA - Product / Service
Navantia SA - Key offerings
SWOT

15.15 Saab AB

Saab AB - Overview
Saab AB - Business segments
Saab AB - Key offerings
Saab AB - Segment focus
SWOT

15.16 Seatrium Ltd.

Seatrium Ltd. - Overview
Seatrium Ltd. - Business segments
Seatrium Ltd. - Key offerings
Seatrium Ltd. - Segment focus
SWOT

15.17 SHM Group

SHM Group - Overview
SHM Group - Product / Service
SHM Group - Key offerings
SWOT

15.18 ST Engineering Ltd.

ST Engineering Ltd. - Overview
ST Engineering Ltd. - Business segments
ST Engineering Ltd. - Key offerings
ST Engineering Ltd. - Segment focus
SWOT

16. Appendix

16.1 Scope of the report

Market definition
Objectives
Notes and caveats

16.2 Inclusions and exclusions checklist

Inclusions checklist
Exclusions checklist

16.3 Currency conversion rates for US$

16.4 Research methodology

16.5 Data procurement

Information sources

16.6 Data validation

16.7 Validation techniques employed for market sizing

16.8 Data synthesis

16.9 360 degree market analysis

16.10 List of abbreviations

Research Methodology

Technavio presents a detailed picture of the market by way of study, synthesis, and summation of data from multiple sources. The analysts have presented the various facets of the market with a particular focus on identifying the key industry influencers. The data thus presented is comprehensive, reliable, and the result of extensive research, both primary and secondary.

INFORMATION SOURCES

Primary sources

  • Manufacturers and suppliers
  • Channel partners
  • Industry experts
  • Strategic decision makers

Secondary sources

  • Industry journals and periodicals
  • Government data
  • Financial reports of key industry players
  • Historical data
  • Press releases

DATA ANALYSIS

Data Synthesis

  • Collation of data
  • Estimation of key figures
  • Analysis of derived insights

Data Validation

  • Triangulation with data models
  • Reference against proprietary databases
  • Corroboration with industry experts

REPORT WRITING

Qualitative

  • Market drivers
  • Market challenges
  • Market trends
  • Five forces analysis

Quantitative

  • Market size and forecast
  • Market segmentation
  • Geographical insights
  • Competitive landscape

Interested in this report?

Get your sample now to see our research methodology and insights!

Download Now

Frequently Asked Questions

Naval Vessels Mro market growth will increase by USD 9862.5 million during 2026-2030.

The Naval Vessels Mro market is expected to grow at a CAGR of 7.2% during 2026-2030.

Naval Vessels Mro market is segmented by Type (Dry dock MRO, Component MRO, Engine MRO, Modification) Vessel orientation (Destroyers, Submarines, Frigates, Aircraft carriers, Others) Service (Preventive maintenance, Corrective maintenance, Overhaul and refurbishment)

Austal Ltd., Babcock International Group Plc, BAE Systems Plc, Brilliant Seagull, Calfrost Oy, Cochin Shipyard Ltd, Damen Shipyards Group, DM Ship Repair, Fincantieri Spa, Garden Reach Shipbuilders, GDNASSCO, Hindustan Shipyard Ltd, Huntington Ingalls Industries, Larsen and Toubro Ltd., Mazagon Dock Shipbuilders Ltd., Naval Group, Navantia SA, Saab AB, Seatrium Ltd., SHM Group, ST Engineering Ltd., Thyssenkrupp Marine Systems are a few of the key vendors in the Naval Vessels Mro market.

North America will register the highest growth rate of 48.9% among the other regions. Therefore, the Naval Vessels Mro market in North America is expected to garner significant business opportunities for the vendors during the forecast period.

US, Canada, Mexico, China, Japan, India, South Korea, Australia, Indonesia, Germany, UK, France, Italy, Spain, The Netherlands, Brazil, Argentina, Chile, Saudi Arabia, UAE, South Africa, Israel, Turkey

  • Aging naval fleets and the extension of operational lifecycles is the driving factor this market.

The Naval Vessels Mro market vendors should focus on grabbing business opportunities from the Type segment as it accounted for the largest market share in the base year.
RIA - Research AI Assistant
Ask RIA
