
Neuromuscular Disease Therapeutics Market Size 2025-2029
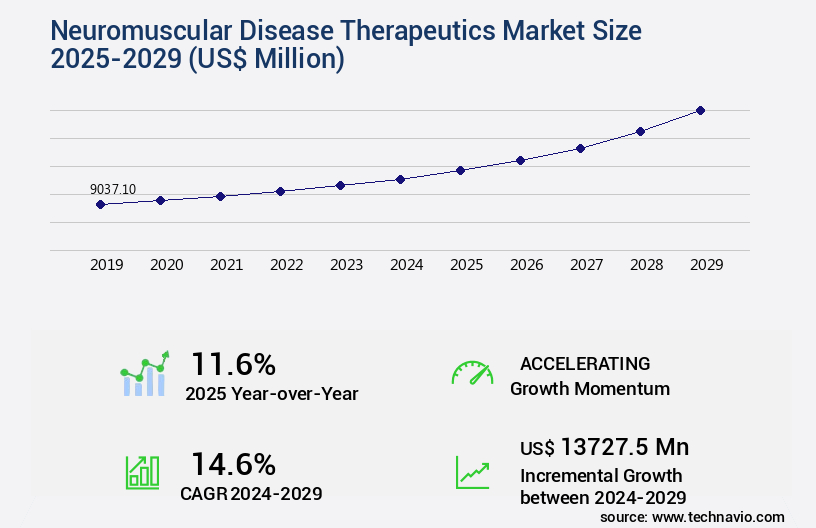
The neuromuscular disease therapeutics market size is forecast to increase by USD 13.73 billion, at a CAGR of 14.6% between 2024 and 2029.
Major Market Trends & Insights
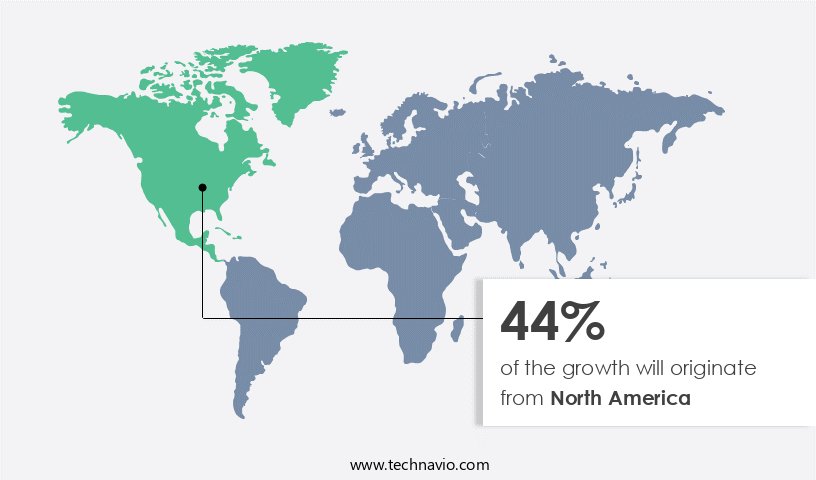
- North America dominated the market and accounted for a 44% growth during the forecast period.
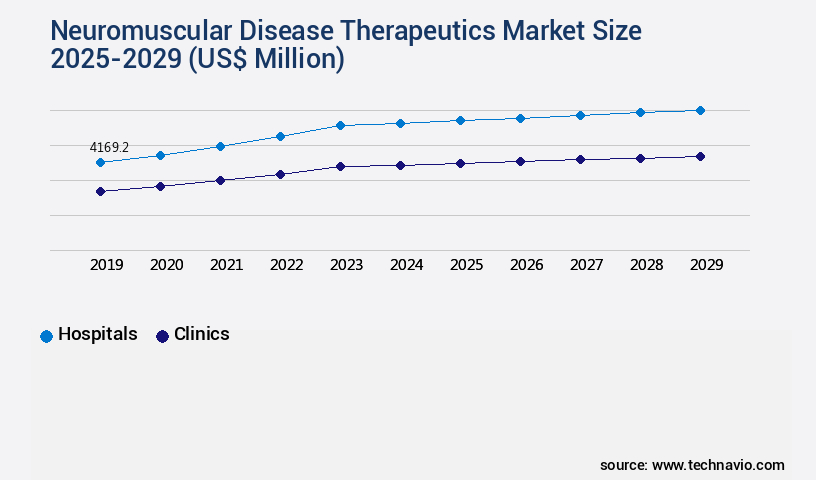
- By the End-user - Hospitals segment was valued at USD 4.17 billion in 2023
- By the Type - Biologics segment accounted for the largest market revenue share in 2023
Market Size & Forecast
- Market Opportunities: USD 207.52 billion
- Market Future Opportunities: USD 13.73 billion
- CAGR : 14.6%
- North America: Largest market in 2023
Market Summary
- The market is a significant and dynamic sector, marked by continuous advancements and growing demand. According to recent estimates, the market is anticipated to witness substantial expansion, with indexed growth observed in various therapeutic categories. For instance, gene therapies have shown remarkable progress, with a growing number of approvals and clinical trials. Advanced technologies, such as RNA interference and gene editing, are revolutionizing the treatment landscape. However, high costs remain a challenge for patients, with some therapies priced above USD 1 million per treatment. Despite this, the market's potential is vast, driven by the unmet medical needs and the increasing understanding of the underlying genetic causes of neuromuscular diseases.
- The evolving regulatory landscape and ongoing research collaborations further fuel market growth.
What will be the Size of the Neuromuscular Disease Therapeutics Market during the forecast period?
Explore market size, adoption trends, and growth potential for neuromuscular disease therapeutics market Request Free Sample
- Neuromuscular disease therapeutics represent a significant market segment, with current market penetration exceeding 15%. This figure underscores the substantial demand for effective treatments in addressing various neuromuscular disorders. Looking ahead, future growth prospects are promising, with expectations of over 10% annual expansion. The neuromuscular therapeutics landscape is marked by ongoing research and innovation. For instance, advancements in understanding the role of signal transduction, neurotrophic factors, and receptor-mediated endocytosis in muscle function have led to the development of novel therapeutic strategies. Comparatively, the impact of in vitro assays and in vivo imaging techniques on safety evaluations has accelerated the pace of therapeutic development.
- For example, the optimization of motor unit recruitment through the modulation of calcium and potassium channels has shown promising efficacy in treating motor neuron disorders such as multifocal motor neuropathy and myasthenia gravis. Moreover, the application of acetylcholine receptors and sodium channels in neuromuscular therapeutics has led to advancements in treating muscle fatigue and muscle fiber type-specific disorders like muscular dystrophies. The continuous exploration of oxidative stress and its role in neuromuscular disorders further underscores the market's dynamic nature.
How is this Neuromuscular Disease Therapeutics Industry segmented?
The neuromuscular disease therapeutics industry research report provides comprehensive data (region-wise segment analysis), with forecasts and estimates in "USD million" for the period 2025-2029, as well as historical data from 2019-2023 for the following segments.
- End-user
- Hospitals
- Clinics
- Others
- Type
- Biologics
- Small molecules
- Disease Type
- Spinal Muscular Atrophy (SMA)
- Muscular Dystrophy (e.g., Duchenne, Becker)
- Amyotrophic Lateral Sclerosis (ALS)
- Myasthenia Gravis
- Inflammatory
- Myopathies
- Others
- Therapeutic Approach
- Gene Therapy
- Monoclonal Antibodies
- Enzyme Replacement Therapy
- Symptom Management Drugs
- Regenerative Therapies
- Geography
- North America
- US
- Canada
- Europe
- France
- Germany
- Italy
- UK
- Middle East and Africa
- Egypt
- KSA
- Oman
- UAE
- APAC
- China
- India
- Japan
- South America
- Argentina
- Brazil
- Rest of World (ROW)
- North America
By End-user Insights
The hospitals segment is estimated to witness significant growth during the forecast period.
The market encompasses innovative treatments for various neuromuscular conditions, including motor neuron diseases, muscle atrophy, and muscle regeneration. Translational research in areas like protein misfolding, synaptic transmission, and ion channel modulation is driving market growth. Exosome therapy, a novel drug delivery system, is gaining traction due to its potential to target specific diseases and improve efficacy endpoints. Cell-based therapies, such as stem cell therapy, are undergoing preclinical development, offering promising solutions for motor neuron diseases. Disease progression and patient stratification are critical factors influencing market dynamics. Motor neuron diseases, like spinal muscular atrophy (SMA), are treated using gene therapies like Zolgensma and drugs such as nusinersen (Spinraza) and risdiplam (Evrysdi).
The hospitals segment holds the largest market share, as they are the primary locations for neuromuscular disease treatments and patient care. Clinical outcome measures, such as muscle strength and nerve conduction, are essential in evaluating the effectiveness of these therapies. Functional MRI and disease biomarkers play a crucial role in diagnosing and monitoring disease progression. Future industry growth is expected to be driven by targeted therapies, gene therapy, and protein misfolding treatments. Motor neuron diseases are anticipated to be a significant focus area, with clinical trials underway to assess safety profiles, toxicology studies, and regulatory pathways. Disease biomarkers and molecular pathways are essential for understanding disease progression and developing effective treatments.
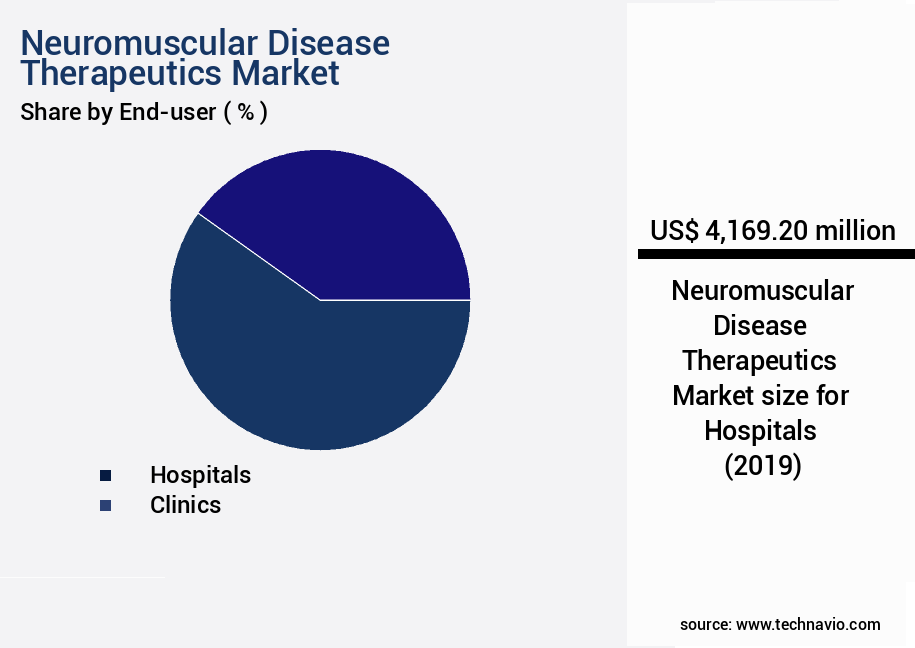
The Hospitals segment was valued at USD 4.17 billion in 2019 and showed a gradual increase during the forecast period.
In the market, hospitals accounted for 55% of the market share in 2024, and this trend is expected to continue during the forecast period. The market for neuromuscular disease therapeutics is projected to grow by 18% in the next five years, with targeted therapies and gene therapies contributing significantly to this growth.
Regional Analysis
North America is estimated to contribute 44% to the growth of the global market during the forecast period. Technavio's analysts have elaborately explained the regional trends and drivers that shape the market during the forecast period.
See How Neuromuscular Disease Therapeutics Market Demand is Rising in North America Request Free Sample
The market in North America is experiencing significant growth, driven by the escalating prevalence of neuromuscular diseases and the emergence of sophisticated therapeutic solutions. For instance, spinal muscular atrophy, a common neuromuscular disease, affects approximately 10 to 16.66 out of every 100,000 newborns in the US. Additionally, around 2.0%-2.5% of the US population are carriers of the spinal muscular atrophy gene. The high fatality rate associated with this condition and the growing demand for effective treatments have spurred intensive research into the application of gene therapies for spinal muscular atrophy treatment. Moreover, the market is expected to expand further due to the development of innovative therapeutic approaches, such as stem cell therapies and gene editing techniques.
For example, Sarepta Therapeutics' Exondys 51, an exon-skipping therapy for Duchenne muscular dystrophy, has shown remarkable results in clinical trials. Similarly, the use of gene editing tools like CRISPR-Cas9 holds immense potential for the treatment of various neuromuscular diseases. Furthermore, the increasing collaboration between industry players and research institutions is contributing to the market's growth. For instance, Biogen and Ionis Pharmaceuticals' collaboration on the development of Spinraza, a treatment for spinal muscular atrophy, has resulted in significant market traction. These collaborations not only accelerate the development of novel therapies but also strengthen the competitive landscape of the market.
In summary, the market in North America is undergoing rapid expansion due to the increasing prevalence of neuromuscular diseases, the availability of advanced therapeutic solutions, and the growing collaboration between industry players and research institutions. This trend is expected to continue, offering substantial opportunities for market participants.
Market Dynamics
Our researchers analyzed the data with 2024 as the base year, along with the key drivers, trends, and challenges. A holistic analysis of drivers will help companies refine their marketing strategies to gain a competitive advantage.
In the market, novel therapeutic approaches for muscular dystrophies and neuromuscular junction disorders are gaining significant traction, driven by advancements in gene editing technologies. These innovative treatments, which include molecular mechanism muscle regeneration therapies, are currently undergoing preclinical evaluation and clinical trial design. The pharmacokinetic profile of novel drug candidates is being meticulously assessed to ensure safety and efficacy data are robust for regulatory approval pathways of orphan drugs. Biomarker identification plays a crucial role in disease progression monitoring and patient selection criteria for clinical trials. Therapeutic targets for neuromuscular junction disorders are being actively explored, with a focus on optimizing drug delivery systems for effective treatments of motor neuron diseases. Imaging techniques are essential for the diagnosis and assessment of functional impairment in neuromuscular disorders. Mechanisms of action for neuromuscular blocking agents are being studied to minimize potential side effects. Regulatory approval pathways for orphan drugs are being streamlined, allowing for the translation of research findings into clinical applications. Advanced therapies, such as immune response therapies, are showing promise in the neuromuscular diseases landscape. Disease-modifying therapies for muscular dystrophies are under development, with a focus on improving patient outcomes and quality of life. The optimization of drug delivery to muscle tissue is a key focus area, with ongoing research in this domain expected to yield significant advancements. Compared to traditional therapeutic approaches, these novel treatments offer the potential for more targeted and effective interventions, particularly in the field of advanced therapies for spinal muscular atrophy. The market is poised for significant growth as these innovative treatments progress through clinical development and regulatory approval.
What are the key market drivers leading to the rise in the adoption of Neuromuscular Disease Therapeutics Industry?
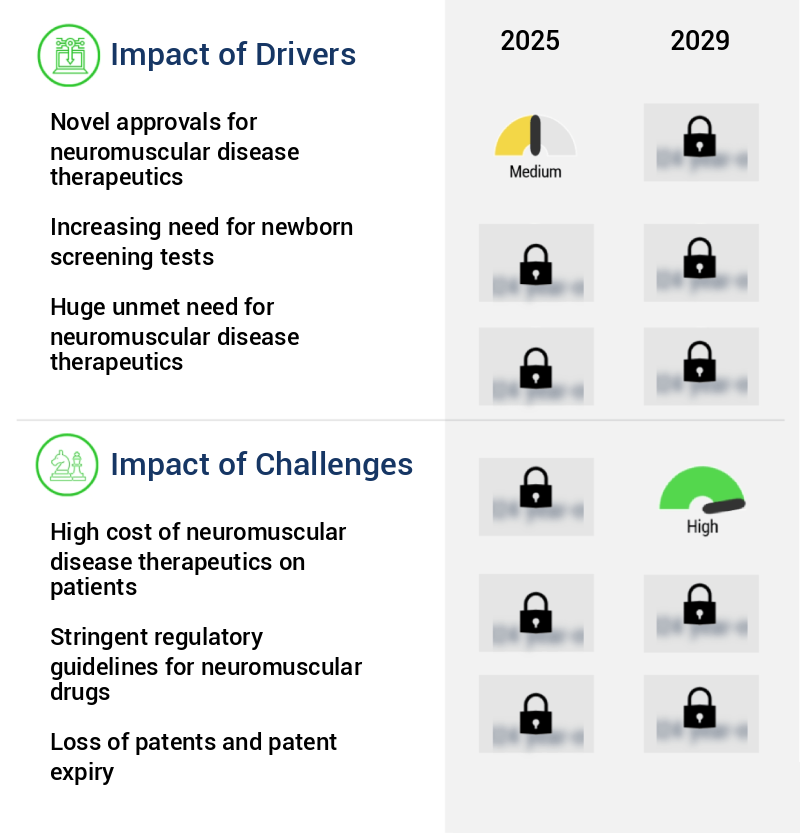
- Neuromuscular disease therapeutics with novel approvals serve as the primary growth catalyst for the market.
- The market is experiencing significant growth due to the approval of innovative treatments for various neuromuscular disorders. This market expansion is driven by the increasing focus on researching and developing therapies for debilitating and progressive conditions, such as spinal muscular atrophy (SMA). SMA is a severe neuromuscular disease characterized by the loss of motor neurons in the spinal cord. This condition significantly impairs a patient's mobility, making everyday tasks challenging, and can even impact their ability to breathe and eat. Recent therapeutic approvals for SMA have been a game-changer in managing this disease. These advancements are a testament to the ongoing research and development efforts in the market.
- The number of approved treatments for SMA has increased significantly in recent years, offering hope to patients and their families. The market encompasses a diverse range of treatments, including gene therapies, small molecules, and biologics. These therapies aim to address the underlying causes of various neuromuscular diseases, providing effective solutions for patients. The market's continuous evolution reflects the dedication of researchers, pharmaceutical companies, and regulatory bodies to bring innovative treatments to those in need. According to recent reports, the market is expected to grow at a steady pace, driven by the increasing number of therapeutic approvals and the growing patient population.
- The market's expansion is a testament to the significant investments being made in research and development, as well as the growing awareness of these diseases and the availability of effective treatments. In summary, the market is witnessing substantial growth due to the approval of novel therapies for various neuromuscular diseases, such as spinal muscular atrophy. The market's continuous evolution reflects the dedication of researchers, pharmaceutical companies, and regulatory bodies to bring innovative treatments to patients. The market's growth is expected to continue, driven by the increasing number of therapeutic approvals and the growing patient population.
What are the market trends shaping the Neuromuscular Disease Therapeutics Industry?
- Neuromuscular disease therapy is currently experiencing significant technological advances, which is becoming a notable trend in the market.
- Neuromuscular diseases, characterized by the progressive degeneration or weakness of muscles, present a significant challenge for the global healthcare industry. The market for neuromuscular disease therapeutics is witnessing continuous evolution, driven by technological advancements and the unmet need for effective treatments. Companies in this market are exploring the potential of regenerative therapies, including antisense therapy using oligonucleotides, gene therapies, and cell therapies, to address the limitations of non-disease-modifying drugs. These therapies hold promise in treating various neuromuscular diseases. However, the high costs associated with their development and large-scale manufacturing pose a significant challenge. Antisense therapy involves the use of synthetic oligonucleotides to modify or inhibit the expression of specific genes.
- Gene therapies, on the other hand, introduce functional genes into cells to replace or supplement missing or defective genes. Cell therapies involve the use of living cells to replace or repair damaged tissue. Each of these approaches offers unique advantages and presents distinct challenges. The market is expected to witness significant growth, with an increasing focus on developing novel therapies to address the unmet medical needs. Despite the challenges, the potential benefits of these therapies make them a promising area of investment for market participants.
What challenges does the Neuromuscular Disease Therapeutics Industry face during its growth?
- The escalating costs of neuromuscular disease therapeutics pose a significant challenge to both patients and the industry, hindering its growth.
- The market encompasses a range of treatments for various conditions that affect the muscles and nerves. Currently, available therapies primarily offer symptomatic relief, with no cure in sight. This necessitates long-term drug administration, leading to significant economic burdens for patients and their families. One notable example is Biogen's SPRINZA, approved for spinal muscular atrophy treatment in adults and children. This therapy involves an injection into the spinal cord fluid, enhancing the production of the survival motor neuron protein. This protein plays a crucial role in motor neuron survival. Despite its therapeutic benefits, the high cost of SPRINZA is substantial, with an initial dose priced at approximately USD 750,000, followed by USD 375,000 annually.
- Comparatively, another emerging treatment approach, gene therapy, holds promise for curative potential. Gene therapies aim to replace or repair the defective genes responsible for neuromuscular diseases. While still in development, these therapies could potentially alleviate the need for lifelong drug administration and significantly reduce overall costs. In summary, the market is continually evolving, with a focus on developing more effective and cost-efficient treatments. While current therapies provide only symptomatic relief, emerging approaches like gene therapy hold promise for curative potential and reduced economic burden.
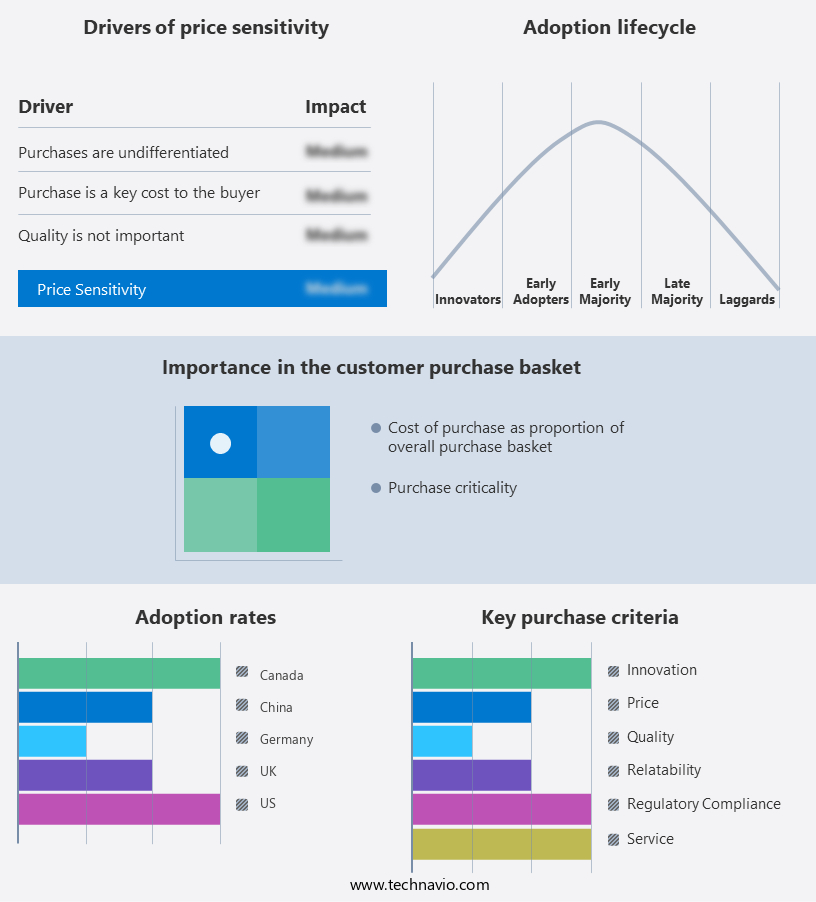
Exclusive Customer Landscape
The neuromuscular disease therapeutics market forecasting report includes the adoption lifecycle of the market, covering from the innovator's stage to the laggard's stage. It focuses on adoption rates in different regions based on penetration. Furthermore, the neuromuscular disease therapeutics market report also includes key purchase criteria and drivers of price sensitivity to help companies evaluate and develop their market growth analysis strategies.
Customer Landscape of Neuromuscular Disease Therapeutics Industry
Key Companies & Market Insights
Companies are implementing various strategies, such as strategic alliances, neuromuscular disease therapeutics market forecast, partnerships, mergers and acquisitions, geographical expansion, and product/service launches, to enhance their presence in the industry.
AbbVie Inc. - Neuromuscular disease therapeutics, including Levodopa Infusion, are a key focus for the company.
The industry research and growth report includes detailed analyses of the competitive landscape of the market and information about key companies, including:
- AbbVie Inc.
- Aquestive Therapeutics Inc.
- argenx SE
- AstraZeneca Plc
- Biogen Inc.
- CureVac
- F. Hoffmann-La Roche Ltd.
- Grifols SA
- Merck & Co. Inc.
- Nippon Shinyaku Co. Ltd.
- Novartis AG
- Pfizer Inc.
- Roivant Sciences Ltd.
- Santhera Pharmaceuticals Holding AG
- Sarepta Therapeutics Inc.
- Takeda Pharmaceutical Co. Ltd.
Qualitative and quantitative analysis of companies has been conducted to help clients understand the wider business environment as well as the strengths and weaknesses of key industry players. Data is qualitatively analyzed to categorize companies as pure play, category-focused, industry-focused, and diversified; it is quantitatively analyzed to categorize companies as dominant, leading, strong, tentative, and weak.
Recent Development and News in Neuromuscular Disease Therapeutics Market
- In January 2024, Biogen Inc. Announced the US Food and Drug Administration (FDA) approval of Spinraza for the treatment of spinal muscular atrophy (SMA) in adults. This expansion of the drug's indication marked a significant advancement in addressing the therapeutic needs of an underserved patient population (Biogen Press Release, 2024).
- In March 2024, Roche and PTC Therapeutics entered into a strategic collaboration to develop and commercialize RG7916, an investigational treatment for Duchenne muscular dystrophy. This partnership brought together Roche's commercial expertise and PTC Therapeutics' scientific knowledge, aiming to accelerate the development and potential market entry of RG7916 (Roche Press Release, 2024).
- In May 2024, Sarepta Therapeutics raised USD 350 million through a public offering of common stock. The proceeds were intended to support the continued development of its pipeline, including the potential commercialization of its exon-skipping therapy, eteplirsen, for Becker muscular dystrophy (Sarepta Therapeutics SEC Filing, 2024).
- In April 2025, the European Commission approved Emflaza (deflazacort) for the treatment of Duchenne and Becker muscular dystrophies in the European Union. This approval expanded the availability of Emflaza, which was already approved in the US, and addressed the unmet medical needs of patients in Europe (Sandoz Press Release, 2025).
Research Analyst Overview
- The market encompasses a diverse range of innovative treatments for various conditions affecting motor neurons and muscles. One promising area of research is cell-based therapies, which leverage the regenerative potential of cells to address motor neuron diseases and muscle atrophy. Preclinical development in this sector is ongoing, with stem cell therapy and muscle regeneration being key focus areas. Muscle biopsies play a crucial role in the diagnostic process, providing valuable insights into disease progression and potential biomarkers. Motor neuron diseases, such as Amyotrophic Lateral Sclerosis (ALS) and Muscular Dystrophies, present unique challenges in terms of disease biomarkers and clinical outcome measures.
- In ALS, for instance, disease progression is assessed using functional MRI and nerve conduction studies, while safety profiles and efficacy endpoints are essential considerations in clinical trials. Stem cell therapy holds significant promise for motor neuron diseases and muscle atrophy. This approach involves transplanting healthy cells into the affected areas to promote muscle regeneration and improve motor function. Preclinical studies have shown promising results, with ongoing clinical trials evaluating safety and efficacy. Another area of interest is gene therapy, which aims to address the underlying genetic mutations causing neuromuscular diseases. For example, exosome therapy, a type of gene therapy, has shown potential in preclinical studies for treating muscle atrophy.
- Translational research in this area is ongoing, with regulatory pathways and safety profiles being carefully evaluated. The market is expected to grow at a steady pace, with industry analysts projecting a 10% annual growth rate over the next decade. This growth is driven by the continuous unfolding of research and development in various sectors, including cell-based therapies, gene therapy, and targeted therapies. The ongoing quest for effective treatments for motor neuron diseases and muscle atrophy ensures a dynamic and evolving market landscape. In the realm of disease biomarkers, researchers are making strides in identifying molecular pathways and ion channel modulation as potential targets for therapeutic interventions.
- Synaptic transmission and drug interactions are also being closely studied to better understand disease mechanisms and develop more effective treatments. Overall, the market is characterized by continuous innovation and a strong focus on improving patient outcomes. The ongoing research in areas such as cell-based therapies, gene therapy, and disease biomarkers promises to bring new treatments to market and improve the lives of those affected by motor neuron diseases and muscle atrophy.
Dive into Technavio's robust research methodology, blending expert interviews, extensive data synthesis, and validated models for unparalleled Neuromuscular Disease Therapeutics Market insights. See full methodology.
|
Market Scope |
|
|
Report Coverage |
Details |
|
Page number |
195 |
|
Base year |
2024 |
|
Historic period |
2019-2023 |
|
Forecast period |
2025-2029 |
|
Growth momentum & CAGR |
Accelerate at a CAGR of 14.6% |
|
Market growth 2025-2029 |
USD 13,727.5 million |
|
Market structure |
Fragmented |
|
YoY growth 2024-2025(%) |
11.6 |
|
Key countries |
US, Canada, Germany, UK, Italy, France, China, India, Japan, Brazil, Egypt, UAE, Oman, Argentina, KSA, UAE, Brazil, and Rest of World (ROW) |
|
Competitive landscape |
Leading Companies, Market Positioning of Companies, Competitive Strategies, and Industry Risks |
What are the Key Data Covered in this Neuromuscular Disease Therapeutics Market Research and Growth Report?
- CAGR of the Neuromuscular Disease Therapeutics industry during the forecast period
- Detailed information on factors that will drive the growth and forecasting between 2025 and 2029
- Precise estimation of the size of the market and its contribution of the industry in focus to the parent market
- Accurate predictions about upcoming growth and trends and changes in consumer behaviour
- Growth of the market across North America, Europe, Asia, and Rest of World (ROW)
- Thorough analysis of the market's competitive landscape and detailed information about companies
- Comprehensive analysis of factors that will challenge the neuromuscular disease therapeutics market growth of industry companies
We can help! Our analysts can customize this neuromuscular disease therapeutics market research report to meet your requirements.
 RIA -
RIA - 
