Plasma Lamp Market Size 2025-2029
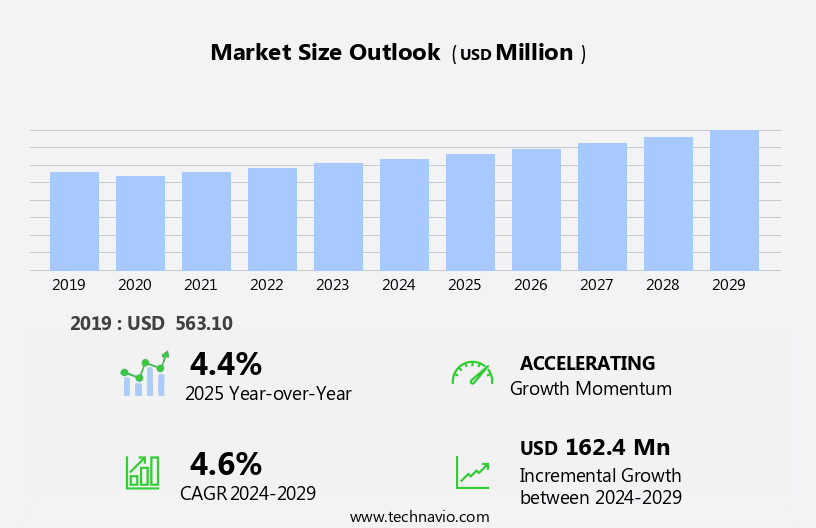
The plasma lamp market size is forecast to increase by USD 162.4 million, at a CAGR of 4.6% between 2024 and 2029.
- The market is experiencing significant growth due to several key trends. One trend is the increasing focus on logistics and supply chain efficiency In the construction industry, leading to the adoption of plasma lamps for indoor farming and greenhouse applications. The evolving design concept in lighting products is leading to an increasing demand for premium and personalized decorative lamps, with plasma lamps gaining popularity for their unique aesthetic appeal. This trend towards personalization and customization is expected to continue, offering businesses an opportunity to cater to this growing demand. However, the high adoption of alternative lighting solutions, such as LED and energy-efficient bulbs, poses a challenge for plasma lamp manufacturers. Consumers' growing awareness of energy efficiency and cost savings associated with alternative lighting options may impact the demand for plasma lamps.
- To navigate this challenge, companies must differentiate their offerings by focusing on the unique features and benefits of plasma lamps, such as their energy efficiency, longevity, and aesthetic appeal. By addressing consumer concerns and effectively communicating the value proposition of plasma lamps, businesses can capitalize on the potential of this market and maintain their competitive edge.
What will be the Size of the Plasma Lamp Market during the forecast period?
Explore in-depth regional segment analysis with market size data - historical 2019-2023 and forecasts 2025-2029 - in the full report.
Request Free Sample
The market continues to evolve, shaped by dynamic market forces and diverse applications. Noble gases, essential for plasma generation, fuel ongoing research and development. Manufacturing processes are refined to enhance energy efficiency and improve quality control. The market's continuous unfolding is evident in the evolving patterns of retail sales, with plasma lamps finding a place in various sectors. Price sensitivity shapes consumer preferences, influencing the market's direction. Gift items and decorative lighting are popular choices, while plasma lamps also serve industrial purposes such as plasma diagnostics and vacuum sealing. Voltage regulation and durability testing are crucial aspects of manufacturing, ensuring safety standards are met.
Color variations and mood lighting add to the market's appeal, catering to diverse customer needs. Plasma density and electron temperature are subjects of ongoing scientific research, driving innovation. Safety regulations and environmental impact are key considerations, shaping manufacturing costs and sales channels. Competitor analysis and after-sales support are essential components of marketing strategies. Material sourcing and gas filling are critical aspects of supply chain management. Sales channels, including retail displays and online sales, are evolving to meet changing consumer preferences. Promotional offers and point-of-sale merchandising are effective marketing tools. Brand awareness and product innovation are ongoing priorities. Electromagnetic fields and ion temperature are subjects of electrical testing, ensuring product reliability.
The market's complexity is reflected in its intricate web of interconnected components, from tesla coils and filamentary discharge to power supply and optical emission.
How is this Plasma Lamp Industry segmented?
The plasma lamp industry research report provides comprehensive data (region-wise segment analysis), with forecasts and estimates in "USD million" for the period 2025-2029, as well as historical data from 2019-2023 for the following segments.
- Type
- 300 Watt
- Above 300 Watt
- Application
- Roadways /streets /and tunnels
- Industrial
- Horticulture
- Sports and equipment
- Others
- End-use Industry
- Commercial
- Industrial
- Residential
- Geography
- North America
- US
- Canada
- Europe
- France
- Germany
- Italy
- UK
- Middle East and Africa
- Egypt
- KSA
- Oman
- UAE
- APAC
- China
- India
- Japan
- South America
- Argentina
- Brazil
- Rest of World (ROW)
- North America
By Type Insights
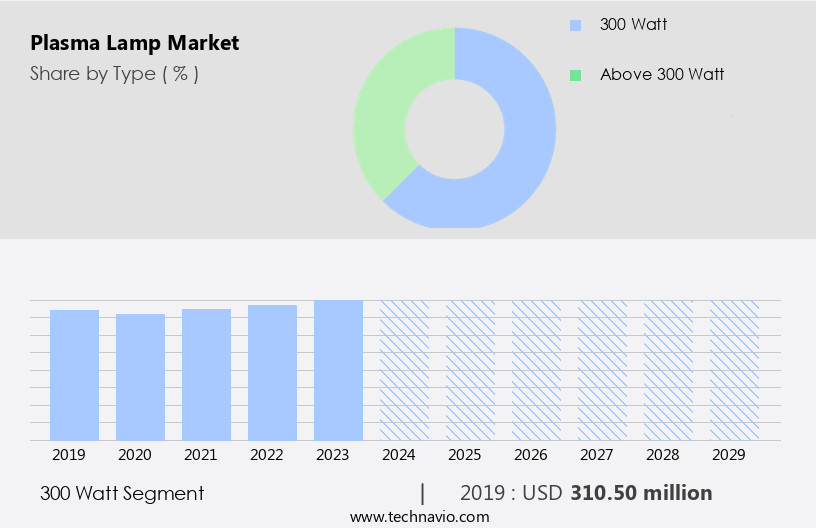
The 300 watt segment is estimated to witness significant growth during the forecast period.
The market encompasses various wattage-based sectors, with the 300-watt segment being one of them. This sector caters to plasma lamps with a power rating of up to 300 watts. These lamps are popular due to their higher brightness and light output, making them suitable for industries and sectors requiring more potent lighting solutions. The residential sector uses these lamps for decorative purposes, while they serve as alternatives for outdoor illumination. Manufacturing processes involve the use of noble gases, ensuring energy efficiency and minimal environmental impact. Quality control measures are stringently implemented to ensure consumer safety and satisfaction. The market is characterized by intense competition, with manufacturers focusing on product innovation, marketing strategies, and after-sales support.
Compliance with safety regulations is a priority, with safety standards ensuring the prevention of product recalls. Sales channels include wholesale distribution and retail, with retail sales contributing significantly to market growth. Plasma lamps exhibit various effects, including plasma density, electromagnetic fields, and ion temperature, making them popular for mood lighting and scientific research applications. The market is price-sensitive, with manufacturers offering promotional offers and discounts to attract customers. Sustainability initiatives and online sales are emerging trends. Despite the complex manufacturing processes involving high voltage, vacuum sealing, and gas filling, the market continues to grow, driven by consumer preferences for decorative and ambient lighting solutions.
The 300 Watt segment was valued at USD 310.50 million in 2019 and showed a gradual increase during the forecast period.
Regional Analysis
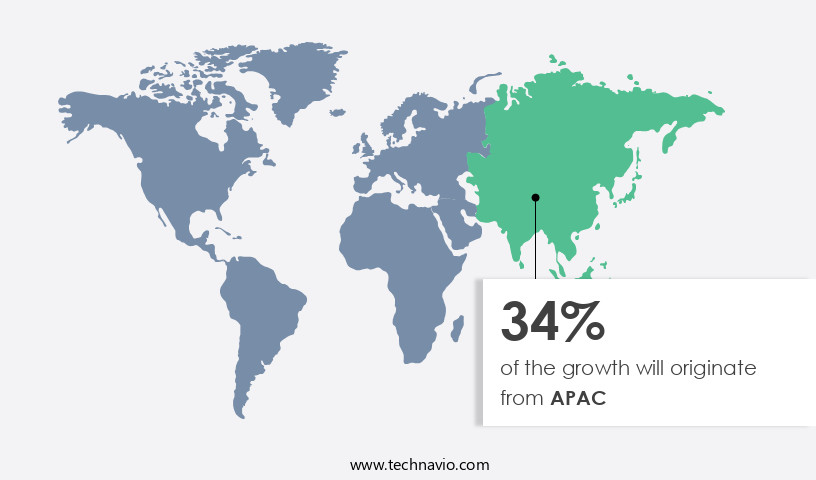
APAC is estimated to contribute 34% to the growth of the global market during the forecast period.Technavio's analysts have elaborately explained the regional trends and drivers that shape the market during the forecast period.
The European market experiences growth due to regulatory initiatives and increasing demand from the construction industry. Strict energy efficiency regulations, including the ban on less-efficient lighting sources, incentivize the adoption of plasma lamps. These policies are expected to significantly drive market expansion during the forecast period. In 2024, the commercial and industrial sectors in Europe's construction industry reported growth, contributing substantially to the market revenue. Major contributors to the market include Germany, Italy, France, the UK, and Turkey. Germany leads in plasma lamp adoption, with several cities already utilizing plasma streetlights and lamps. Manufacturing processes involve the use of noble gases, ensuring energy efficiency and long-lasting performance.
Quality control measures ensure compliance with safety standards and consumer preferences. Plasma lamps offer decorative and ambient lighting solutions, catering to various applications and customer demands. Sales channels include wholesale distribution and retail, with retail sales being a significant contributor. Marketing strategies emphasize safety regulations, durability, and product innovation to attract customers. Plasma lamps undergo rigorous testing for voltage regulation, durability, and color variations. Manufacturing costs are managed through efficient supply chain practices and material sourcing. The market also caters to novelty items and educational applications, with plasma globes and Tesla coils being popular choices. Sustainability initiatives, such as vacuum sealing and plasma diagnostics, further enhance the market's appeal.
Warranty claims and after-sales support ensure customer satisfaction. The market's future growth is influenced by factors such as price sensitivity, product placement, and export markets.
Market Dynamics
The plasma lamp market size and its evolving plasma lamp market trends are influenced by the demand for highly efficient and durable lighting. Plasma lighting market growth drivers include the need for superior illumination in applications like outdoor lighting, specifically for industrial lighting in vast construction sites, warehouses, and factories.
Electrodeless Plasma Lamps (LEP), Microwave Plasma Lighting, and RF Plasma Lighting offer advantages such as full-spectrum plasma lamps and long lifespans, contributing to energy-efficient plasma lighting. Though often competing with LEDs, the unique characteristics of plasma, supported by advancements in plasma lamp drivers, RF generators (plasma lamps), Microwave resonators (plasma lamps), and Light Emitting Plasma (LEP) technology, position them for specialized specialty lighting needs within the construction sector, often augmented by smart controls (plasma lighting) for optimized performance.
Our researchers analyzed the data with 2024 as the base year, along with the key drivers, trends, and challenges. A holistic analysis of drivers will help companies refine their marketing strategies to gain a competitive advantage.
What are the key market drivers leading to the rise in the adoption of Plasma Lamp Industry?
- The ongoing evolution of lighting product designs, resulting in an increasing focus on premiumization, is the primary market driver.
- Plasma lamps, a type of decorative lighting, are gaining popularity due to their unique designs and energy efficiency. The production capacity of plasma lamps is increasing as manufacturers strive to meet the growing demand from premium customers. Noble gases, such as neon and argon, are used in the manufacturing processes to create the distinctive glowing effect. Quality control measures are strictly enforced to ensure the longevity and safety of the lamps. Energy efficiency is a significant factor in the production of plasma lamps, making them an attractive option for consumers seeking to reduce their environmental impact.
- Manufacturing costs are continually being optimized through advancements in manufacturing processes and technology. Safety standards are a priority in the production of plasma lamps, with rigorous electrical testing and compliance with international safety regulations. Product recalls are rare due to the stringent quality control measures in place. Plasma lamps are not only used for retail displays but also for home decor and scientific research. Electrostatic discharge is a concern in the manufacturing of plasma lamps, and internal electrodes are designed to minimize this risk. The electron temperature is closely monitored during production to ensure consistent performance.
- Decorative lighting, including plasma lamps, is subject to various compliance standards to ensure safety and quality.
What are the market trends shaping the Plasma Lamp Industry?
- The trend in the decorative lighting market is shifting towards personalization and customization (Advent of personalization and customization is the upcoming market trend). Consumers now seek unique lighting solutions tailored to their specific preferences and needs.
- The market is experiencing growth due to the increasing demand for ambient lighting and unique decorative pieces in the interior design industry. Consumers seek personalized options, leading companies to offer customization services for plasma lamps, chandeliers, and pendant lights. Hangout Lighting, a leading US-based lighting provider, caters to this trend by allowing customers to choose various design elements such as cord colors, ceiling plate finishes, socket styles, and bulb types for their plasma lamps. This freedom to personalize products enhances the overall home decoration experience for customers. The high voltage, electrodeless discharge technology used in plasma lamps creates captivating plasma effects, making them popular novelty items.
- The distribution of these products occurs through various sales channels, including wholesale distribution and direct-to-consumer sales. Companies prioritize safety regulations, ensuring their glass enclosures and power supplies meet industry standards. Marketing strategies focus on showcasing the immersive and harmonious plasma effects, emphasizing the unique selling proposition of these decorative lighting solutions. Despite the complexity of the production process, lead times are kept minimal to meet customer demand. External electrodes and optical emission are integral components of plasma lamp technology, contributing to their distinctive appearance and functionality.
What challenges does the Plasma Lamp Industry face during its growth?
- The increasing reliance on alternative lighting solutions poses a significant challenge to the industry's expansion.
- Plasma lamps, which utilize the principle of glow discharge to create an immersive and harmonious lighting experience, hold a niche market position due to their unique features. Tesla coils, a key component in plasma lamps, enable the creation of plasma, a highly ionized gas, resulting in the distinctive glowing effect. Despite their premium pricing, plasma lamps are sought after for mood lighting and decorative applications, particularly in high-end residential settings. Price sensitivity is a factor in the market, with consumers carefully considering the investment in these specialized lighting solutions. Retail sales of plasma lamps often include promotional offers and after-sales support to mitigate the higher cost.
- Durability testing, plasma density control, and vacuum sealing are crucial aspects of plasma lamp manufacturing, ensuring the longevity and consistent performance of the product. Color variations and voltage regulation are essential features for plasma lamps, catering to diverse consumer preferences. Plasma diagnostics and gas filling techniques contribute to the overall quality and efficiency of the product. Effective supply chain management and material sourcing are vital for maintaining a steady market supply. Competitor analysis and continuous innovation are essential for market players to stay competitive in this niche market.
Exclusive Customer Landscape
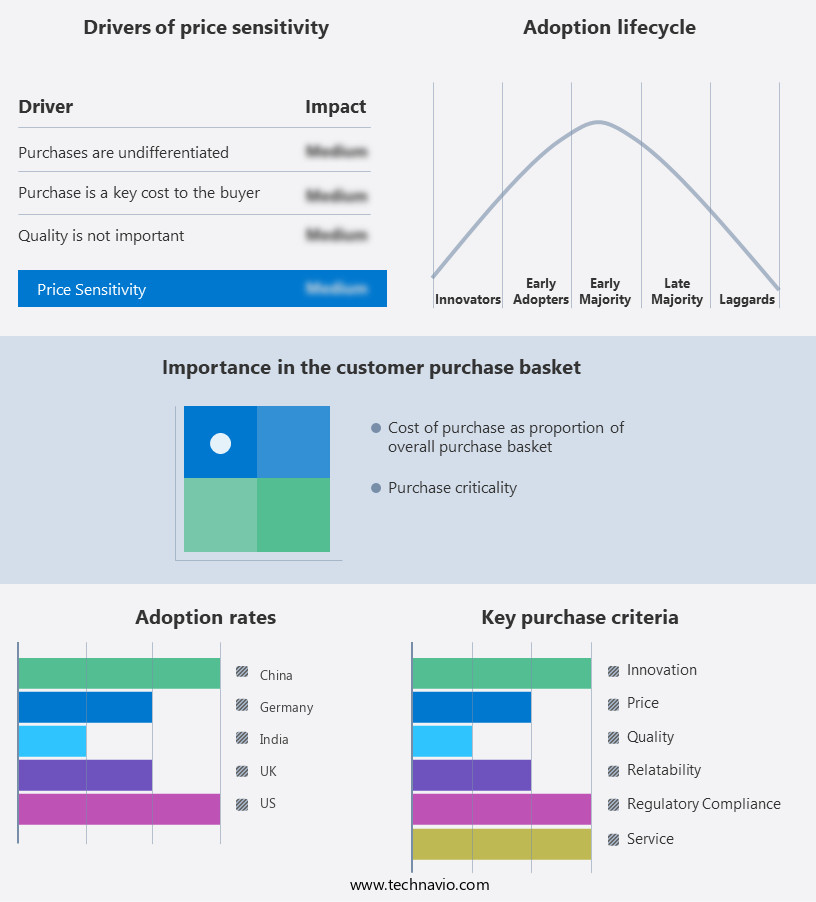
The plasma lamp market forecasting report includes the adoption lifecycle of the market, covering from the innovator's stage to the laggard's stage. It focuses on adoption rates in different regions based on penetration. Furthermore, the plasma lamp market report also includes key purchase criteria and drivers of price sensitivity to help companies evaluate and develop their market growth analysis strategies.
Customer Landscape
Key Companies & Market Insights
Companies are implementing various strategies, such as strategic alliances, plasma lamp market forecast, partnerships, mergers and acquisitions, geographical expansion, and product/service launches, to enhance their presence in the industry.
Ampleon Netherlands BV - This company specializes in RF-driven plasma lighting technology, producing innovative plasma lamp products. Their offerings deliver superior illumination through advanced plasma ignition methods, setting industry standards.
The industry research and growth report includes detailed analyses of the competitive landscape of the market and information about key companies, including:
- Ampleon Netherlands BV
- BIRNS Inc.
- Gavita International B.V.
- Hive Lighting Inc.
- Ka Shui International Holdings Ltd.
- LG Corp.
- Lumartix SA
- MTFX Online Ltd.
- Pure Plasma Lighting Inc.
- RFHIC Corp.
- Solaronix SA
- Square 1 Precision Lighting Inc.
Qualitative and quantitative analysis of companies has been conducted to help clients understand the wider business environment as well as the strengths and weaknesses of key industry players. Data is qualitatively analyzed to categorize companies as pure play, category-focused, industry-focused, and diversified; it is quantitatively analyzed to categorize companies as dominant, leading, strong, tentative, and weak.
Recent Development and News in Plasma Lamp Market
- In January 2024, Philips Hue, a leading lighting solutions provider, announced the launch of their new PlasmaGlow plasma lamp, integrating the plasma technology with smart home capabilities (Philips Hue Press Release, 2024). This innovative product merges energy-efficient plasma lighting with voice control and app connectivity, marking a significant advancement in the market.
- In March 2024, Osram, a global lighting solutions company, entered into a strategic partnership with PlasmaLight, a US-based plasma lamp technology developer, to jointly develop and commercialize advanced plasma lighting solutions (Osram Press Release, 2024). This collaboration aimed to combine Osram's manufacturing expertise and PlasmaLight's technology know-how, creating a strong synergy in the market.
- In April 2025, Signify, the parent company of Philips Hue, raised â¬250 million in a share issuance to fund its research and development initiatives, including the expansion of its plasma lamp product line (Signify Annual Report, 2025). This substantial investment underscores the company's commitment to advancing plasma lamp technology and increasing its market presence.
- In May 2025, the European Union announced the approval of a new energy efficiency regulation, which includes plasma lamps in the list of energy-efficient lighting solutions (European Commission Press Release, 2025). This policy change is expected to boost the demand for plasma lamps in Europe, as they offer energy savings and longer lifetimes compared to traditional incandescent bulbs.
Research Analyst Overview
- The market exhibits dynamic trends, with online ratings significantly influencing consumer decisions. Ul listings and social media marketing are essential components of effective marketing campaigns, driving customer engagement and reviews. Quality assurance and risk management are crucial in ensuring customer lifetime value and maintaining brand reputation. Advertising spend and media coverage are key factors in market penetration and competitive advantage. Electromagnetic interference (EMI) and international trade regulations pose challenges, necessitating industrial design innovations and supply chain adaptability. User experience, global markets, and energy consumption are critical considerations in product design and market diversification. Safety certifications, power consumption, and e-commerce platforms impact sales promotion and replacement parts availability.
- Import/export regulations and customs duties require careful planning for successful market entry. Product differentiation and digital marketing strategies are essential in customer acquisition cost reduction and value proposition enhancement. Ce marking, public relations, and product design collaborations are vital in navigating the complex the market landscape.
Dive into Technavio's robust research methodology, blending expert interviews, extensive data synthesis, and validated models for unparalleled Plasma Lamp Market insights. See full methodology.
|
Market Scope |
|
|
Report Coverage |
Details |
|
Page number |
199 |
|
Base year |
2024 |
|
Historic period |
2019-2023 |
|
Forecast period |
2025-2029 |
|
Growth momentum & CAGR |
Accelerate at a CAGR of 4.6% |
|
Market growth 2025-2029 |
USD 162.4 million |
|
Market structure |
Concentrated |
|
YoY growth 2024-2025(%) |
4.4 |
|
Key countries |
US, Germany, China, UK, India, Canada, France, Japan, Italy, and Australia |
|
Competitive landscape |
Leading Companies, Market Positioning of Companies, Competitive Strategies, and Industry Risks |
What are the Key Data Covered in this Plasma Lamp Market Research and Growth Report?
- CAGR of the Plasma Lamp industry during the forecast period
- Detailed information on factors that will drive the growth and forecasting between 2025 and 2029
- Precise estimation of the size of the market and its contribution of the industry in focus to the parent market
- Accurate predictions about upcoming growth and trends and changes in consumer behaviour
- Growth of the market across Europe, APAC, North America, Middle East and Africa, and South America
- Thorough analysis of the market's competitive landscape and detailed information about companies
- Comprehensive analysis of factors that will challenge the plasma lamp market growth of industry companies
We can help! Our analysts can customize this plasma lamp market research report to meet your requirements.


