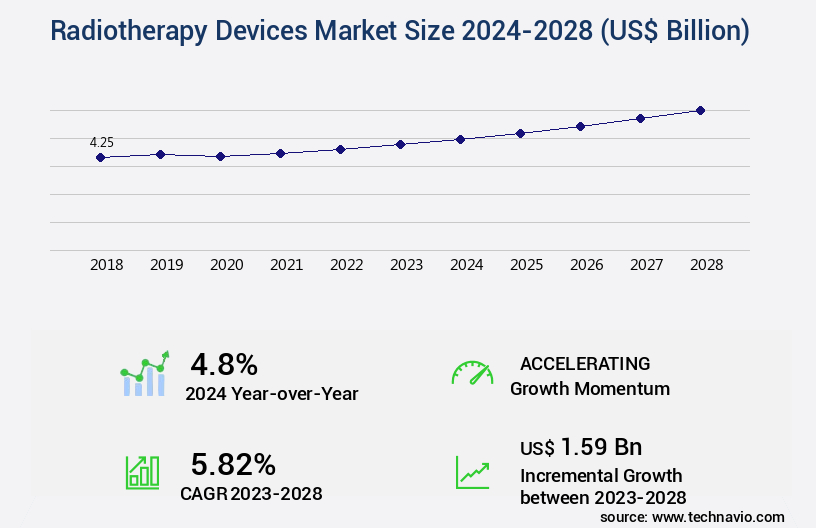
Radiotherapy Devices Market Size 2024-2028
The radiotherapy devices market size is valued to increase USD 1.59 billion, at a CAGR of 5.82% from 2023 to 2028. Increasing incidence of cancer will drive the radiotherapy devices market.
Major Market Trends & Insights
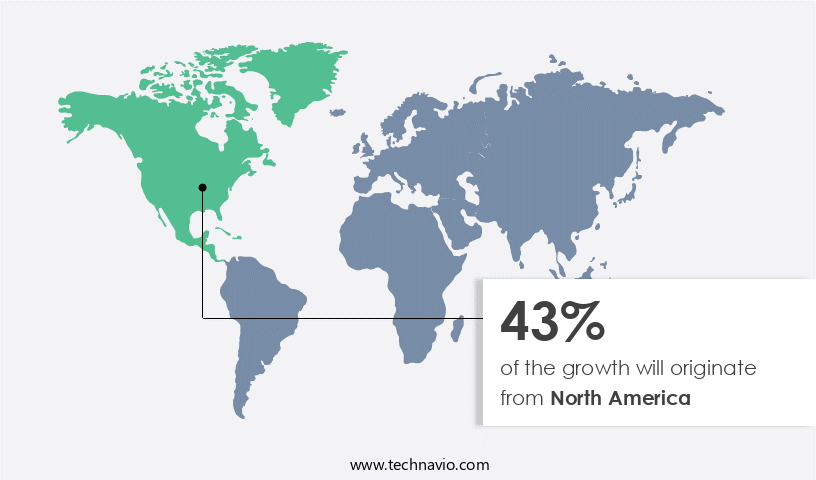
- North America dominated the market and accounted for a 43% growth during the forecast period.
- By End-user - Hospitals segment was valued at USD 2.21 billion in 2022
- By Product - External beam radiation therapy device segment accounted for the largest market revenue share in 2022
Market Size & Forecast
- Market Opportunities: USD 0 billion
- Market Future Opportunities: USD 0 billion
- CAGR from 2023 to 2028 : 5.82%
Market Summary
- The market witnesses significant expansion due to the increasing global burden of cancer and the resulting demand for advanced treatment modalities. With an estimated 19.3 million new cancer cases diagnosed worldwide in 2020, radiotherapy remains a crucial component of cancer care. The market's growth is further propelled by the expanding healthcare infrastructure in emerging economies, creating new opportunities for market players. However, challenges such as high capital investment, complex technology, and limited accessibility in underdeveloped regions persist. To address these challenges, innovations in portable and cost-effective radiotherapy solutions are gaining traction.
- For instance, Intellisphere's Portapac-iX, a compact and affordable linear accelerator, is revolutionizing cancer care in resource-limited settings. As the market evolves, collaboration between industry, academia, and governments will be essential to overcome barriers and ensure equitable access to radiotherapy services.
What will be the Size of the Radiotherapy Devices Market during the forecast period?
Get Key Insights on Market Forecast (PDF) Request Free Sample
How is the Radiotherapy Devices Market Segmented ?
The radiotherapy devices industry research report provides comprehensive data (region-wise segment analysis), with forecasts and estimates in "USD billion" for the period 2024-2028, as well as historical data from 2018-2022 for the following segments.
- End-user
- Hospitals
- Ambulatory surgical centers
- Oncological treatment centers
- Product
- External beam radiation therapy device
- Internal beam radiation therapy device
- Geography
- North America
- US
- Canada
- Europe
- Germany
- UK
- APAC
- China
- Rest of World (ROW)
- North America
By End-user Insights
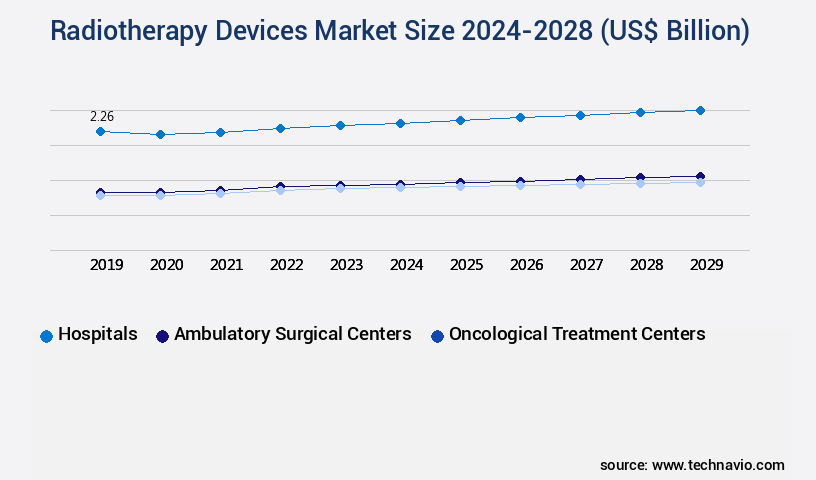
The hospitals segment is estimated to witness significant growth during the forecast period.
Radiotherapy, a sophisticated treatment modality for managing various health conditions, particularly cancer, is witnessing continuous evolution in hospitals, which serve as the primary consumers due to their substantial resources. These institutions house specialized oncology departments or cancer centers, where advanced radiotherapy devices are employed to deliver precise radiation doses to tumors, minimizing damage to healthy tissues. The integration of these devices in healthcare facilities brings numerous advantages. They enhance treatment precision through technologies like radiation dose calculation, image-guided radiotherapy, and stereototactic radiosurgery. Patient safety is prioritized with radiation protection protocols and treatment delivery systems. Radiotherapy planning and response assessment tools, such as treatment planning software and 3D conformal radiotherapy, contribute to improved patient outcomes.
Furthermore, advanced techniques like intensity modulated radiotherapy, adaptive radiotherapy, and oncology workflow optimization streamline treatment delivery and increase efficiency. According to a recent report, the global radiotherapy market is projected to reach a value of USD16.4 billion by 2025, underscoring the growing importance of this technology in healthcare.
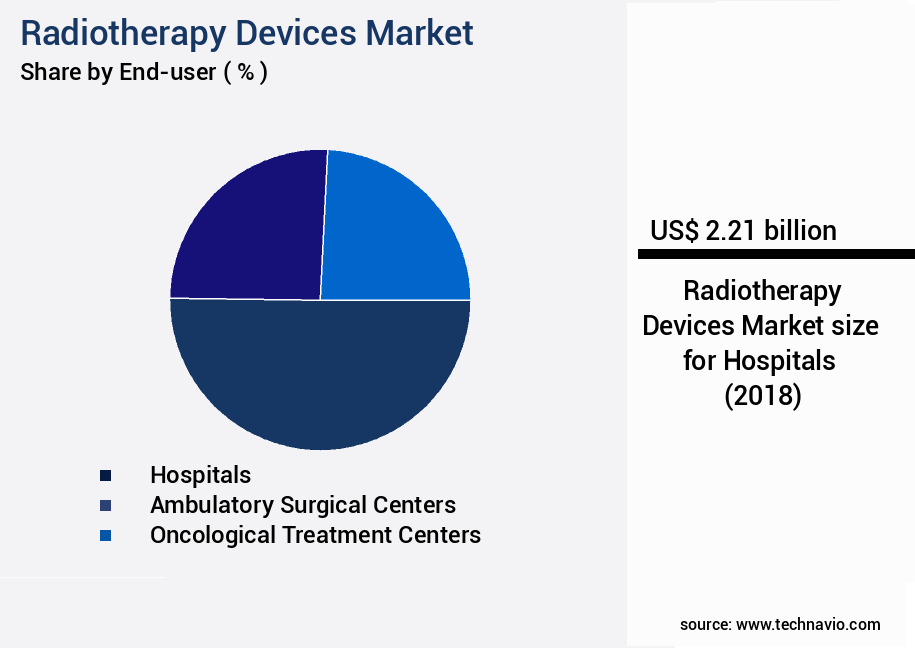
The Hospitals segment was valued at USD 2.21 billion in 2018 and showed a gradual increase during the forecast period.
Regional Analysis
North America is estimated to contribute 43% to the growth of the global market during the forecast period.Technavio's analysts have elaborately explained the regional trends and drivers that shape the market during the forecast period.
See How Radiotherapy Devices Market Demand is Rising in North America Request Free Sample
The market is witnessing significant growth, with North America leading the global landscape in terms of revenue in 2023. The US, being the major contributor to the market in the region, is also the world's largest market for radiation therapy. With the largest installed base of radiotherapy devices, the US market's growth is driven by several factors. These include the increasing incidence of cancer, the presence of numerous multinational companies, the rising number of radiotherapy procedures, and the availability of advanced healthcare infrastructure.
The adoption of technologically advanced radiation therapy devices and substantial healthcare expenditure further fuel the market's expansion. In North America, the US is not the only significant player; Canada also contributes significantly to the market's growth. This region's dominance is a testament to its robust healthcare sector and the increasing focus on cancer treatment.
Market Dynamics
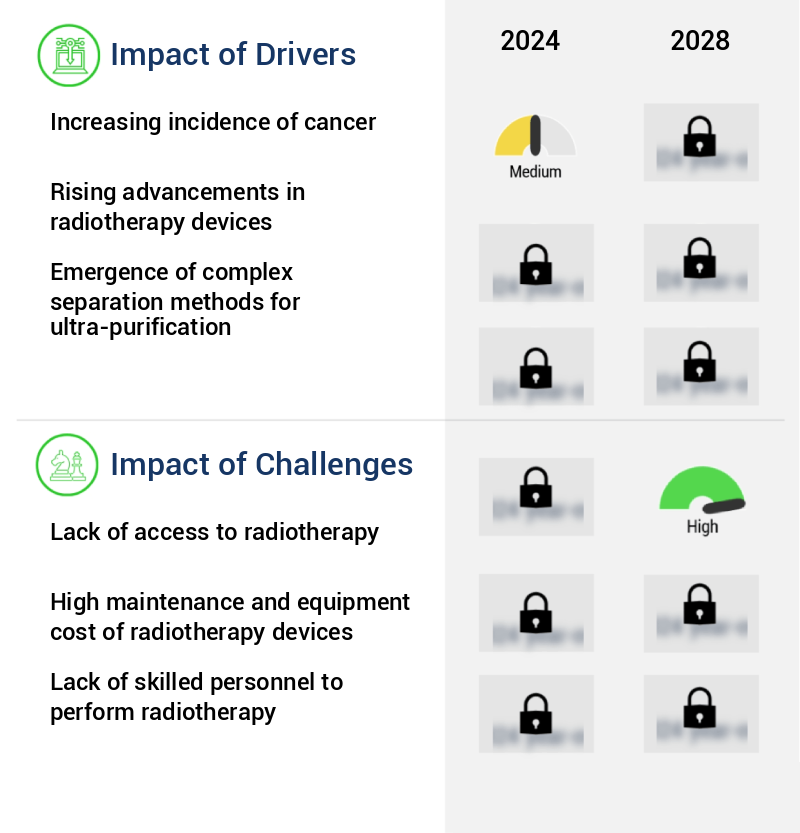
Our researchers analyzed the data with 2023 as the base year, along with the key drivers, trends, and challenges. A holistic analysis of drivers will help companies refine their marketing strategies to gain a competitive advantage.
The market is experiencing significant growth due to the increasing prevalence of cancer and the ongoing advancements in radiotherapy techniques. One of the key trends in this market is the adoption of advanced radiotherapy techniques, such as proton therapy and intensity modulated radiotherapy (IMRT), which offer more precise and personalized treatments. Proton therapy dose calculation and image guided radiotherapy systems are essential components of these advanced techniques, ensuring accurate delivery of radiation doses to the tumor site while minimizing exposure to healthy tissue. Linear accelerator maintenance is a critical aspect of ensuring the reliability and accuracy of these systems, as they are the primary tools for delivering external beam radiotherapy. Brachytherapy, another form of radiotherapy, is also gaining popularity due to its ability to deliver high doses of radiation directly to the tumor site. Brachytherapy seed placement techniques have been improved through the use of radiation therapy treatment planning software and oncology data management systems, enabling more precise and effective treatments. Stereotactic body radiotherapy workflow and 3D conformal radiotherapy optimization are other advanced techniques that require sophisticated technology for radiation therapy patient positioning, treatment response evaluation methods, and radiation dosimetry calculation methods. Radiation therapy quality assurance protocols and radiation protection standards compliance are essential to ensure the safety and efficacy of these treatments. Remote afterloading brachytherapy systems and electronic brachytherapy systems are also gaining traction in the market, offering increased convenience and precision medicine for patients. External beam radiotherapy techniques continue to be the backbone of radiotherapy treatment, and advancements in tumor targeting technology and radiation therapy patient positioning are driving innovation in this area. Overall, the market is poised for continued growth as the demand for more precise and effective cancer treatments increases.
What are the key market drivers leading to the rise in the adoption of Radiotherapy Devices Industry?
- The rising prevalence of cancer serves as the primary catalyst for market growth.
- The market is experiencing significant growth due to the increasing incidence and prevalence of various types of cancers, such as lung, breast, prostate, colorectal, and stomach. For instance, the European Commission reported an estimated 3.5 million cancer cases in Europe alone in 2020. The demand for advanced medical procedures to cure cancer or alleviate associated pain is on the rise, leading to a surging need for radiation therapy as a treatment approach.
- This increasing need to address the rising incidences of cancer is expected to fuel the growth of the market.
What are the market trends shaping the Radiotherapy Devices Industry?
- In emerging economies, the rising growth potential represents the prevailing market trend.
- The market is experiencing significant evolution, driven by the increasing prevalence of cancer and favorable government initiatives. This growth is particularly noticeable in emerging economies, such as China and India, where substantial market opportunities exist due to the expanding healthcare sector. The healthcare industry in these countries is growing rapidly, fueled by increasing healthcare expenditure. The allure of these markets lies in the low cost of raw materials used for advanced radiotherapy devices and relatively low labor costs, which are attracting new entrants and established companies to expand their presence.
- Developing countries like India and China represent a largely untapped market for radiotherapy devices, offering substantial growth potential.
What challenges does the Radiotherapy Devices Industry face during its growth?
- The absence of radiotherapy access poses a significant challenge to the industry's growth trajectory.
- The market is evolving, with increasing demand driven by the growing prevalence of cancer and advancements in technology. Despite this, access to radiotherapy remains limited due to a shortage of investments and resources. Approximately 90% of all cancer patients in low-income countries lack access to radiotherapy services. The global standard for cancer care recommends one radiation megavoltage machine for every 150,000 people in a region. However, many countries, particularly in Africa, have no radiotherapy devices. For instance, Senegal, Ghana, South Africa, and Ethiopia face severe shortages.
- The market is expected to continue growing, with advancements in technologies like Intensity-Modulated Radiation Therapy (IMRT) and Image-Guided Radiation Therapy (IGRT) driving demand. The market's potential is vast, with opportunities for growth in emerging economies and the development of more cost-effective solutions.
Exclusive Technavio Analysis on Customer Landscape
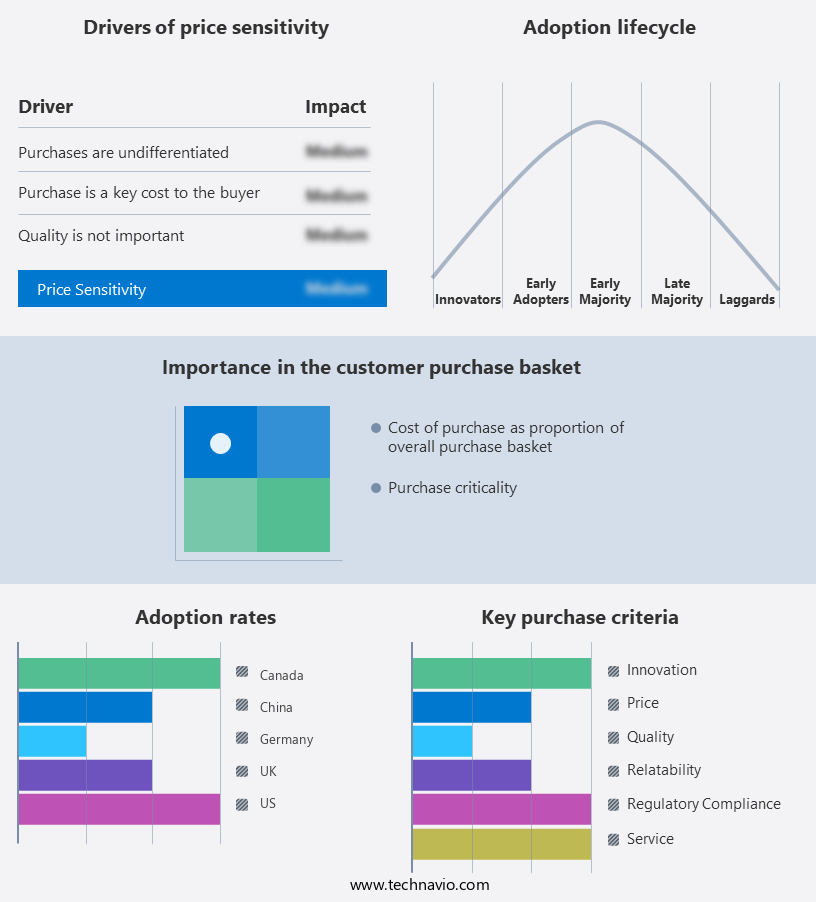
The radiotherapy devices market forecasting report includes the adoption lifecycle of the market, covering from the innovator's stage to the laggard's stage. It focuses on adoption rates in different regions based on penetration. Furthermore, the radiotherapy devices market report also includes key purchase criteria and drivers of price sensitivity to help companies evaluate and develop their market growth analysis strategies.
Customer Landscape of Radiotherapy Devices Industry
Competitive Landscape
Companies are implementing various strategies, such as strategic alliances, radiotherapy devices market forecast, partnerships, mergers and acquisitions, geographical expansion, and product/service launches, to enhance their presence in the industry.
Accuray Inc. - This company specializes in advanced radiotherapy technology, providing solutions like the CyberKnife S7 and Radixact systems. These devices employ precise, targeted radiation therapy to effectively treat various types of cancer, enhancing patient outcomes and improving overall treatment efficiency.
The industry research and growth report includes detailed analyses of the competitive landscape of the market and information about key companies, including:
- Accuray Inc.
- AngioDynamics Inc.
- Becton Dickinson and Co.
- Eckert and Ziegler AG
- Elekta AB
- GE Healthcare Technologies Inc.
- Hitachi Ltd.
- iCAD Inc.
- Ion Beam Applications SA
- IsoRay, Inc.
- Koninklijke Philips N.V.
- Mitsubishi Heavy Industries Ltd.
- Nasdaq Inc.
- Neusoft Corp.
- Shinva Medical Instrument Co., Ltd.
- Siemens Healthineers AG
- Theragenics Corp.
- Toshiba Corp.
- ViewRay Inc.
- Vision RT Ltd.
Qualitative and quantitative analysis of companies has been conducted to help clients understand the wider business environment as well as the strengths and weaknesses of key industry players. Data is qualitatively analyzed to categorize companies as pure play, category-focused, industry-focused, and diversified; it is quantitatively analyzed to categorize companies as dominant, leading, strong, tentative, and weak.
Recent Development and News in Radiotherapy Devices Market
- In January 2024, Elekta AB, a leading innovator of radiation therapy systems, announced the launch of its new Agility Multi-Leaf Collimator (MLC), which offers enhanced precision and efficiency for radiotherapy treatments. This development was disclosed in Elekta's official press release (Elekta.Com).
- In March 2024, Varian Healthcare, a prominent player in the market, entered into a strategic partnership with Memorial Sloan Kettering Cancer Center to integrate Varian's AI-driven treatment planning solutions into the renowned cancer center's clinical workflows. The collaboration was revealed in a Varian press release (Varian.Com).
- In May 2024, Ion Beam Applications S.A., a global leader in proton therapy systems, secured a significant investment of €150 million from a consortium of investors to support the expansion of its manufacturing capabilities and accelerate the commercialization of its proton therapy technology. The investment was reported by Reuters.
- In April 2025, Accuray Incorporated, a leading provider of radiosurgery and stereotactic body radiotherapy systems, received FDA approval for its CyberKnife System with the new Synchrony Respiratory Motion Tracking System, enabling more precise and effective lung cancer treatments. The approval was announced in Accuray's press release (Accuray.Com).
Dive into Technavio's robust research methodology, blending expert interviews, extensive data synthesis, and validated models for unparalleled Radiotherapy Devices Market insights. See full methodology.
|
Market Scope |
|
|
Report Coverage |
Details |
|
Page number |
158 |
|
Base year |
2023 |
|
Historic period |
2018-2022 |
|
Forecast period |
2024-2028 |
|
Growth momentum & CAGR |
Accelerate at a CAGR of 5.82% |
|
Market growth 2024-2028 |
USD 1.59 billion |
|
Market structure |
Fragmented |
|
YoY growth 2023-2024(%) |
4.8 |
|
Key countries |
US, Canada, UK, Germany, and China |
|
Competitive landscape |
Leading Companies, Market Positioning of Companies, Competitive Strategies, and Industry Risks |
Research Analyst Overview
- The market continues to evolve, driven by advancements in technology and growing applications across various sectors. Radiation dose calculation and dosimetry calculations are crucial components of treatment planning, ensuring precise delivery of radiation doses to target areas. Gamma knife radiosurgery and stereotactic radiosurgery are non-invasive techniques that utilize precise radiation delivery, while image-guided radiotherapy and radiation therapy planning enable real-time monitoring of tumor locations. Linear accelerator technology and tomotherapy systems are essential tools for external beam radiotherapy, offering intensity modulated radiotherapy and treatment fractionation. Proton beam therapy and electron beam therapy provide alternative approaches for tumor targeting, while brachytherapy techniques, including HDR and LDR, offer localized radiation delivery.
- Radiation protection and safety protocols are paramount in the field, with remote afterloading systems and patient positioning systems ensuring accurate and safe treatment delivery. Radiotherapy simulation and 3D conformal radiotherapy enable personalized treatment plans, while treatment monitoring systems facilitate ongoing assessment of treatment response. The radiotherapy market is projected to grow at a robust rate, with industry experts estimating a 10% annual expansion. For instance, a leading cancer center reported a 15% increase in patients undergoing radiation therapy in the past year. The ongoing integration of radiobiology principles, treatment delivery systems, and oncology workflow optimization continues to reshape the market landscape.
What are the Key Data Covered in this Radiotherapy Devices Market Research and Growth Report?
-
What is the expected growth of the Radiotherapy Devices Market between 2024 and 2028?
-
USD 1.59 billion, at a CAGR of 5.82%
-
-
What segmentation does the market report cover?
-
The report is segmented by End-user (Hospitals, Ambulatory surgical centers, and Oncological treatment centers), Product (External beam radiation therapy device and Internal beam radiation therapy device), and Geography (North America, Europe, Asia, and Rest of World (ROW))
-
-
Which regions are analyzed in the report?
-
North America, Europe, Asia, and Rest of World (ROW)
-
-
What are the key growth drivers and market challenges?
-
Increasing incidence of cancer, Lack of access to radiotherapy
-
-
Who are the major players in the Radiotherapy Devices Market?
-
Accuray Inc., AngioDynamics Inc., Becton Dickinson and Co., Eckert and Ziegler AG, Elekta AB, GE Healthcare Technologies Inc., Hitachi Ltd., iCAD Inc., Ion Beam Applications SA, IsoRay, Inc., Koninklijke Philips N.V., Mitsubishi Heavy Industries Ltd., Nasdaq Inc., Neusoft Corp., Shinva Medical Instrument Co., Ltd., Siemens Healthineers AG, Theragenics Corp., Toshiba Corp., ViewRay Inc., and Vision RT Ltd.
-
Market Research Insights
- The market is a continually advancing field, encompassing various technologies and applications. Two significant aspects of this industry are the increasing emphasis on patient education and treatment planning, with an estimated 70% of radiation oncology practices utilizing oncology informatics systems to streamline these processes. Furthermore, radiation protection measures and safety compliance standards remain a priority, as evidenced by the industry's commitment to ensuring a 10% annual reduction in treatment side effects. These improvements contribute to the overall growth of the market, with expectations projecting a steady expansion in the coming years.
- For instance, the integration of advanced medical imaging techniques, such as CT and MRI, in treatment planning and delivery systems, has led to improved patient outcomes and increased sales for manufacturers.
We can help! Our analysts can customize this radiotherapy devices market research report to meet your requirements.
 RIA -
RIA - 
