
Ready To Eat Food Market Size 2025-2029
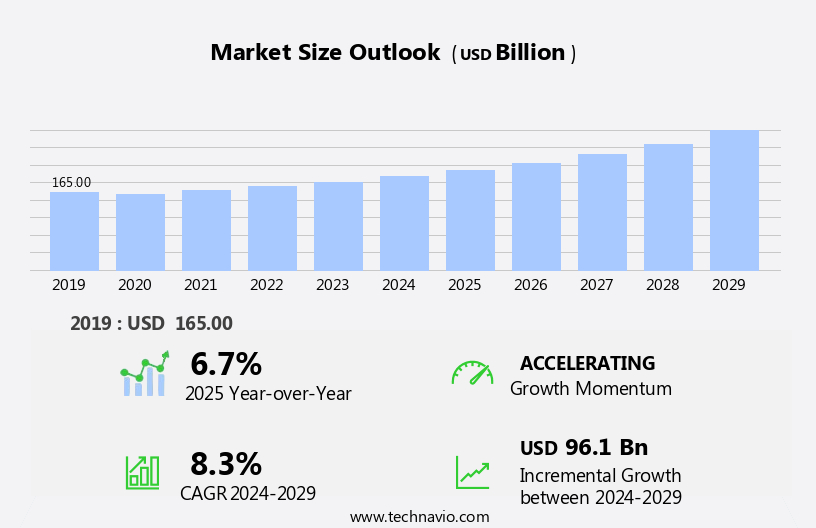
The ready to eat food market size is forecast to increase by USD 96.1 billion, at a CAGR of 8.3% between 2024 and 2029.
- The market is witnessing significant growth, driven by the increasingly hectic lifestyles and urbanization trends. Consumers are increasingly seeking convenience in their food choices, leading to a surge in demand for ready-to-eat meals. This trend is particularly prominent in developed economies, where time-starved individuals and families opt for ready-to-eat food solutions. However, this market is not without its challenges. Health concerns are a major obstacle, with consumers expressing concerns over the nutritional value and additives in ready-to-eat meals. Companies must address these concerns by offering healthier options, transparent labeling, and clear communication about ingredients and nutritional information.
- Additionally, sustainability is becoming a critical factor, with consumers demanding eco-friendly packaging and ethical sourcing practices. Companies that can effectively navigate these challenges and offer innovative, healthy, and sustainable ready-to-eat food solutions will be well-positioned to capitalize on the market's growth potential.
What will be the Size of the Ready To Eat Food Market during the forecast period?
Explore in-depth regional segment analysis with market size data - historical 2019-2023 and forecasts 2025-2029 - in the full report.
Request Free Sample
The ready-to-eat food market continues to evolve, driven by consumer preferences for convenience and innovation. Food service operators seek to meet these demands through various channels, including meal delivery services, menu planning, and meal kits. High-pressure processing (HPP) is a key technology in ensuring food safety and extending shelf life, while ingredient sourcing and ethical considerations play a significant role in brand awareness. Product labeling and nutritional information are essential for consumer transparency, with e-commerce platforms enabling easy access to a wide range of options. Food styling and taste profiles are critical in appealing to health-conscious consumers, who prioritize nutritional value and food waste reduction.
Temperature control and supply chain management are crucial for maintaining product quality and ensuring timely delivery. Pricing strategies and promotional activities are also essential in attracting and retaining consumer loyalty. Meanwhile, convenience stores and grocery stores offer a more accessible alternative to traditional food outlets, with portion sizes and cooking methods tailored to individual needs. Consumer research and ingredient processing are ongoing priorities for new product development, with texture modification and flavor enhancement key considerations. Ethical sourcing and food safety are paramount in building consumer trust, with allergen information and preservation techniques essential for catering services and retail channels.
The ready-to-eat food market remains a dynamic and evolving landscape, with ongoing innovation and adaptation to consumer demands.
How is this Ready To Eat Food Industry segmented?
The ready to eat food industry research report provides comprehensive data (region-wise segment analysis), with forecasts and estimates in "USD billion" for the period 2025-2029, as well as historical data from 2019-2023 for the following segments.
- Distribution Channel
- Offline
- Online
- Product
- Frozen
- Ready-to-heat
- Ready-to-cook
- End-user
- Households
- Food Services Industry
- Others
- Geography
- North America
- US
- Canada
- Europe
- France
- Germany
- Italy
- UK
- APAC
- China
- India
- Japan
- South Korea
- Rest of World (ROW)
- North America
By Distribution Channel Insights
The offline segment is estimated to witness significant growth during the forecast period.
The Ready To Eat (RTE) food market continues to experience significant growth, driven by various factors. Food processing equipment plays a crucial role in producing RTE meals efficiently and at scale. Recipe development is a key aspect of innovation, ensuring products cater to evolving consumer preferences for taste, nutrition, and convenience. Convenience factors, such as long shelf life, ease of preparation, and portability, are major selling points for RTE food. Food service operators increasingly rely on RTE meals for their businesses, from schools and hospitals to corporate cafeterias and restaurants. Brand awareness and marketing strategies are essential for reaching consumers and building loyalty.
Product innovation, including meal kits, meal delivery services, and high-pressure processing (HPP), enables companies to cater to diverse consumer needs and dietary restrictions. Ingredient processing and sourcing, temperature control, and ethical sourcing are critical components of maintaining quality and consumer trust. Menu planning and nutritional labeling help foodservice operators and consumers make informed decisions. Supply chain management, waste management, and pricing strategies are essential for ensuring a consistent product supply and competitive pricing. Consumer research and food photography are vital for understanding consumer preferences and promoting products effectively. Preservation techniques, including HPP and temperature control, help maintain product quality and extend shelf life.
Grocery stores and convenience stores serve as crucial retail channels, catering to various consumer segments and shopping behaviors. Allergen information and portion sizes are important considerations for health-conscious consumers and those with dietary restrictions. Catering services and e-commerce platforms offer additional revenue streams for RTE food providers. Consumer loyalty programs and promotional activities help build long-term relationships with customers. Texture modification, cooking methods, and flavor enhancement are ongoing areas of research and development. Food safety remains a top priority, with stringent regulations and quality control measures in place to ensure the highest standards. Overall, the RTE food market is a dynamic and evolving industry, driven by consumer preferences, technological advancements, and business strategies.
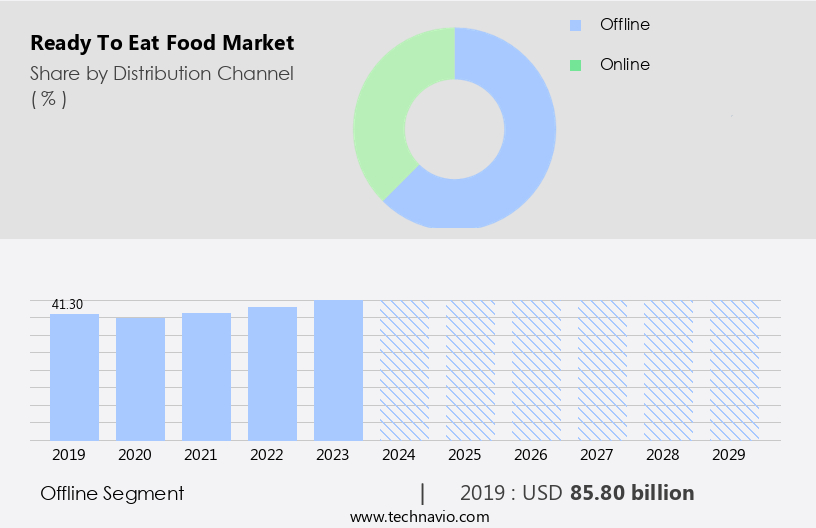
The Offline segment was valued at USD 85.80 billion in 2019 and showed a gradual increase during the forecast period.
Regional Analysis
North America is estimated to contribute 29% to the growth of the global market during the forecast period.Technavio's analysts have elaborately explained the regional trends and drivers that shape the market during the forecast period.
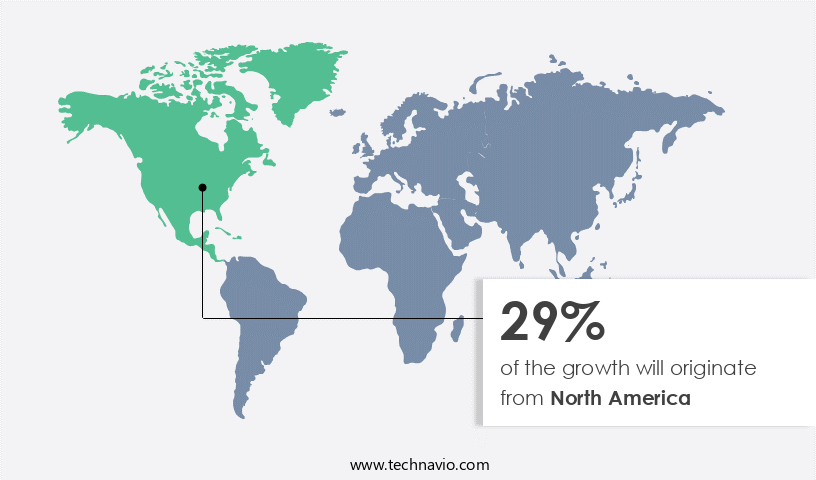
The market in North America is experiencing significant growth, driven by urbanization and changing consumer preferences. In 2023, over 82% of Canada's and 83% of the U.S. Populations resided in urban areas, according to the World Bank. This urban concentration fuels demand for convenient meal solutions due to time constraints and accessibility. Food processing equipment and recipe development play crucial roles in meeting this demand. Food service operators increasingly rely on meal delivery services and meal kits for their businesses, while e-commerce platforms expand distribution networks. Brands focus on product innovation, flavor enhancement, and nutritional labeling to attract health-conscious consumers.
Temperature control and food safety are paramount, as is ethical sourcing and quality control. Consumer research informs menu planning and pricing strategies. High-pressure processing (hpp) and texture modification are key preservation techniques. Portion sizes and ingredient sourcing are also important considerations. Supply chain management, waste management, and food photography are essential elements of marketing strategies. Allergen information and catering services cater to diverse consumer preferences. New product development and ingredient processing are ongoing priorities. Consumer loyalty is fostered through promotional activities and catering to price sensitivity. Overall, the market in North America is a dynamic and evolving landscape, shaped by demographic trends, economic indicators, and strategic industry developments.
Market Dynamics
Our researchers analyzed the data with 2024 as the base year, along with the key drivers, trends, and challenges. A holistic analysis of drivers will help companies refine their marketing strategies to gain a competitive advantage.
B2B RTE strategies utilize convenience food technologies for busy lifestyles. RTE food prospects 2025 include healthy RTE meals for retailers and vegan RTE snacks, boosting demand. RTE logistics analytics optimize distribution, while RTE food benchmarks spotlight Nestlé. Sustainable RTE sourcing aligns with clean-label food trends. RTE regulations 2025-2029 steer RTE demand in North America 2025. Premium RTE products and RTE market forecasts fuel expansion. RTE meals for offices and custom RTE formulations target niches. RTE hurdles and innovations address nutritional concerns, with RTE supplier networks and RTE cost tactics enhancing profitability. RTE food insights and convenience food breakthroughs accelerate momentum.
What are the key market drivers leading to the rise in the adoption of Ready To Eat Food Industry?
- Urbanization and busy lifestyles serve as the primary catalysts for market growth. With increasing numbers of people living in cities and leading active, on-the-go existences, the demand for products and services that cater to their convenience and efficiency continues to escalate.
- The market is experiencing significant growth due to the increasing urban population and the prevalence of busy lifestyles. In 2023, approximately 55% of the global population lived in urban areas, and this number is projected to reach 68% by 2050. This demographic shift is accompanied by changes in work patterns, commuting habits, and household structures, leading to a growing demand for convenient meal solutions. Urban living often correlates with longer working hours and less time for meal preparation. To cater to this demand, companies are implementing marketing strategies such as promotional activities, new product development, and nutritional labeling.
- Meal kits and convenience stores are popular channels for delivering ready to eat meals, offering consumers the convenience and flexibility they desire. Supply chain management is crucial to ensure the freshness and flavor enhancement of these meals. Catering services are also gaining popularity for corporate events and office meals. Moreover, there is a growing emphasis on reducing food waste and improving nutritional value. Companies are focusing on sustainable sourcing, portion control, and innovative packaging solutions to address these concerns. Consumer loyalty is a key consideration, with companies offering rewards programs and personalized meal plans to retain customers. Overall, the market is a dynamic and innovative space, with companies continually exploring new ways to meet the evolving needs of consumers.
What are the market trends shaping the Ready To Eat Food Industry?
- Focusing on new product launches is currently a significant market trend. It is essential for businesses to stay informed and prepared for introducing innovative offerings to maintain competitiveness.
- The ready-to-eat food market is experiencing significant growth due to increasing consumer preferences for convenience and healthier options. Manufacturers are focusing on new product development, catering to specific dietary needs, lifestyle choices, and taste profiles. In response to the health trend, Nestle introduced Vital Pursuit, a frozen food line in May 2023, designed for individuals using weight-loss medications. This range includes protein pasta, sandwich melts, pizzas, and whole grain bowls, all priced under USD5. These meals are formulated to be high in protein and fiber, with essential nutrients and portion-controlled servings. High-pressure processing (HPP) is a popular method used to preserve the food's freshness and nutritional value while maintaining its taste.
- Product labeling is also a crucial factor, with consumers demanding transparency regarding ingredient sourcing, cooking methods, and texture modification. Ethical sourcing is becoming increasingly important, and companies are focusing on sustainable and locally-sourced ingredients. E-commerce platforms have played a significant role in the market's growth, enabling consumers to order ready-to-eat meals online and have them delivered to their doorstep. Waste management is another critical issue, with manufacturers focusing on reducing food waste through portion sizes and innovative packaging solutions. Consumer preferences continue to evolve, and companies must stay agile to meet their demands.
What challenges does the Ready To Eat Food Industry face during its growth?
- The growth of the industry is significantly impacted by health concerns, which represent a major challenge.
- The market faces growing scrutiny from health-conscious consumers, who are increasingly concerned about the nutritional content and safety of processed food items. Many ready to eat foods contain preservatives, artificial additives, high sodium levels, unhealthy fats, and added sugars, which, when consumed frequently or in large quantities, have been linked to obesity, hypertension, cardiovascular disease, diabetes, and certain cancers. A recent focus of concern is the use of artificial sweeteners, such as aspartame, which the World Health Organization classified as possibly carcinogenic to humans in July 2023. This classification has intensified public debate and consumer skepticism, highlighting the importance of quality control in the ready to eat food industry.
- Price sensitivity is another market dynamic, as grocery stores and retail channels compete to offer affordable options while maintaining food safety and allergen information transparency. Consumer research and preservation techniques play crucial roles in addressing these challenges and meeting the evolving demands of the market.
Exclusive Customer Landscape
The ready to eat food market forecasting report includes the adoption lifecycle of the market, covering from the innovator's stage to the laggard's stage. It focuses on adoption rates in different regions based on penetration. Furthermore, the ready to eat food market report also includes key purchase criteria and drivers of price sensitivity to help companies evaluate and develop their market growth analysis strategies.

Customer Landscape
Key Companies & Market Insights
Companies are implementing various strategies, such as strategic alliances, ready to eat food market forecast, partnerships, mergers and acquisitions, geographical expansion, and product/service launches, to enhance their presence in the industry.
BRF SA - The Brazilian food conglomerate produces and markets a range of ready-to-eat food products under the brands Sadia, Perdigao, and Qualy. These brands cater to various consumer preferences with a focus on quality, convenience, and affordability. The company's diverse portfolio includes meat, poultry, and processed food items, positioning it as a significant player in the global food industry.
The industry research and growth report includes detailed analyses of the competitive landscape of the market and information about key companies, including:
- BRF SA
- Campbell Soup Co.
- Conagra Brands Inc.
- Dr. August Oetker Nahrungsmittel KG
- Fleury Michon
- General Mills Inc.
- Gits Food Products Pvt. Ltd
- Godrej Agrovet Ltd
- Greencore Group Plc
- Haldiram Foods International Pvt. Ltd.
- ITC Ltd.
- Massa Leve
- McCain Foods Ltd.
- MTR Foods Pvt. Ltd.
- Nestle SA
- Nomad Foods Ltd.
- Premier Foods Plc
- The Kraft Heinz Co.
- Tyson Foods Inc.
- VH Group
Qualitative and quantitative analysis of companies has been conducted to help clients understand the wider business environment as well as the strengths and weaknesses of key industry players. Data is qualitatively analyzed to categorize companies as pure play, category-focused, industry-focused, and diversified; it is quantitatively analyzed to categorize companies as dominant, leading, strong, tentative, and weak.
Recent Development and News in Ready To Eat Food Market
- In January 2024, Nestlé, a global leader in the food industry, launched its new line of ready-to-eat plant-based meals, "Green Chickpea," in the US market. The product line expansion aimed to cater to the growing demand for plant-based food options (Nestlé Press Release, 2024).
- In March 2024, Amazon Fresh, Amazon's grocery delivery service, announced a strategic partnership with Starbucks to offer ready-to-eat meals and beverages from the coffee giant on its platform. This collaboration aimed to enhance Amazon Fresh's product offerings and provide customers with more convenience (Amazon Press Release, 2024).
- In May 2024, Danone, a leading food company, completed the acquisition of Grubhub's food delivery business for approximately USD200 million. The acquisition was part of Danone's strategy to expand its presence in the ready-to-eat food market and strengthen its delivery capabilities (Danone Press Release, 2024).
- In January 2025, McDonald's received regulatory approval from the US Food and Drug Administration (FDA) for its new ready-to-eat meal, "McPlant," made from plant-based proteins. The approval marked a significant step towards the fast-food giant's goal of offering more sustainable food options (McDonald's Press Release, 2025).
Research Analyst Overview
- In the ready-to-eat food market, transparency and authenticity are key drivers. Food fraud, a growing concern, is addressed through stringent supply chain transparency and ISO standards. Packaging materials, from compostable to edible coatings, impact consumer preference and shelf-life extension. Gluten-free, dairy-free, vegan, soy-free, and nut-free options cater to diverse dietary needs. Category management and sales promotion strategies utilize content marketing, influencer marketing, and digital marketing to engage customers. Store displays and point-of-sale (POS) systems enhance the shopping experience. Sensory evaluation, microbial control, and food waste reduction ensure product quality and sustainability.
- Organic ingredients, sustainable farming, and local sourcing appeal to eco-conscious consumers. Public relations and customer service maintain brand reputation and loyalty. Demand forecasting and inventory management optimize operations and reduce waste. Artificial colors and flavors face scrutiny, with consumers favoring natural alternatives. Overall, the ready-to-eat food market adapts to trends, prioritizing transparency, sustainability, and consumer preferences.
Dive into Technavio's robust research methodology, blending expert interviews, extensive data synthesis, and validated models for unparalleled Ready To Eat Food Market insights. See full methodology.
|
Market Scope |
|
|
Report Coverage |
Details |
|
Page number |
232 |
|
Base year |
2024 |
|
Historic period |
2019-2023 |
|
Forecast period |
2025-2029 |
|
Growth momentum & CAGR |
Accelerate at a CAGR of 8.3% |
|
Market growth 2025-2029 |
USD 96.1 billion |
|
Market structure |
Fragmented |
|
YoY growth 2024-2025(%) |
6.7 |
|
Key countries |
US, China, UK, Germany, Canada, France, Japan, India, Italy, and South Korea |
|
Competitive landscape |
Leading Companies, Market Positioning of Companies, Competitive Strategies, and Industry Risks |
What are the Key Data Covered in this Ready To Eat Food Market Research and Growth Report?
- CAGR of the Ready To Eat Food industry during the forecast period
- Detailed information on factors that will drive the growth and forecasting between 2025 and 2029
- Precise estimation of the size of the market and its contribution of the industry in focus to the parent market
- Accurate predictions about upcoming growth and trends and changes in consumer behaviour
- Growth of the market across North America, Europe, APAC, South America, and Middle East and Africa
- Thorough analysis of the market's competitive landscape and detailed information about companies
- Comprehensive analysis of factors that will challenge the ready to eat food market growth of industry companies
We can help! Our analysts can customize this ready to eat food market research report to meet your requirements.
 RIA -
RIA - 
