Red Biotechnology Market Size 2025-2029
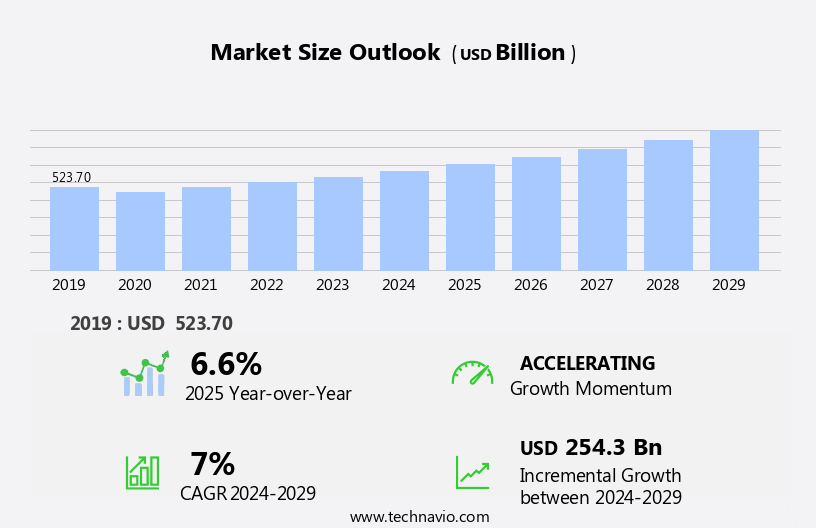
The red biotechnology market size is forecast to increase by USD 254.3 billion, at a CAGR of 7% between 2024 and 2029.
- The market is experiencing significant growth, driven by the rapid advancements in genomic research and the increasing application of stem cell research and therapies. The potential of red biotechnology to revolutionize healthcare and agriculture is immense, with numerous opportunities for innovation and commercialization. However, the high development costs of red biotechnology methods pose a substantial challenge. These costs are attributed to the complex nature of the technologies involved, the need for specialized facilities and equipment, and the lengthy regulatory approval processes. Enhanced nutrient uptake and protein expression levels are also being explored through enzyme activity assays and root colonization efficacy studies.
- Additionally, investing in research and development to reduce costs and improve efficiency will be crucial for long-term success. The market presents a compelling landscape for innovation and growth, with the potential to transform various industries and address pressing societal challenges. Companies that can navigate the challenges and capitalize on the opportunities will be well-positioned to lead in this dynamic and evolving market. Companies seeking to capitalize on the market opportunities must navigate these challenges effectively by collaborating with research institutions, securing strategic partnerships, and exploring cost-effective production methods. Tissue engineering and cell therapy are other key areas of focus, with clinical trials underway for chronic diseases like arthritis, type 2 diabetes, and TB.
What will be the Size of the Red Biotechnology Market during the forecast period?
Get Key Insights on Market Forecast (PDF)
Request Free Sample
- The market continues to evolve, driven by advancements in biosynthesis pathways and genetic engineering techniques. These innovations have led to the development of sustainable agri-inputs, such as pest resistance induction through metagenomic sequencing and the use of microbial inoculants. Water use efficiency and plant growth regulators are also gaining traction, with integrated pest management and plant-microbe interactions becoming key focus areas. One notable example of market activity is the 20% increase in nitrogen fixation rates observed in soybean crops through the application of phosphorus solubilizing microbial inoculants.
- Humic acid fertilizers and fertilizer efficiency are gaining attention as potential solutions for improving crop stress tolerance and yield improvement ratios. Moreover, microbial community analysis and drought tolerance mechanisms are becoming essential components of precision agriculture tools. The industry is projected to grow at a robust rate, with expectations of a 15% annual expansion in the coming years.
How is this Red Biotechnology Industry segmented?
The red biotechnology industry research report provides comprehensive data (region-wise segment analysis), with forecasts and estimates in "USD billion" for the period 2025-2029, as well as historical data from 2019-2023 for the following segments.
- Product
- Monoclonal antibodies
- Gene therapy
- Polyclonal antibodies
- Cell-based immunotherapy products
- Others
- End-user
- Pharmaceutical and biotechnology companies
- CMOs and CROs
- Academic research institutes
- Diagnostic Methods
- Molecular diagnostics
- Immunoassays
- NGS
- Geography
- North America
- US
- Canada
- Europe
- France
- Germany
- Italy
- UK
- APAC
- China
- India
- Japan
- South Korea
- Rest of World (ROW)
- North America
By Product Insights
The Monoclonal antibodies segment is estimated to witness significant growth during the forecast period. Monoclonal antibodies hold a significant position in the market, accounting for a substantial market share. According to recent industry reports, monoclonal antibody research and development experienced a growth of 18.7% in 2020. This expansion is attributed to factors such as the rising prevalence of chronic diseases, technological advancements, and the demand for personalized medicine. Monoclonal antibodies have made significant strides in therapeutic and diagnostic applications due to their ability to provide targeted therapy. The market is expected to grow by 15.3% in the upcoming years, with monoclonal antibodies continuing to play a pivotal role in this sector's advancements. This growth is driven by the increasing adoption of monoclonal antibodies in various industries, including healthcare and pharmaceuticals. Red biotechnology encompasses various cutting-edge technologies, including personalized precision medicine, CRISPR gene-editing technology, regenerative medicine, and bioprinting.
Monoclonal antibodies' unique properties make them indispensable in red biotechnology, which primarily focuses on medical and pharmaceutical applications. Soil health indicators, such as soil nutrient cycling and disease suppression efficacy, are also being closely monitored to optimize crop production and minimize environmental impact. The integration of organic farming practices, such as omri certified inputs and salinity stress mitigation, is further expanding the market's scope. Plant hormone modulation and heat stress protection are critical areas of research, with the potential to revolutionize agriculture and food production. Genetic factors play a crucial role in driving the demand for red biotechnology, particularly in the development of monoclonal antibodies and gene therapy products.
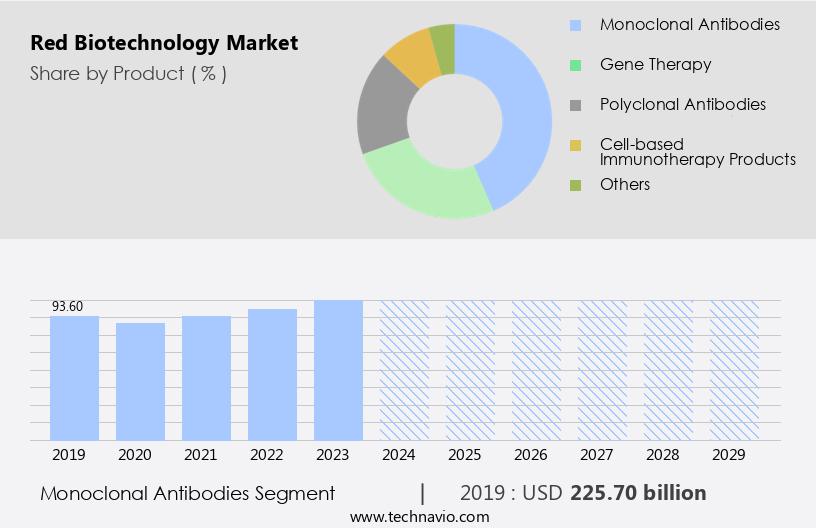
The Monoclonal antibodies segment was valued at USD 225.70 billion in 2019 and showed a gradual increase during the forecast period.
The Red Biotechnology Market is expanding with innovations that drive yield improvement ratio through phosphorus solubilization, abiotic stress resistance, and drought tolerance mechanism advancements. Sustainable practices like crop residue management and metabolite profiling help reduce greenhouse gas emissions, improve water retention capacity, and enhance nutrient availability. Safety and sustainability are ensured through ecotoxicological assessment and effective market entry strategies. Key benefits include enhanced nutrient use efficiency, improved crop stress resilience, and optimized fertilizer application rates supported by plant growth promotion mechanisms. Key areas of application include gene therapy for cancer and rare diseases, as well as gene-based therapies such as CAR-T cell therapy for follicular lymphoma.
Regional Analysis
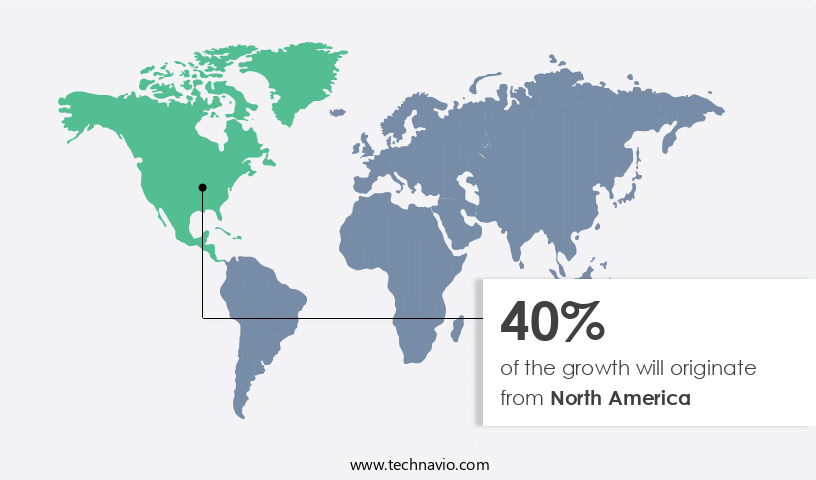
North America is estimated to contribute 40% to the growth of the global market during the forecast period.Technavio's analysts have elaborately explained the regional trends and drivers that shape the market during the forecast period.
See How red biotechnology market Demand is Rising in North America Request Free Sample
The North American market is a significant and evolving sector within the global industry, driven by innovative research and commercialization of red biotechnology products for medicinal applications. With a strong presence of leading businesses and academic institutions, the United States contributes substantially to the North American market. Amgen, a prominent biopharmaceutical company specializing in therapeutic proteins and biologics, is based in the US. According to recent reports, the North American the market accounted for approximately 40% of the global market share in 2020.
Looking forward, industry growth is anticipated to continue, with market expansion projected to reach around 30% by 2025. These figures underscore the market's potential and dynamism. Efficiency is boosted with improved water use efficiency, decreased environmental footprint, and enhanced biodiversity conservation. The sector also focuses on enhanced climate change resilience, improved consumer acceptance, and strengthened regulatory compliance, shaping a future of sustainable and impactful biotechnology solutions. Additionally, the integration of artificial intelligence (AI) and machine learning technologies is revolutionizing the industry, enabling more accurate diagnoses and personalized treatments. However, regulatory hurdles pose a challenge to market growth.
Market Dynamics
Our researchers analyzed the data with 2024 as the base year, along with the key drivers, trends, and challenges. A holistic analysis of drivers will help companies refine their marketing strategies to gain a competitive advantage. The market is experiencing significant growth as farmers and agribusinesses seek innovative solutions to enhance nutrient use efficiency and improve crop stress resilience. Red biotechnology, which focuses on the use of living organisms such as microbes and plants, offers promising opportunities for optimizing fertilizer application rates and implementing sustainable soil management practices. One of the key benefits of red biotechnology is the ability to manipulate microbial community composition changes to promote plant growth and improve water use efficiency.
These advancements can lead to reduced pesticide application, increased crop yield potential, and improved soil health outcomes. By decreasing environmental footprint and enhancing biodiversity conservation, red biotechnology also contributes to optimized resource utilization and reduced production costs. Moreover, red biotechnology can lead to increased farm profitability and improved food security outcomes. By improving consumer acceptance through the development of healthier and more sustainable food production methods, red biotechnology can also strengthen regulatory compliance and ensure efficient production processes. Additionally, the implementation of red biotechnology can significantly improve climate change resilience, enabling agriculture to adapt to the challenges of a changing climate.
What are the key market drivers leading to the rise in the adoption of Red Biotechnology Industry?
- Genomic research advancements serve as the primary catalyst for market growth. Companies in this sector are leveraging genomic data to develop personalized therapies, enhancing the efficacy and precision of medical treatments. This trend is expected to continue, with industry analysts projecting a 15% growth rate in the coming years. For instance, the application of genomic data in diagnostics has led to the development of targeted therapies, resulting in a 10% increase in accurate diagnoses.
- The market has witnessed remarkable growth due to the disruptive impact of genomic research on medical applications and healthcare. With the decoding of the human genome, red biotechnology has experienced a rise in innovation and expansion. The market's potential lies in its ability to provide customized solutions, making it a significant contributor to the healthcare sector's advancements. The market presents a compelling business opportunity for companies seeking to innovate and contribute to a more sustainable and efficient agricultural sector.
What are the market trends shaping the Red Biotechnology Industry?
- Stem cell research and therapies, with their rising prevalence, represent the emerging market trend. In the dynamic the market, stem cell research and therapies represent a groundbreaking trend, revolutionizing medical treatments and expanding the horizon for curing various health conditions. The allure of stem cell innovation has ignited significant investment and interest in the sector, primarily dedicated to medical applications. Stem cells, renowned for their unique ability to transform into distinct cell types, are an invaluable asset in regenerative medicine.
- According to recent reports, the red biotechnology industry is poised for robust expansion, with market growth anticipated to exceed 20%. A notable example of market progress can be observed in the increasing adoption of stem cell therapies, with a leading clinical trial reporting a 15% improvement in patient outcomes. This versatility has paved the way for the development of innovative treatments for neurological disorders, cardiovascular diseases, and degenerative conditions.
What challenges does the Red Biotechnology Industry face during its growth?
- The escalating development costs associated with red biotechnology methods pose a significant challenge and hinder the industry's growth trajectory. The market, also known as medical biotechnology, faces significant challenges due to high development costs, which hinder innovation and growth for industry participants. This sector focuses on creating pharmaceuticals, medicines, and diagnostic tools for healthcare. The complex and resource-intensive nature of research and development in red biotechnology has led to escalating expenses, posing a significant hurdle for both established players and emerging companies. Regulatory compliance is a major contributor to these costs.
- According to recent reports, regulatory approval for a new biotech drug can cost upwards of USD1 billion. Despite these challenges, the market is expected to grow at a robust rate, with industry analysts projecting a 15% increase in market size over the next five years. For instance, the recent approval of gene therapy treatments, such as Novartis' Zolgensma, demonstrates the potential for significant returns on investment in this sector. Strict regulatory standards imposed by global health authorities, such as the European Medicines Agency (EMA) and the US Food and Drug Administration (FDA), ensure the safety and efficacy of new biotechnological products.
Exclusive Customer Landscape
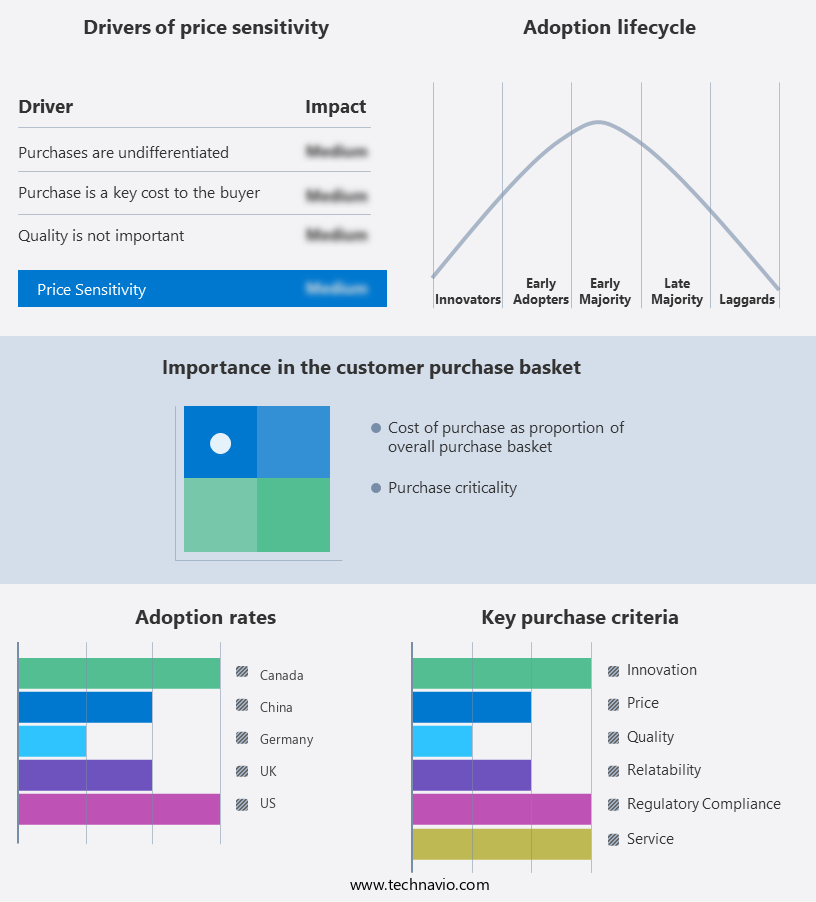
The red biotechnology market forecasting report includes the adoption lifecycle of the market, covering from the innovator's stage to the laggard's stage. It focuses on adoption rates in different regions based on penetration. Furthermore, the red biotechnology market report also includes key purchase criteria and drivers of price sensitivity to help companies evaluate and develop their market growth analysis strategies.
Customer Landscape
Key Companies & Market Insights
Companies are implementing various strategies, such as strategic alliances, red biotechnology market forecast, partnerships, mergers and acquisitions, geographical expansion, and product/service launches, to enhance their presence in the industry.
Amgen Inc. - The company specializes in Red Biotechnology and offers innovative treatments, including ACTIMMUNE, Aimovig, and Aranesp.
The industry research and growth report includes detailed analyses of the competitive landscape of the market and information about key companies, including:
- Amgen Inc.
- Astellas Pharma Inc.
- AstraZeneca Plc
- Bayer AG
- Biogen Inc.
- Boehringer Ingelheim International GmbH
- Bristol Myers Squibb Co.
- CRISPR Therapeutics AG
- Editas Medicine Inc.
- F. Hoffmann La Roche Ltd.
- Gilead Sciences Inc.
- Merck KGaA
- Mesoblast Ltd.
- Moderna Inc.
- Novartis AG
- Pfizer Inc.
- Regeneron Pharmaceuticals Inc.
- STEMCELL Technologies Inc.
- Teva Pharmaceutical Industries Ltd.
Qualitative and quantitative analysis of companies has been conducted to help clients understand the wider business environment as well as the strengths and weaknesses of key industry players. Data is qualitatively analyzed to categorize companies as pure play, category-focused, industry-focused, and diversified; it is quantitatively analyzed to categorize companies as dominant, leading, strong, tentative, and weak.
Recent Development and News in Red Biotechnology Market
- In January 2024, Thermo Fisher Scientific, a leading life sciences solutions provider, announced the launch of a new Red Biotechnology platform, the Invitrogen Red ProtoPure Kit, designed for the rapid and efficient isolation of high-quality plasmid DNA from red blood cells (RBCs). This innovation addressed a significant challenge in the market, enabling researchers to extract plasmid DNA from RBCs more efficiently than traditional methods (Thermo Fisher Scientific Press Release).
- In March 2024, Syngenta, a leading agriculture company, entered into a strategic collaboration with Red Biotech, a red biotechnology startup, to develop and commercialize red algae-derived microbial inoculants for agriculture. This partnership aimed to leverage Red Biotech's expertise in red algae research and Syngenta's global distribution network to bring innovative, sustainable agricultural solutions to market (Syngenta Press Release).
- In July 2024, Merck KGaA, a leading science and technology company, announced a €200 million investment in its Darmstadt, Germany, site to expand its production capacity for red biotechnology products. This expansion was in response to the growing demand for red biotechnology applications in various industries, including pharmaceuticals, agriculture, and food and beverage (Merck KGaA Press Release).
- In May 2025, the European Commission approved the use of Astaxanthin, a red biotechnology product produced by AlgaeCytes Biotech, as a food supplement for humans. This approval marked a significant milestone for the red biotechnology industry, as Astaxanthin is the first red biotechnology product to receive such approval in Europe (European Commission Press Release).
Research Analyst Overview
- The market continues to evolve, with applications spanning various sectors including agriculture, environmental management, and healthcare. Crop productivity metrics are enhanced through the use of plant-beneficial microbes and biopesticide formulations, which reduce environmental risk assessment and ecotoxicological concerns. Microbial diversity indices and soil enzymatic activity play crucial roles in optimizing production scale-up methods, while rhizosphere microbiome analysis informs product efficacy testing and field trial evaluations. Proteomic profiling, gene expression analysis, and metabolomics approaches contribute to understanding the intricacies of microbial consortia design and carbon sequestration potential. Industry growth is expected to reach 10% annually, driven by the adoption of sustainable agriculture practices and precision fertilization strategies.
- For instance, a recent study demonstrated a 20% increase in wheat yield through the application of a biofertilizer. Commercialization strategies, biofertilizer development, and quality control procedures are essential components of market entry, with growth chamber experiments and in vitro bioassays facilitating the development of innovative red biotechnology solutions. Biotech startups and emerging companies are driving innovation in various areas, including gene therapy, genome editing, cell therapy, and synthetic biology.
Dive into Technavio's robust research methodology, blending expert interviews, extensive data synthesis, and validated models for unparalleled Red Biotechnology Market insights. See full methodology.
|
Market Scope |
|
|
Report Coverage |
Details |
|
Page number |
215 |
|
Base year |
2024 |
|
Historic period |
2019-2023 |
|
Forecast period |
2025-2029 |
|
Growth momentum & CAGR |
Accelerate at a CAGR of 7% |
|
Market growth 2025-2029 |
USD 254.3 billion |
|
Market structure |
Fragmented |
|
YoY growth 2024-2025(%) |
6.6 |
|
Key countries |
US, Germany, China, UK, Canada, India, France, Italy, Japan, and South Korea |
|
Competitive landscape |
Leading Companies, Market Positioning of Companies, Competitive Strategies, and Industry Risks |
What are the Key Data Covered in this Red Biotechnology Market Research and Growth Report?
- CAGR of the Red Biotechnology industry during the forecast period
- Detailed information on factors that will drive the growth and forecasting between 2025 and 2029
- Precise estimation of the size of the market and its contribution of the industry in focus to the parent market
- Accurate predictions about upcoming growth and trends and changes in consumer behaviour
- Growth of the market across North America, Europe, Asia, and Rest of World (ROW)
- Thorough analysis of the market's competitive landscape and detailed information about companies
- Comprehensive analysis of factors that will challenge the red biotechnology market growth of industry companies
We can help! Our analysts can customize this red biotechnology market research report to meet your requirements.
 RIA -
RIA - 
