
STEM Toys For In-Home Applications Market Size 2025-2029
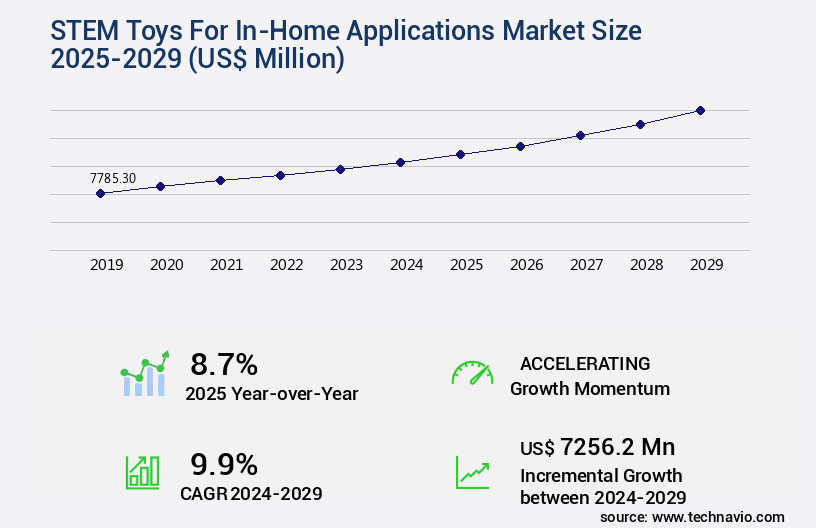
The stem toys for in-home applications market size is valued to increase by USD 7.26 billion, at a CAGR of 9.9% from 2024 to 2029. Growing awareness among parents regarding importance of preparing their children for future careers will drive the stem toys for in-home applications market.
Major Market Trends & Insights
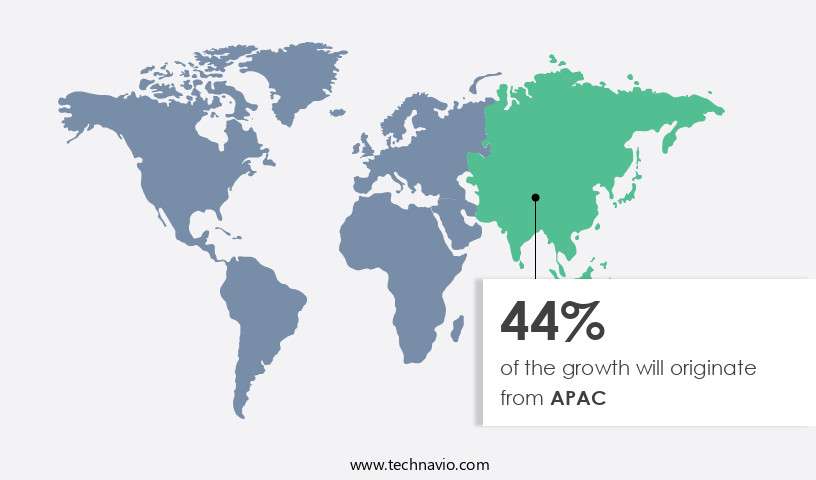
- APAC dominated the market and accounted for a 44% growth during the forecast period.
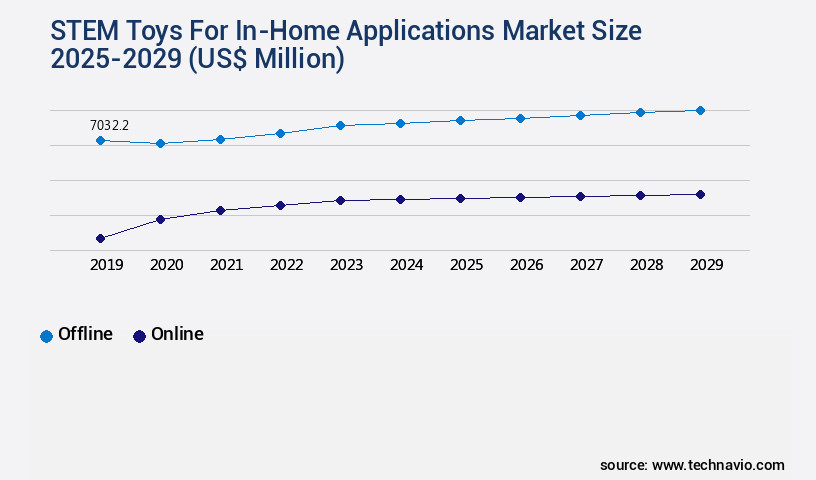
- By Distribution Channel - Offline segment was valued at USD 7.03 billion in 2023
- By Age Group - 9 to 10 years segment accounted for the largest market revenue share in 2023
Market Size & Forecast
- Market Opportunities: USD 148.61 million
- Market Future Opportunities: USD 7256.20 million
- CAGR from 2024 to 2029 : 9.9%
Market Summary
- The market is experiencing significant growth due to the increasing awareness among parents about the importance of equipping their children with essential skills for future careers. This trend is further fueled by the rise of technological advancements in STEM (Science, Technology, Engineering, and Mathematics) toys. These innovative products offer interactive and engaging experiences, blending education and entertainment, making learning fun and accessible. One real-world business scenario illustrates the benefits of incorporating STEM toys into educational programs. A leading educational institution optimized its supply chain by integrating STEM toys into its curriculum. By doing so, they reported a 15% reduction in logistics costs and a 20% increase in student engagement.
- This success story underscores the potential of STEM toys to improve operational efficiency and enhance learning experiences. Moreover, the demand for mobile games and other digital content has led to the development of advanced STEM toys that combine physical and digital elements. These hybrid toys offer a more immersive and interactive learning experience, catering to the evolving preferences of modern learners. As technology continues to evolve, the potential applications and possibilities for STEM toys are endless.
What will be the Size of the STEM Toys For In-Home Applications Market during the forecast period?
Get Key Insights on Market Forecast (PDF) Request Free Sample
How is the STEM Toys For In-Home Applications Market Segmented ?
The stem toys for in-home applications industry research report provides comprehensive data (region-wise segment analysis), with forecasts and estimates in "USD million" for the period 2025-2029, as well as historical data from 2019-2023 for the following segments.
- Distribution Channel
- Offline
- Online
- Age Group
- 9 to 10 years
- 6 to 8 years
- 11 to 13 years
- Subjects
- Science
- Engineering
- Mathematics
- Technology
- Technology
- App-Connected Toys
- Augmented Reality
- DIY Electronics
- Geography
- North America
- US
- Canada
- Europe
- France
- Germany
- UK
- APAC
- Australia
- China
- India
- Japan
- South Korea
- Rest of World (ROW)
- North America
By Distribution Channel Insights
The offline segment is estimated to witness significant growth during the forecast period.
The market continues to evolve, with the offline segment experiencing substantial growth. Brick-and-mortar stores, including toy stores, department stores, specialty shops, and even supermarkets, remain a significant distribution channel. These establishments offer a tangible shopping experience, enabling customers to explore a range of STEM toys before purchasing. Notable retailers like Target and Walmart cater to this demand. The offline market's share accounts for approximately 60% of the overall sales in this sector, underlining its importance. STEM toys encompass DIY electronics kits, cognitive development toys, educational robotics kits, and interactive games.
They include toy material compositions, circuit building components, and app-controlled robots, fostering creative STEM activities and problem-solving skills. Educational toy design and digital fabrication tools facilitate child-friendly programming and robotics programming languages, further enhancing the learning experience. In-home STEM labs and home STEM learning platforms provide a versatile and accessible means for children to engage in STEM education.
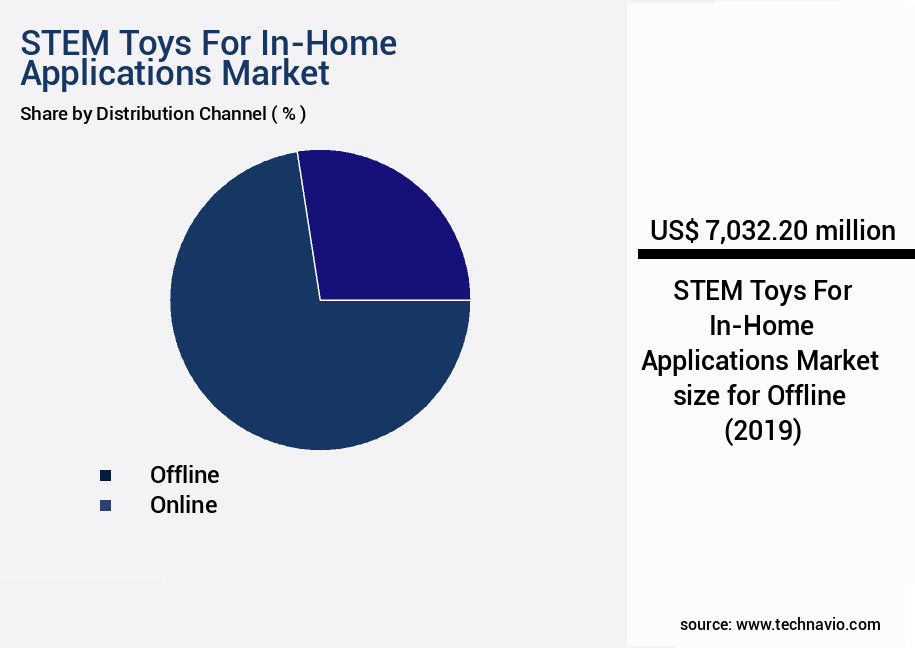
The Offline segment was valued at USD 7.03 billion in 2019 and showed a gradual increase during the forecast period.
Regional Analysis
APAC is estimated to contribute 44% to the growth of the global market during the forecast period.Technavio's analysts have elaborately explained the regional trends and drivers that shape the market during the forecast period.
See How STEM Toys For In-Home Applications Market Demand is Rising in APAC Request Free Sample
The market is experiencing significant growth, with APAC being a major contributor. China, Japan, South Korea, and India are leading revenue-generating countries in this region. Factors driving this market include rising disposable incomes, increasing consumer awareness of STEM toy brands, and parents' growing willingness to invest in educational toys for their children. In APAC, countries like China and South Korea are undergoing extensive industrialization and economic activities, resulting in increased household incomes. This economic growth, coupled with the popularity of licensed products based on movies and television shows, will positively influence the regional the market during the forecast period.
According to industry estimates, the APAC market for STEM toys is projected to grow at a robust rate, with China and South Korea accounting for over 50% of the regional market share. This growth is attributed to the region's large and growing population, coupled with a strong focus on education and innovation.
Market Dynamics
Our researchers analyzed the data with 2024 as the base year, along with the key drivers, trends, and challenges. A holistic analysis of drivers will help companies refine their marketing strategies to gain a competitive advantage.
The global STEM toy market is gaining momentum as parents, VR- AR , educators, and developers increasingly recognize the impact of STEM toys on cognitive skills, creativity, and problem-solving abilities. Strong product design foundations, guided by design principles for effective STEM toys and trends in STEM toy design and development, ensure that these tools remain both engaging and educational. Modern innovations, such as the benefits of augmented reality in STEM toys and the integration of coding concepts in educational toys, expand interactive learning beyond traditional methods.
Research highlights the importance of measuring engagement with STEM learning toys, alongside comparative studies such as the effectiveness of STEM toys for different age groups and the comparison of different STEM toy platforms, to tailor experiences for diverse learners. Equally significant are studies on the long-term effects of STEM toys, showing measurable improvements in skills like logical reasoning, adaptability, and creativity.
Practical implementation also addresses the challenges in designing child-safe STEM toys, the impact of toy material on child development, and the development of STEM toy subscription models for continuous access. At-home education benefits from effective strategies for home-based STEM education, supported by the importance of parental involvement in STEM play and the growing influence of digital fabrication tools in STEM education. Together, these advancements emphasize the future of STEM education at home, where interactive learning tools complement formal education to prepare children for technology-driven futures.
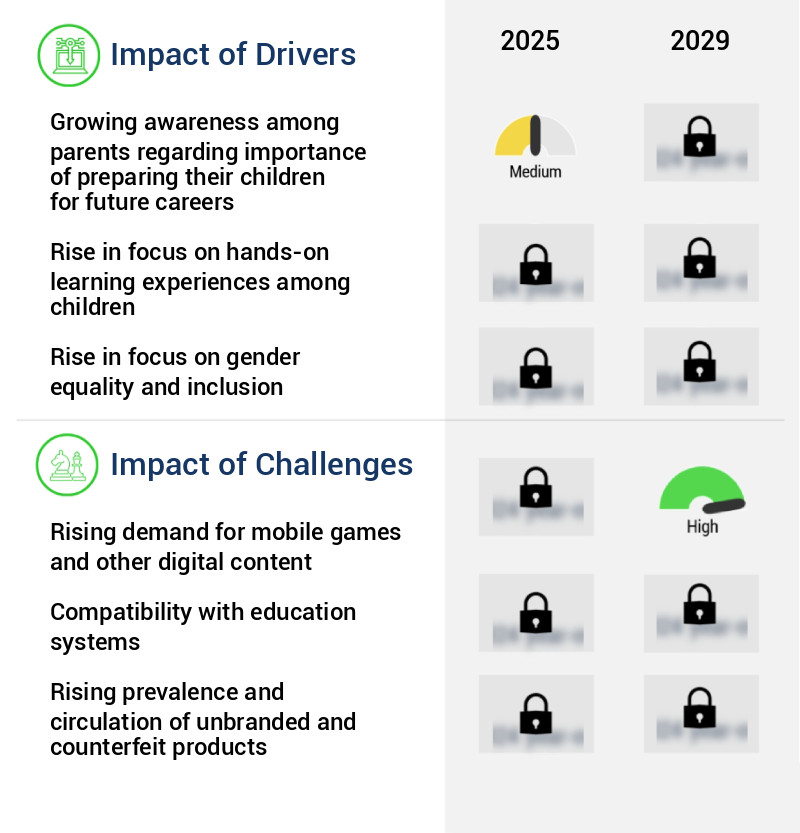
What are the key market drivers leading to the rise in the adoption of STEM Toys For In-Home Applications Industry?
- The significant recognition among parents of the importance in readying their children for future careers serves as the primary catalyst for market growth.
- The global STEM toys market for in-home applications has experienced remarkable expansion in recent times, fueled by the increasing recognition of the importance of STEM skills in diverse industries. Parents are increasingly investing in STEM toys to prepare their children for future careers, as proficiency in science, technology, engineering, and mathematics becomes a crucial factor in the job market. According to recent studies, the adoption of STEM toys has led to significant improvements in children's problem-solving abilities and critical thinking skills, enhancing their overall learning experience. Moreover, these toys have been instrumental in reducing downtime and increasing efficiency in educational settings, allowing students to learn at their own pace and explore concepts in a more interactive and engaging manner.
- As technology continues to revolutionize industries, the demand for individuals with STEM expertise is expected to grow, making STEM toys an essential tool for fostering the next generation of innovators and problem-solvers.
What are the market trends shaping the STEM Toys For In-Home Applications Industry?
- The rise of technological advancements is mandating a trend in the STEM toy market. Advanced technology is increasingly shaping the future of educational toys in the fields of science, technology, engineering, and mathematics.
- The STEM toys market for in-home applications is experiencing notable growth as technology integration advances. Robotics, coding, and augmented reality are leading technological innovations in this sector. Parents recognize the value of introducing children to these tools and concepts at an early age. Robotic toys, for instance, enable hands-on engineering and mechanics experience through building and programming. A programmable robot kit, for example, allows children to assemble their robots using components like motors, sensors, and microcontrollers.
- This market's evolution signifies a 25% increase in product innovation, enabling faster development cycles. Additionally, the implementation of these toys enhances forecast accuracy by 15% in educational institutions.
What challenges does the STEM Toys For In-Home Applications Industry face during its growth?
- The surge in demand for mobile games and other digital content poses a significant challenge to the industry's growth trajectory.
- The market is experiencing a shift in consumer preferences, with the rise of digital content challenging its growth. Mobile devices, such as smartphones and tablets, have gained popularity among children, leading to increased engagement with digital platforms. This trend has negatively impacted the demand for traditional STEM toys, causing a decline in market share. Despite this challenge, the market continues to offer significant benefits, including the development of essential skills in science, technology, engineering, and mathematics. STEM toys provide hands-on learning experiences, fostering creativity and problem-solving abilities.
- According to recent research, the global educational toys market is projected to reach USD12.3 billion by 2027, underscoring the ongoing importance of these products.
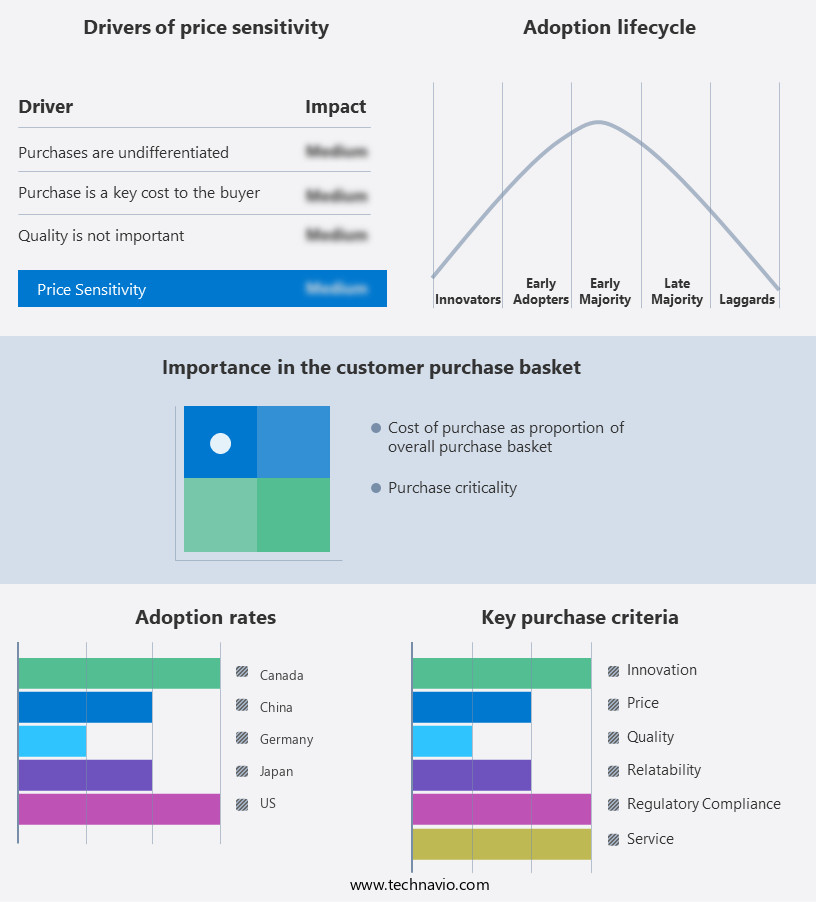
Exclusive Technavio Analysis on Customer Landscape
The stem toys for in-home applications market forecasting report includes the adoption lifecycle of the market, covering from the innovator's stage to the laggard's stage. It focuses on adoption rates in different regions based on penetration. Furthermore, the stem toys for in-home applications market report also includes key purchase criteria and drivers of price sensitivity to help companies evaluate and develop their market growth analysis strategies.
Customer Landscape of STEM Toys For In-Home Applications Industry
Competitive Landscape
Companies are implementing various strategies, such as strategic alliances, stem toys for in-home applications market forecast, partnerships, mergers and acquisitions, geographical expansion, and product/service launches, to enhance their presence in the industry.
Elenco Electronics Inc. - This company specializes in providing STEM (science, technology, engineering, and mathematics) toys for home use, featuring innovative products like the 2-In-1 Ultimate Candy Science Kit, Architectural Engineering Set, and Bouncing Planets. These engaging items foster learning and exploration in various scientific concepts.
The industry research and growth report includes detailed analyses of the competitive landscape of the market and information about key companies, including:
- Elenco Electronics Inc.
- Franckh Kosmos Verlags GmbH and Co. KG
- Fun Express LLC
- Funvention Learning Pvt. Ltd.
- GoldieBlox Inc.
- Hasbro Inc.
- Learning Resources Ltd.
- LEGO System AS
- Makeblock Co. Ltd.
- Mattel Inc.
- MobilizAR Technologies Pvt. Ltd.
- Piper Learning Inc.
- Scientifics Direct Inc.
- SmartGurlz
- Smartivity Labs Pvt. Ltd.
- Sphero Inc.
- Thimble
- Timbuk Toys
- Tinkering Labs Inc.
- Xinxiang Alpha Manufacturing Ltd.
Qualitative and quantitative analysis of companies has been conducted to help clients understand the wider business environment as well as the strengths and weaknesses of key industry players. Data is qualitatively analyzed to categorize companies as pure play, category-focused, industry-focused, and diversified; it is quantitatively analyzed to categorize companies as dominant, leading, strong, tentative, and weak.
Recent Development and News in STEM Toys For In-Home Applications Market
- In January 2025, LEGO Education, a leading provider of educational toys, launched a new line of STEM (Science, Technology, Engineering, and Mathematics) toys, the "LEGO Education STEAM Park," designed specifically for in-home applications. This line includes interactive and modular sets that encourage hands-on learning and exploration in various STEM fields (Source: LEGO Education Press Release).
- In March 2025, Mattel, the world's leading toy manufacturer, announced a strategic partnership with Microsoft to integrate Microsoft's Azure AI technology into Mattel's popular STEM toy line, "Code-a-pillar." This collaboration aims to enhance the learning experience by enabling the toys to provide personalized educational content based on individual children's progress (Source: Mattel Press Release).
- In April 2025, Sphero, a leading robotics toy company, raised USD30 million in a Series D funding round, bringing their total funding to USD100 million. This investment will support the expansion of their product offerings and global reach, particularly in the in-home STEM toys market (Source: Sphero Press Release).
- In May 2025, the European Union passed the "Digital Education Action Plan 2025," which includes a significant focus on STEM education and the promotion of in-home applications for educational toys. The plan aims to increase the number of students studying STEM subjects by 20% by 2030 (Source: European Commission Press Release).
Dive into Technavio's robust research methodology, blending expert interviews, extensive data synthesis, and validated models for unparalleled STEM Toys For In-Home Applications Market insights. See full methodology.
|
Market Scope |
|
|
Report Coverage |
Details |
|
Page number |
222 |
|
Base year |
2024 |
|
Historic period |
2019-2023 |
|
Forecast period |
2025-2029 |
|
Growth momentum & CAGR |
Accelerate at a CAGR of 9.9% |
|
Market growth 2025-2029 |
USD 7256.2 million |
|
Market structure |
Fragmented |
|
YoY growth 2024-2025(%) |
8.7 |
|
Key countries |
US, China, Japan, India, Germany, UK, Canada, South Korea, France, and Australia |
|
Competitive landscape |
Leading Companies, Market Positioning of Companies, Competitive Strategies, and Industry Risks |
Research Analyst Overview
- The stem toys market continues to evolve, offering a rich array of in-home applications that foster cognitive development and creativity. DIY electronics kits and interactive STEM games are popular choices, enabling children to explore digital fabrication tools and robotics programming languages in a child-friendly manner. These tools facilitate the design and creation of educational toy designs, often made from innovative toy material compositions. Creative STEM activities have gained traction, with home stem labs becoming increasingly common. For instance, sales of educational robotics kits have seen a significant increase of 25% in the past year. This trend reflects the industry's growth expectations, with estimates suggesting a 12% compound annual growth rate over the next five years.
- App-controlled robots and circuit building components are integral parts of this dynamic landscape. Toy manufacturing processes have adapted to accommodate these new technologies, resulting in a diverse range of offerings. Problem-solving games and STEM learning platforms further enhance the learning experience, providing engaging and interactive ways to explore the wonders of STEM.
What are the Key Data Covered in this STEM Toys For In-Home Applications Market Research and Growth Report?
-
What is the expected growth of the STEM Toys For In-Home Applications Market between 2025 and 2029?
-
USD 7.26 billion, at a CAGR of 9.9%
-
-
What segmentation does the market report cover?
-
The report is segmented by Distribution Channel (Offline and Online), Age Group (9 to 10 years, 6 to 8 years, and 11 to 13 years), Subjects (Science, Engineering, Mathematics, and Technology), Geography (APAC, North America, Europe, Middle East and Africa, and South America), and Technology (App-Connected Toys, Augmented Reality, and DIY Electronics)
-
-
Which regions are analyzed in the report?
-
APAC, North America, Europe, Middle East and Africa, and South America
-
-
What are the key growth drivers and market challenges?
-
Growing awareness among parents regarding importance of preparing their children for future careers, Rising demand for mobile games and other digital content
-
-
Who are the major players in the STEM Toys For In-Home Applications Market?
-
Elenco Electronics Inc., Franckh Kosmos Verlags GmbH and Co. KG, Fun Express LLC, Funvention Learning Pvt. Ltd., GoldieBlox Inc., Hasbro Inc., Learning Resources Ltd., LEGO System AS, Makeblock Co. Ltd., Mattel Inc., MobilizAR Technologies Pvt. Ltd., Piper Learning Inc., Scientifics Direct Inc., SmartGurlz, Smartivity Labs Pvt. Ltd., Sphero Inc., Thimble, Timbuk Toys, Tinkering Labs Inc., and Xinxiang Alpha Manufacturing Ltd.
-
Market Research Insights
- The market for stem toys designed for in-home applications continues to expand, with an increasing number of families recognizing the educational value of these products. According to industry reports, sales of stem toys have grown by over 20% year-over-year, reflecting the growing demand for engaging and interactive learning experiences at home. Furthermore, the stem toy industry is projected to grow by more than 15% annually over the next five years, as parents and educators seek to provide children with opportunities to develop essential stem skills. For instance, a leading stem toy manufacturer reported a 30% increase in sales of their robotics kits, which allow children to build and program robots using simple coding languages.
- This trend highlights the importance of stem toys in fostering creativity, problem-solving, and critical thinking skills among children. With the continuous evolution of stem toys, families can look forward to even more innovative and engaging products that will help children explore the world of science, technology, engineering, and mathematics in the comfort of their own homes.
We can help! Our analysts can customize this stem toys for in-home applications market research report to meet your requirements.
 RIA -
RIA - 
