Secondary Packaging Market Analysis, Size, and Forecast 2026-2030: North America (US, Canada, and Mexico), Europe (Germany, UK, and France), APAC (China, Japan, and India), South America (Brazil, Argentina, and Colombia), Middle East and Africa (Saudi Arabia, UAE, and South Africa), and Rest of World (ROW)

Secondary Packaging Market Analysis, Size, and Forecast 2026-2030:
North America (US, Canada, and Mexico), Europe (Germany, UK, and France), APAC (China, Japan, and India), South America (Brazil, Argentina, and Colombia), Middle East and Africa (Saudi Arabia, UAE, and South Africa), and Rest of World (ROW)

Published: Mar 2026 312 Pages SKU: IRTNTR75363

Market Overview at a Glance

$91.4 B
Market Opportunity
4.5%
CAGR 2025 - 2030
32.2%
North America Growth
$230.4 B
Paper segment 2024

Secondary Packaging Market Size 2026-2030
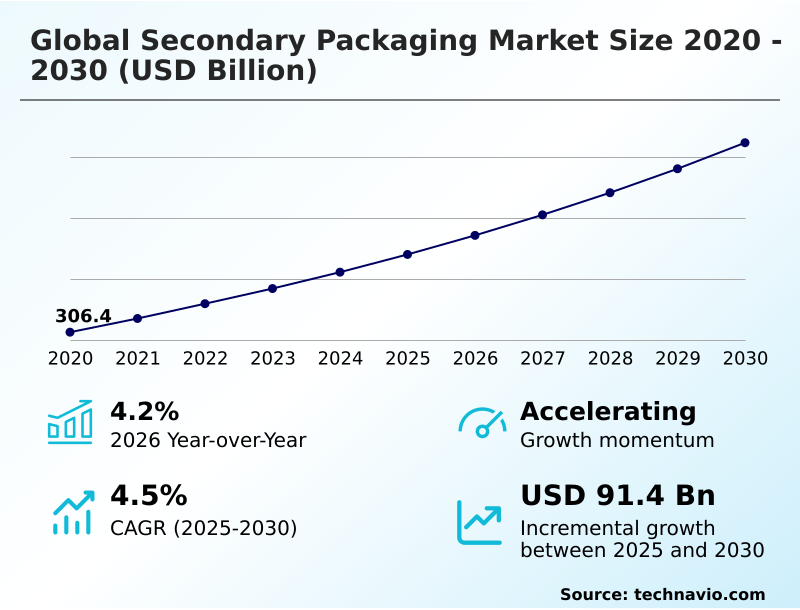
The secondary packaging market size is valued to increase by USD 91.4 billion, at a CAGR of 4.5% from 2025 to 2030. Rapid e-commerce growth increasing demand for protective transport packaging solutions will drive the secondary packaging market.

Major Market Trends & Insights

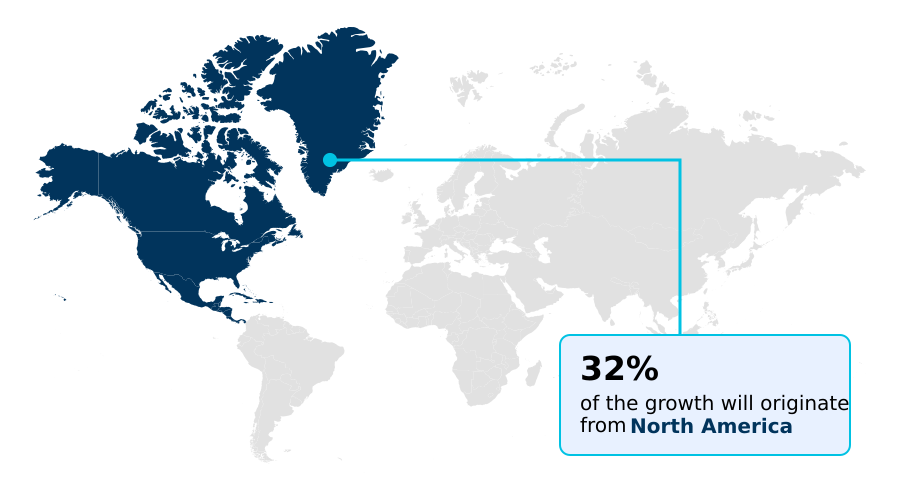
  • North America dominated the market and accounted for a 32.2% growth during the forecast period.
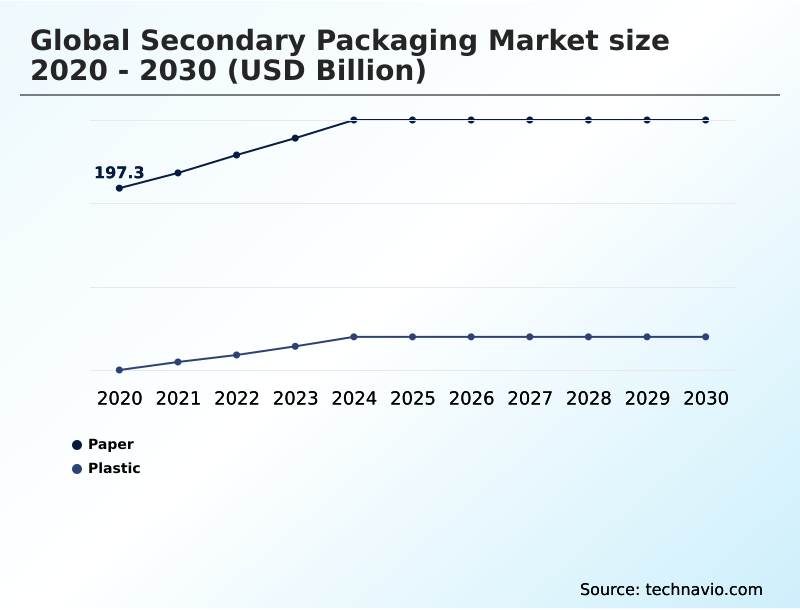
  • By Type - Paper segment was valued at USD 230.4 billion in 2024
  • By Application - Food segment accounted for the largest market revenue share in 2024

Market Size & Forecast

  • Market Opportunities: USD 155 billion
  • Market Future Opportunities: USD 91.4 billion
  • CAGR from 2025 to 2030 : 4.5%

Market Summary

  • The secondary packaging market is undergoing a significant transformation, driven by the dual pressures of e-commerce expansion and sustainability mandates. This sector, essential for grouping, protecting, and transporting goods, is moving beyond basic containment to become a strategic component of the supply chain.
  • The proliferation of online retail necessitates robust e-commerce packaging solutions, including custom-fit corrugated containers and protective packaging solutions, to withstand the rigors of last-mile delivery. Concurrently, a market-wide shift toward sustainable secondary packaging is evident, with companies increasingly adopting paper-based alternatives and embracing circular economy principles.
  • A key business scenario involves food distributors leveraging specialized food-grade secondary packaging with integrated smart packaging technologies to monitor temperature-sensitive products, ensuring compliance and reducing spoilage. This digitalization enhances supply chain transparency and palletization efficiency. However, the industry grapples with volatile raw material costs, which challenges the profitability of producing even standard paperboard cartons and corrugated trays.

What will be the Size of the Secondary Packaging Market during the forecast period?

Get Key Insights on Market Forecast (PDF) Request Free Sample

How is the Secondary Packaging Market Segmented?

The secondary packaging industry research report provides comprehensive data (region-wise segment analysis), with forecasts and estimates in "USD billion" for the period 2026-2030, as well as historical data from 2020-2024 for the following segments.

  • Type
    • Paper
    • Plastic
  • Application
    • Food
    • Beverages
    • Pharmaceuticals
    • Personal and home care
    • Others
  • Product
    • Folding cartons
    • Corrugated boxes
    • Plastic crates and totes
    • Others
  • Geography
    • North America
      • US
      • Canada
      • Mexico
    • Europe
      • Germany
      • UK
      • France
    • APAC
      • China
      • Japan
      • India
    • South America
      • Brazil
      • Argentina
      • Colombia
    • Middle East and Africa
      • Saudi Arabia
      • UAE
      • South Africa
    • Rest of World (ROW)

By Type Insights

The paper segment is estimated to witness significant growth during the forecast period.

The secondary packaging market is segmented by material, with paper-based alternatives leading due to their alignment with sustainability goals.

This segment, encompassing paperboard cartons, folding cartons, and corrugated trays, is driven by demand for sustainable secondary packaging and adherence to circular economy principles.

Innovations in lightweighting and material optimization enhance the structural integrity of protective packaging solutions without compromising performance. For instance, paper now accounts for over 63% of the material mix in bulk secondary packaging.

Advanced techniques like digital printing on corrugated materials are improving the unboxing experience, while engineered designs for multipack carton solutions boost palletization efficiency in high-volume supply chains, making paper a versatile choice across industries.

Request Free Sample

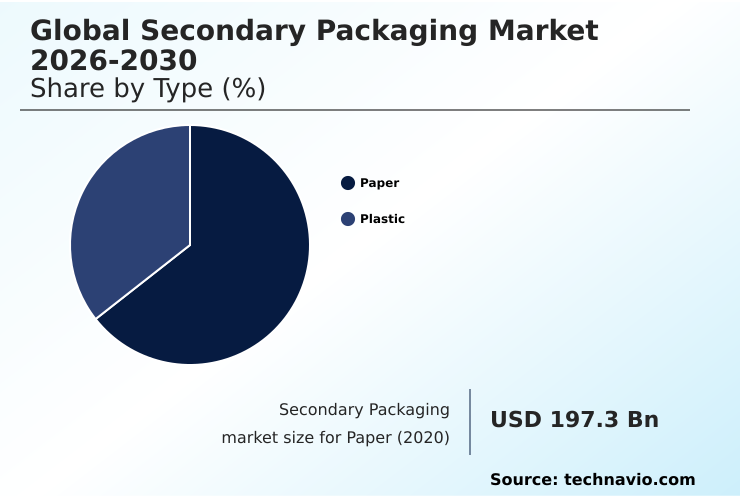
The Paper segment was valued at USD 230.4 billion in 2024 and showed a gradual increase during the forecast period.

Request Free Sample

Regional Analysis

North America is estimated to contribute 32.2% to the growth of the global market during the forecast period.Technavio’s analysts have elaborately explained the regional trends and drivers that shape the market during the forecast period.

See How Secondary Packaging Market Demand is Rising in North America Request Free Sample

The geographic landscape of the secondary packaging market is characterized by varied maturity and growth dynamics. North America accounts for the largest share of incremental growth, approximately 32.2%, driven by a sophisticated e-commerce infrastructure and high adoption of automated systems.

In contrast, APAC is the fastest-growing region, with a projected CAGR of 5.3%, fueled by rapid industrialization and modernization of retail supply chains in countries like China and India.

Europe distinguishes itself with stringent environmental regulations, promoting innovation in returnable transit packaging and returnable transit systems. Across all regions, the demand for effective multipack carton solutions continues to expand, tailored to local consumer habits and retail environments.

Market Dynamics

Our researchers analyzed the data with 2025 as the base year, along with the key drivers, trends, and challenges. A holistic analysis of drivers will help companies refine their marketing strategies to gain a competitive advantage.

  • A detailed cost-benefit analysis of automated secondary packaging lines reveals significant long-term savings despite high initial capital outlay, with firms reporting improvements in throughput that can double manual output rates. The impact of e-commerce on secondary packaging demand is undeniable, forcing a re-evaluation of material strength and design to handle individual parcel shipping.
  • This leads to a crucial debate on corrugated vs plastic secondary packaging for beverages, where corrugated materials are gaining favor for their recyclability, though plastics still offer superior moisture resistance for multipack carton solutions. Concurrently, stringent secondary packaging regulations for pharmaceutical shipments are driving innovation in temperature-controlled and tamper-evident designs, making compliance a primary design factor.
  • The market for sustainable secondary packaging materials for food products is expanding rapidly, with a focus on non-toxic, compostable options. Furthermore, the role of smart packaging in supply chain visibility is becoming central to logistics strategy, providing real-time data that reduces loss and improves inventory management.
  • Evolving best practices for retail-ready packaging design and new trends in folding cartons for the cosmetics industry highlight a growing emphasis on packaging as a tool for both operational efficiency and brand marketing.

What are the key market drivers leading to the rise in the adoption of Secondary Packaging Industry?
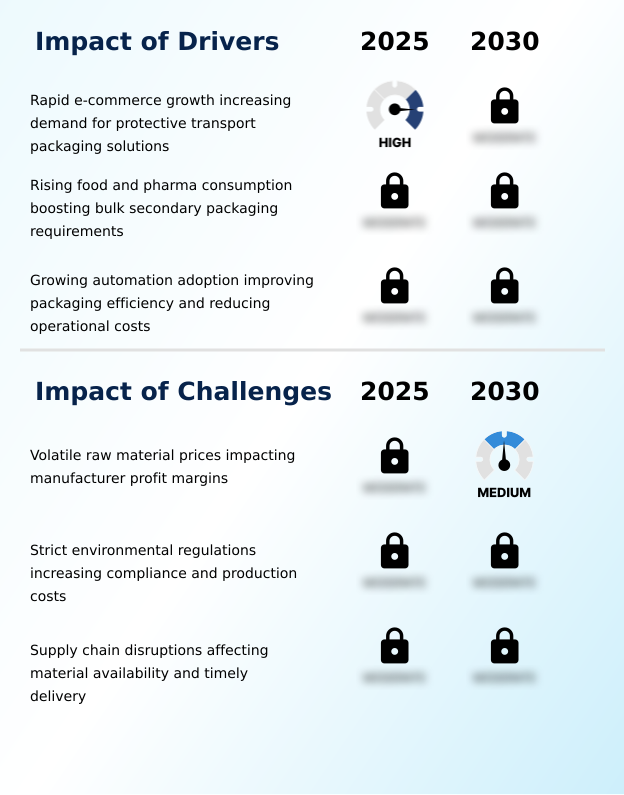
  • Rapid e-commerce growth is a key market driver, significantly increasing the demand for protective and efficient transport packaging solutions.

  • Market growth is significantly driven by e-commerce and automation. The surge in online retail has created an immense need for robust e-commerce packaging solutions, with some logistics networks requiring a 30% increase in material strength.
  • In response, manufacturers are adopting automated end-of-line processes. The deployment of automated packaging lines, including automated case erectors, robotic palletizers, and high-speed shrink wrappers, has become a strategic necessity, with over 65% of major CPG firms now using such systems.
  • This automation improves throughput and ensures consistent load stability. In parallel, rising consumption in food and pharmaceuticals boosts demand for specialized food-grade secondary packaging featuring high-compression strength liners to protect goods throughout complex supply chains.

What are the market trends shaping the Secondary Packaging Industry?

  • A growing adoption of sustainable and recyclable secondary packaging materials marks a key trend, reflecting an industry-wide shift toward greater environmental responsibility.

  • Key market trends are centered on sustainability and digitalization. The adoption of smart packaging technologies is enhancing supply chain transparency and improving inventory accuracy. Integrating sensors allows firms to reduce stock losses by over 25% through real-time location and condition monitoring.
  • Customization is also critical, with a surge in demand for custom-fit corrugated containers and high-quality retail-ready packaging that enhances branding. This strategic use of transport packaging as a marketing tool is reshaping retail visibility.
  • Furthermore, the use of bio-based adhesives and tamper-evident features aligns with both environmental mandates and the need for heightened security, particularly for high-value goods requiring strong anti-counterfeiting measures.

What challenges does the Secondary Packaging Industry face during its growth?

  • Volatile raw material prices present a key challenge for the industry, directly impacting manufacturer profit margins and strategic planning.

  • The industry faces persistent challenges from volatile raw material prices and supply chain disruptions, which can increase lead times by up to 40% for essential materials like corrugated fiberboard solutions. Strict environmental regulations add another layer of complexity, increasing compliance overhead by an average of 15% and affecting the cost-effectiveness of transit packaging systems.
  • These pressures impact everything from industrial transport packaging to specialized pharmaceutical cold chain packaging. In response, some firms are optimizing warehouse management and exploring closed-loop systems with reusable plastic crates and totes. However, the availability of inputs for products like shrink sleeves and moisture-resistant coatings remains a critical operational risk.

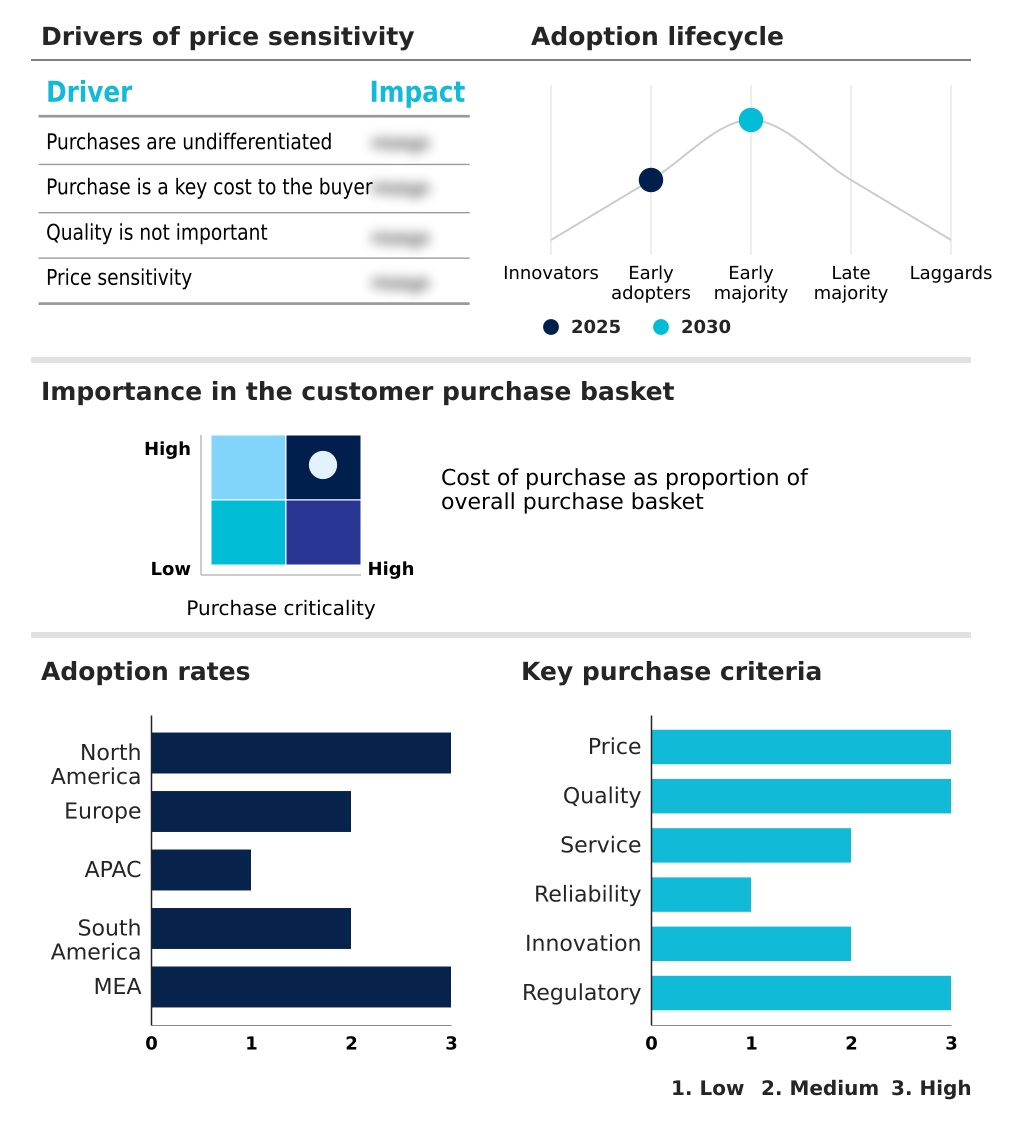
Exclusive Technavio Analysis on Customer Landscape

The secondary packaging market forecasting report includes the adoption lifecycle of the market, covering from the innovator’s stage to the laggard’s stage. It focuses on adoption rates in different regions based on penetration. Furthermore, the secondary packaging market report also includes key purchase criteria and drivers of price sensitivity to help companies evaluate and develop their market growth analysis strategies.

Customer Landscape of Secondary Packaging Industry

Competitive Landscape

Companies are implementing various strategies, such as strategic alliances, secondary packaging market forecast, partnerships, mergers and acquisitions, geographical expansion, and product/service launches, to enhance their presence in the industry.

Amcor Plc - Key offerings include integrated secondary packaging, such as corrugated cartons and shrink film bundling solutions, to enhance supply chain protection and efficiency.

The industry research and growth report includes detailed analyses of the competitive landscape of the market and information about key companies, including:

  • Amcor Plc
  • Ball Corp.
  • Crown Holdings Inc.
  • Daio Paper Corp.
  • DS Smith Plc
  • Graphic Packaging Holding Co.
  • Huhtamaki Oyj
  • International Paper Co.
  • Mondi Plc
  • Packaging Corp. of America
  • Rengo Co. Ltd.
  • Salzgitter AG
  • Sealed Air Corp.
  • Smurfit Kappa Group
  • Sonoco Products Co.
  • Stora Enso Oyj
  • Tetra Laval SA

Qualitative and quantitative analysis of companies has been conducted to help clients understand the wider business environment as well as the strengths and weaknesses of key industry players. Data is qualitatively analyzed to categorize companies as pure play, category-focused, industry-focused, and diversified; it is quantitatively analyzed to categorize companies as dominant, leading, strong, tentative, and weak.

Recent Development and News in Secondary packaging market

  • In January, 2025, CorruPack Industries announced a new line of high-strength corrugated materials specifically engineered for same-day delivery networks, addressing the need for enhanced damage prevention during rapid transit.
  • In February, 2025, ThermoSafe Logistics launched a series of high-performance secondary shippers with advanced thermal insulation and reinforced structural layers, designed for the global distribution of temperature-sensitive medications.
  • In March, 2025, Automated Packaging Systems Inc. formed a strategic partnership with a leading consumer goods corporation to deploy fully automated secondary packaging lines across its manufacturing facilities, aiming to improve throughput and handle diverse product assortments.
  • In April, 2025, Smurfit Kappa Group released a sustainability progress report confirming record-high demand for its plastic-free secondary packaging solutions, particularly from the beverage and electronics sectors striving to meet zero-waste targets.

Dive into Technavio’s robust research methodology, blending expert interviews, extensive data synthesis, and validated models for unparalleled Secondary Packaging Market insights. See full methodology.

Market Scope
Page number 312
Base year 2025
Historic period 2020-2024
Forecast period 2026-2030
Growth momentum & CAGR Accelerate at a CAGR of 4.5%
Market growth 2026-2030 USD 91.4 billion
Market structure Fragmented
YoY growth 2025-2026(%) 4.2%
Key countries US, Canada, Mexico, Germany, UK, France, Italy, Spain, The Netherlands, China, Japan, India, South Korea, Australia, Indonesia, Brazil, Argentina, Colombia, Saudi Arabia, UAE, South Africa, Israel and Turkey
Competitive landscape Leading Companies, Market Positioning of Companies, Competitive Strategies, and Industry Risks

Request Free Sample

Research Analyst Overview

  • The secondary packaging market is defined by a strategic convergence of automation and material science. The deployment of automated packaging lines, including automated case erectors and robotic palletizers, has become critical for operational efficiency, with over 65% of major consumer goods firms having already upgraded their automated end-of-line processes.
  • This investment directly impacts boardroom decisions on capital expenditure and labor allocation. The demand for robust transport packaging, from corrugated fiberboard solutions to protective packaging solutions, is intensifying. Innovations in lightweighting are reshaping transit packaging systems, while the versatility of paper-based alternatives like folding cartons and paperboard cartons supports sustainability goals.
  • We see high demand for both single-use corrugated trays and reusable options like plastic crates and totes and returnable transit packaging. Specialized items such as shrink sleeves, multipack carton solutions, and materials with moisture-resistant coatings or tamper-evident features are gaining traction.
  • The adoption of bio-based adhesives and high-compression strength liners further underscores the focus on enhancing structural integrity in shelf-ready containers and retail-ready packaging.

What are the Key Data Covered in this Secondary Packaging Market Research and Growth Report?

  • What is the expected growth of the Secondary Packaging Market between 2026 and 2030?

    • USD 91.4 billion, at a CAGR of 4.5%

  • What segmentation does the market report cover?

    • The report is segmented by Type (Paper, and Plastic), Application (Food, Beverages, Pharmaceuticals, Personal and home care, and Others), Product (Folding cartons, Corrugated boxes, Plastic crates and totes, and Others) and Geography (North America, Europe, APAC, South America, Middle East and Africa)

  • Which regions are analyzed in the report?

    • North America, Europe, APAC, South America and Middle East and Africa

  • What are the key growth drivers and market challenges?

    • Rapid e-commerce growth increasing demand for protective transport packaging solutions, Volatile raw material prices impacting manufacturer profit margins

  • Who are the major players in the Secondary Packaging Market?

    • Amcor Plc, Ball Corp., Crown Holdings Inc., Daio Paper Corp., DS Smith Plc, Graphic Packaging Holding Co., Huhtamaki Oyj, International Paper Co., Mondi Plc, Packaging Corp. of America, Rengo Co. Ltd., Salzgitter AG, Sealed Air Corp., Smurfit Kappa Group, Sonoco Products Co., Stora Enso Oyj and Tetra Laval SA

Market Research Insights

  • Market dynamics are increasingly shaped by the need for efficiency and sustainability. The adoption of smart packaging technologies enables firms to reduce stock losses by over 25% through enhanced supply chain transparency and improved inventory accuracy.
  • Concurrently, the demands of e-commerce are driving material innovation, with logistics networks requiring a 30% increase in the strength of corrugated materials for rapid transit. This has accelerated the deployment of automated end-of-line processes and specialized e-commerce packaging solutions.
  • As companies seek greater material optimization, the focus on sustainable secondary packaging and circular economy principles is intensifying, influencing both product design and warehouse management strategies.

We can help! Our analysts can customize this secondary packaging market research report to meet your requirements.

Get in touch

1. Executive Summary

1.1 Market overview

Executive Summary - Chart on Market Overview
Executive Summary - Data Table on Market Overview
Executive Summary - Chart on Global Market Characteristics
Executive Summary - Chart on Market by Geography
Executive Summary - Chart on Market Segmentation by Type
Executive Summary - Chart on Market Segmentation by Application
Executive Summary - Chart on Market Segmentation by Product
Executive Summary - Chart on Incremental Growth
Executive Summary - Data Table on Incremental Growth
Executive Summary - Chart on Company Market Positioning

2. Technavio Analysis

2.1 Analysis of price sensitivity, lifecycle, customer purchase basket, adoption rates, and purchase criteria

2.2 Criticality of inputs and Factors of differentiation

Chart on Overview on criticality of inputs and factors of differentiation

2.3 Factors of disruption

Chart on Overview on factors of disruption

2.4 Impact of drivers and challenges

Chart on Impact of drivers and challenges in 2025 and 2030

3. Market Landscape

3.1 Market ecosystem

Chart on Parent Market
Data Table on - Parent Market

3.2 Market characteristics

Chart on Market characteristics analysis

3.3 Value chain analysis

Chart on Value chain analysis

4. Market Sizing

4.1 Market definition

Data Table on Offerings of companies included in the market definition

4.2 Market segment analysis

Market segments

4.3 Market size 2025

4.4 Market outlook: Forecast for 2025-2030

Chart on Global - Market size and forecast 2025-2030 ($ billion)
Data Table on Global - Market size and forecast 2025-2030 ($ billion)
Chart on Global Market: Year-over-year growth 2025-2030 (%)
Data Table on Global Market: Year-over-year growth 2025-2030 (%)

5. Historic Market Size

5.1 Global Secondary Packaging Market 2020 - 2024

Historic Market Size - Data Table on Global Secondary Packaging Market 2020 - 2024 ($ billion)

5.2 Type segment analysis 2020 - 2024

Historic Market Size - Type Segment 2020 - 2024 ($ billion)

5.3 Application segment analysis 2020 - 2024

Historic Market Size - Application Segment 2020 - 2024 ($ billion)

5.4 Product segment analysis 2020 - 2024

Historic Market Size - Product Segment 2020 - 2024 ($ billion)

5.5 Geography segment analysis 2020 - 2024

Historic Market Size - Geography Segment 2020 - 2024 ($ billion)

5.6 Country segment analysis 2020 - 2024

Historic Market Size - Country Segment 2020 - 2024 ($ billion)

6. Qualitative Analysis

6.1 Impact of AI on Global Secondary Packaging Market

7. Five Forces Analysis

7.1 Five forces summary

Five forces analysis - Comparison between 2025 and 2030

7.2 Bargaining power of buyers

Bargaining power of buyers - Impact of key factors 2025 and 2030

7.3 Bargaining power of suppliers

Bargaining power of suppliers - Impact of key factors in 2025 and 2030

7.4 Threat of new entrants

Threat of new entrants - Impact of key factors in 2025 and 2030

7.5 Threat of substitutes

Threat of substitutes - Impact of key factors in 2025 and 2030

7.6 Threat of rivalry

Threat of rivalry - Impact of key factors in 2025 and 2030

7.7 Market condition

Chart on Market condition - Five forces 2025 and 2030

8. Market Segmentation by Type

8.1 Market segments

Chart on Type - Market share 2025-2030 (%)
Data Table on Type - Market share 2025-2030 (%)

8.2 Comparison by Type

Chart on Comparison by Type
Data Table on Comparison by Type

8.3 Paper - Market size and forecast 2025-2030

Chart on Paper - Market size and forecast 2025-2030 ($ billion)
Data Table on Paper - Market size and forecast 2025-2030 ($ billion)
Chart on Paper - Year-over-year growth 2025-2030 (%)
Data Table on Paper - Year-over-year growth 2025-2030 (%)

8.4 Plastic - Market size and forecast 2025-2030

Chart on Plastic - Market size and forecast 2025-2030 ($ billion)
Data Table on Plastic - Market size and forecast 2025-2030 ($ billion)
Chart on Plastic - Year-over-year growth 2025-2030 (%)
Data Table on Plastic - Year-over-year growth 2025-2030 (%)

8.5 Market opportunity by Type

Market opportunity by Type ($ billion)
Data Table on Market opportunity by Type ($ billion)

9. Market Segmentation by Application

9.1 Market segments

Chart on Application - Market share 2025-2030 (%)
Data Table on Application - Market share 2025-2030 (%)

9.2 Comparison by Application

Chart on Comparison by Application
Data Table on Comparison by Application

9.3 Food - Market size and forecast 2025-2030

Chart on Food - Market size and forecast 2025-2030 ($ billion)
Data Table on Food - Market size and forecast 2025-2030 ($ billion)
Chart on Food - Year-over-year growth 2025-2030 (%)
Data Table on Food - Year-over-year growth 2025-2030 (%)

9.4 Beverages - Market size and forecast 2025-2030

Chart on Beverages - Market size and forecast 2025-2030 ($ billion)
Data Table on Beverages - Market size and forecast 2025-2030 ($ billion)
Chart on Beverages - Year-over-year growth 2025-2030 (%)
Data Table on Beverages - Year-over-year growth 2025-2030 (%)

9.5 Pharmaceuticals - Market size and forecast 2025-2030

Chart on Pharmaceuticals - Market size and forecast 2025-2030 ($ billion)
Data Table on Pharmaceuticals - Market size and forecast 2025-2030 ($ billion)
Chart on Pharmaceuticals - Year-over-year growth 2025-2030 (%)
Data Table on Pharmaceuticals - Year-over-year growth 2025-2030 (%)

9.6 Personal and home care - Market size and forecast 2025-2030

Chart on Personal and home care - Market size and forecast 2025-2030 ($ billion)
Data Table on Personal and home care - Market size and forecast 2025-2030 ($ billion)
Chart on Personal and home care - Year-over-year growth 2025-2030 (%)
Data Table on Personal and home care - Year-over-year growth 2025-2030 (%)

9.7 Others - Market size and forecast 2025-2030

Chart on Others - Market size and forecast 2025-2030 ($ billion)
Data Table on Others - Market size and forecast 2025-2030 ($ billion)
Chart on Others - Year-over-year growth 2025-2030 (%)
Data Table on Others - Year-over-year growth 2025-2030 (%)

9.8 Market opportunity by Application

Market opportunity by Application ($ billion)
Data Table on Market opportunity by Application ($ billion)

10. Market Segmentation by Product

10.1 Market segments

Chart on Product - Market share 2025-2030 (%)
Data Table on Product - Market share 2025-2030 (%)

10.2 Comparison by Product

Chart on Comparison by Product
Data Table on Comparison by Product

10.3 Folding cartons - Market size and forecast 2025-2030

Chart on Folding cartons - Market size and forecast 2025-2030 ($ billion)
Data Table on Folding cartons - Market size and forecast 2025-2030 ($ billion)
Chart on Folding cartons - Year-over-year growth 2025-2030 (%)
Data Table on Folding cartons - Year-over-year growth 2025-2030 (%)

10.4 Corrugated boxes - Market size and forecast 2025-2030

Chart on Corrugated boxes - Market size and forecast 2025-2030 ($ billion)
Data Table on Corrugated boxes - Market size and forecast 2025-2030 ($ billion)
Chart on Corrugated boxes - Year-over-year growth 2025-2030 (%)
Data Table on Corrugated boxes - Year-over-year growth 2025-2030 (%)

10.5 Plastic crates and totes - Market size and forecast 2025-2030

Chart on Plastic crates and totes - Market size and forecast 2025-2030 ($ billion)
Data Table on Plastic crates and totes - Market size and forecast 2025-2030 ($ billion)
Chart on Plastic crates and totes - Year-over-year growth 2025-2030 (%)
Data Table on Plastic crates and totes - Year-over-year growth 2025-2030 (%)

10.6 Others - Market size and forecast 2025-2030

Chart on Others - Market size and forecast 2025-2030 ($ billion)
Data Table on Others - Market size and forecast 2025-2030 ($ billion)
Chart on Others - Year-over-year growth 2025-2030 (%)
Data Table on Others - Year-over-year growth 2025-2030 (%)

10.7 Market opportunity by Product

Market opportunity by Product ($ billion)
Data Table on Market opportunity by Product ($ billion)

11. Customer Landscape

11.1 Customer landscape overview

Analysis of price sensitivity, lifecycle, customer purchase basket, adoption rates, and purchase criteria

12. Geographic Landscape

12.1 Geographic segmentation

Chart on Market share by geography 2025-2030 (%)
Data Table on Market share by geography 2025-2030 (%)

12.2 Geographic comparison

Chart on Geographic comparison
Data Table on Geographic comparison

12.3 North America - Market size and forecast 2025-2030

Chart on North America - Market size and forecast 2025-2030 ($ billion)
Data Table on North America - Market size and forecast 2025-2030 ($ billion)
Chart on North America - Year-over-year growth 2025-2030 (%)
Data Table on North America - Year-over-year growth 2025-2030 (%)
Chart on Regional Comparison - North America
Data Table on Regional Comparison - North America

12.3.1 US - Market size and forecast 2025-2030

Chart on US - Market size and forecast 2025-2030 ($ billion)
Data Table on US - Market size and forecast 2025-2030 ($ billion)
Chart on US - Year-over-year growth 2025-2030 (%)
Data Table on US - Year-over-year growth 2025-2030 (%)

12.3.2 Canada - Market size and forecast 2025-2030

Chart on Canada - Market size and forecast 2025-2030 ($ billion)
Data Table on Canada - Market size and forecast 2025-2030 ($ billion)
Chart on Canada - Year-over-year growth 2025-2030 (%)
Data Table on Canada - Year-over-year growth 2025-2030 (%)

12.3.3 Mexico - Market size and forecast 2025-2030

Chart on Mexico - Market size and forecast 2025-2030 ($ billion)
Data Table on Mexico - Market size and forecast 2025-2030 ($ billion)
Chart on Mexico - Year-over-year growth 2025-2030 (%)
Data Table on Mexico - Year-over-year growth 2025-2030 (%)

12.4 Europe - Market size and forecast 2025-2030

Chart on Europe - Market size and forecast 2025-2030 ($ billion)
Data Table on Europe - Market size and forecast 2025-2030 ($ billion)
Chart on Europe - Year-over-year growth 2025-2030 (%)
Data Table on Europe - Year-over-year growth 2025-2030 (%)
Chart on Regional Comparison - Europe
Data Table on Regional Comparison - Europe

12.4.1 Germany - Market size and forecast 2025-2030

Chart on Germany - Market size and forecast 2025-2030 ($ billion)
Data Table on Germany - Market size and forecast 2025-2030 ($ billion)
Chart on Germany - Year-over-year growth 2025-2030 (%)
Data Table on Germany - Year-over-year growth 2025-2030 (%)

12.4.2 UK - Market size and forecast 2025-2030

Chart on UK - Market size and forecast 2025-2030 ($ billion)
Data Table on UK - Market size and forecast 2025-2030 ($ billion)
Chart on UK - Year-over-year growth 2025-2030 (%)
Data Table on UK - Year-over-year growth 2025-2030 (%)

12.4.3 France - Market size and forecast 2025-2030

Chart on France - Market size and forecast 2025-2030 ($ billion)
Data Table on France - Market size and forecast 2025-2030 ($ billion)
Chart on France - Year-over-year growth 2025-2030 (%)
Data Table on France - Year-over-year growth 2025-2030 (%)

12.4.4 Italy - Market size and forecast 2025-2030

Chart on Italy - Market size and forecast 2025-2030 ($ billion)
Data Table on Italy - Market size and forecast 2025-2030 ($ billion)
Chart on Italy - Year-over-year growth 2025-2030 (%)
Data Table on Italy - Year-over-year growth 2025-2030 (%)

12.4.5 Spain - Market size and forecast 2025-2030

Chart on Spain - Market size and forecast 2025-2030 ($ billion)
Data Table on Spain - Market size and forecast 2025-2030 ($ billion)
Chart on Spain - Year-over-year growth 2025-2030 (%)
Data Table on Spain - Year-over-year growth 2025-2030 (%)

12.4.6 The Netherlands - Market size and forecast 2025-2030

Chart on The Netherlands - Market size and forecast 2025-2030 ($ billion)
Data Table on The Netherlands - Market size and forecast 2025-2030 ($ billion)
Chart on The Netherlands - Year-over-year growth 2025-2030 (%)
Data Table on The Netherlands - Year-over-year growth 2025-2030 (%)

12.5 APAC - Market size and forecast 2025-2030

Chart on APAC - Market size and forecast 2025-2030 ($ billion)
Data Table on APAC - Market size and forecast 2025-2030 ($ billion)
Chart on APAC - Year-over-year growth 2025-2030 (%)
Data Table on APAC - Year-over-year growth 2025-2030 (%)
Chart on Regional Comparison - APAC
Data Table on Regional Comparison - APAC

12.5.1 China - Market size and forecast 2025-2030

Chart on China - Market size and forecast 2025-2030 ($ billion)
Data Table on China - Market size and forecast 2025-2030 ($ billion)
Chart on China - Year-over-year growth 2025-2030 (%)
Data Table on China - Year-over-year growth 2025-2030 (%)

12.5.2 Japan - Market size and forecast 2025-2030

Chart on Japan - Market size and forecast 2025-2030 ($ billion)
Data Table on Japan - Market size and forecast 2025-2030 ($ billion)
Chart on Japan - Year-over-year growth 2025-2030 (%)
Data Table on Japan - Year-over-year growth 2025-2030 (%)

12.5.3 India - Market size and forecast 2025-2030

Chart on India - Market size and forecast 2025-2030 ($ billion)
Data Table on India - Market size and forecast 2025-2030 ($ billion)
Chart on India - Year-over-year growth 2025-2030 (%)
Data Table on India - Year-over-year growth 2025-2030 (%)

12.5.4 South Korea - Market size and forecast 2025-2030

Chart on South Korea - Market size and forecast 2025-2030 ($ billion)
Data Table on South Korea - Market size and forecast 2025-2030 ($ billion)
Chart on South Korea - Year-over-year growth 2025-2030 (%)
Data Table on South Korea - Year-over-year growth 2025-2030 (%)

12.5.5 Australia - Market size and forecast 2025-2030

Chart on Australia - Market size and forecast 2025-2030 ($ billion)
Data Table on Australia - Market size and forecast 2025-2030 ($ billion)
Chart on Australia - Year-over-year growth 2025-2030 (%)
Data Table on Australia - Year-over-year growth 2025-2030 (%)

12.5.6 Indonesia - Market size and forecast 2025-2030

Chart on Indonesia - Market size and forecast 2025-2030 ($ billion)
Data Table on Indonesia - Market size and forecast 2025-2030 ($ billion)
Chart on Indonesia - Year-over-year growth 2025-2030 (%)
Data Table on Indonesia - Year-over-year growth 2025-2030 (%)

12.6 South America - Market size and forecast 2025-2030

Chart on South America - Market size and forecast 2025-2030 ($ billion)
Data Table on South America - Market size and forecast 2025-2030 ($ billion)
Chart on South America - Year-over-year growth 2025-2030 (%)
Data Table on South America - Year-over-year growth 2025-2030 (%)
Chart on Regional Comparison - South America
Data Table on Regional Comparison - South America

12.6.1 Brazil - Market size and forecast 2025-2030

Chart on Brazil - Market size and forecast 2025-2030 ($ billion)
Data Table on Brazil - Market size and forecast 2025-2030 ($ billion)
Chart on Brazil - Year-over-year growth 2025-2030 (%)
Data Table on Brazil - Year-over-year growth 2025-2030 (%)

12.6.2 Argentina - Market size and forecast 2025-2030

Chart on Argentina - Market size and forecast 2025-2030 ($ billion)
Data Table on Argentina - Market size and forecast 2025-2030 ($ billion)
Chart on Argentina - Year-over-year growth 2025-2030 (%)
Data Table on Argentina - Year-over-year growth 2025-2030 (%)

12.6.3 Colombia - Market size and forecast 2025-2030

Chart on Colombia - Market size and forecast 2025-2030 ($ billion)
Data Table on Colombia - Market size and forecast 2025-2030 ($ billion)
Chart on Colombia - Year-over-year growth 2025-2030 (%)
Data Table on Colombia - Year-over-year growth 2025-2030 (%)

12.7 Middle East and Africa - Market size and forecast 2025-2030

Chart on Middle East and Africa - Market size and forecast 2025-2030 ($ billion)
Data Table on Middle East and Africa - Market size and forecast 2025-2030 ($ billion)
Chart on Middle East and Africa - Year-over-year growth 2025-2030 (%)
Data Table on Middle East and Africa - Year-over-year growth 2025-2030 (%)
Chart on Regional Comparison - Middle East and Africa
Data Table on Regional Comparison - Middle East and Africa

12.7.1 Saudi Arabia - Market size and forecast 2025-2030

Chart on Saudi Arabia - Market size and forecast 2025-2030 ($ billion)
Data Table on Saudi Arabia - Market size and forecast 2025-2030 ($ billion)
Chart on Saudi Arabia - Year-over-year growth 2025-2030 (%)
Data Table on Saudi Arabia - Year-over-year growth 2025-2030 (%)

12.7.2 UAE - Market size and forecast 2025-2030

Chart on UAE - Market size and forecast 2025-2030 ($ billion)
Data Table on UAE - Market size and forecast 2025-2030 ($ billion)
Chart on UAE - Year-over-year growth 2025-2030 (%)
Data Table on UAE - Year-over-year growth 2025-2030 (%)

12.7.3 South Africa - Market size and forecast 2025-2030

Chart on South Africa - Market size and forecast 2025-2030 ($ billion)
Data Table on South Africa - Market size and forecast 2025-2030 ($ billion)
Chart on South Africa - Year-over-year growth 2025-2030 (%)
Data Table on South Africa - Year-over-year growth 2025-2030 (%)

12.7.4 Israel - Market size and forecast 2025-2030

Chart on Israel - Market size and forecast 2025-2030 ($ billion)
Data Table on Israel - Market size and forecast 2025-2030 ($ billion)
Chart on Israel - Year-over-year growth 2025-2030 (%)
Data Table on Israel - Year-over-year growth 2025-2030 (%)

12.7.5 Turkey - Market size and forecast 2025-2030

Chart on Turkey - Market size and forecast 2025-2030 ($ billion)
Data Table on Turkey - Market size and forecast 2025-2030 ($ billion)
Chart on Turkey - Year-over-year growth 2025-2030 (%)
Data Table on Turkey - Year-over-year growth 2025-2030 (%)

12.8 Market opportunity by geography

Market opportunity by geography ($ billion)
Data Tables on Market opportunity by geography ($ billion)

13. Drivers, Challenges, and Opportunity

13.1 Market drivers

Rapid e-commerce growth increasing demand for protective transport packaging solutions
Rising food and pharma consumption boosting bulk secondary packaging requirements
Growing automation adoption improving packaging efficiency and reducing operational costs

13.2 Market challenges

Volatile raw material prices impacting manufacturer profit margins
Strict environmental regulations increasing compliance and production costs
Supply chain disruptions affecting material availability and timely delivery

13.3 Impact of drivers and challenges

Impact of drivers and challenges in 2025 and 2030

13.4 Market opportunities

Growing adoption of sustainable and recyclable secondary packaging materials
Rising integration of smart packaging technologies for tracking and traceability
Increasing customization enhancing branding and retail shelf visibility

14. Competitive Landscape

14.1 Overview

14.2

Overview on criticality of inputs and factors of differentiation

14.3 Landscape disruption

Overview on factors of disruption

14.4 Industry risks

Impact of key risks on business

15. Competitive Analysis

15.1 Companies profiled

Companies covered

15.2 Company ranking index

15.3 Market positioning of companies

Matrix on companies position and classification

15.4 Amcor Plc

Amcor Plc - Overview
Amcor Plc - Business segments
Amcor Plc - Key news
Amcor Plc - Key offerings
Amcor Plc - Segment focus
SWOT

15.5 Ball Corp.

Ball Corp. - Overview
Ball Corp. - Business segments
Ball Corp. - Key offerings
Ball Corp. - Segment focus
SWOT

15.6 Crown Holdings Inc.

Crown Holdings Inc. - Overview
Crown Holdings Inc. - Business segments
Crown Holdings Inc. - Key offerings
Crown Holdings Inc. - Segment focus
SWOT

15.7 Daio Paper Corp.

Daio Paper Corp. - Overview
Daio Paper Corp. - Business segments
Daio Paper Corp. - Key offerings
Daio Paper Corp. - Segment focus
SWOT

15.8 DS Smith Plc

DS Smith Plc - Overview
DS Smith Plc - Business segments
DS Smith Plc - Key news
DS Smith Plc - Key offerings
DS Smith Plc - Segment focus
SWOT

15.9 Graphic Packaging Holding Co.

Graphic Packaging Holding Co. - Overview
Graphic Packaging Holding Co. - Business segments
Graphic Packaging Holding Co. - Key news
Graphic Packaging Holding Co. - Key offerings
Graphic Packaging Holding Co. - Segment focus
SWOT

15.10 Huhtamaki Oyj

Huhtamaki Oyj - Overview
Huhtamaki Oyj - Business segments
Huhtamaki Oyj - Key news
Huhtamaki Oyj - Key offerings
Huhtamaki Oyj - Segment focus
SWOT

15.11 International Paper Co.

International Paper Co. - Overview
International Paper Co. - Business segments
International Paper Co. - Key news
International Paper Co. - Key offerings
International Paper Co. - Segment focus
SWOT

15.12 Mondi Plc

Mondi Plc - Overview
Mondi Plc - Business segments
Mondi Plc - Key news
Mondi Plc - Key offerings
Mondi Plc - Segment focus
SWOT

15.13 Packaging Corp. of America

Packaging Corp. of America - Overview
Packaging Corp. of America - Business segments
Packaging Corp. of America - Key offerings
Packaging Corp. of America - Segment focus
SWOT

15.14 Rengo Co. Ltd.

Rengo Co. Ltd. - Overview
Rengo Co. Ltd. - Business segments
Rengo Co. Ltd. - Key offerings
Rengo Co. Ltd. - Segment focus
SWOT

15.15 Salzgitter AG

Salzgitter AG - Overview
Salzgitter AG - Business segments
Salzgitter AG - Key offerings
Salzgitter AG - Segment focus
SWOT

15.16 Sealed Air Corp.

Sealed Air Corp. - Overview
Sealed Air Corp. - Business segments
Sealed Air Corp. - Key news
Sealed Air Corp. - Key offerings
Sealed Air Corp. - Segment focus
SWOT

15.17 Smurfit Kappa Group

Smurfit Kappa Group - Overview
Smurfit Kappa Group - Business segments
Smurfit Kappa Group - Key news
Smurfit Kappa Group - Key offerings
Smurfit Kappa Group - Segment focus
SWOT

15.18 Sonoco Products Co.

Sonoco Products Co. - Overview
Sonoco Products Co. - Business segments
Sonoco Products Co. - Key news
Sonoco Products Co. - Key offerings
Sonoco Products Co. - Segment focus
SWOT

16. Appendix

16.1 Scope of the report

Market definition
Objectives
Notes and caveats

16.2 Inclusions and exclusions checklist

Inclusions checklist
Exclusions checklist

16.3 Currency conversion rates for US$

16.4 Research methodology

16.5 Data procurement

Information sources

16.6 Data validation

16.7 Validation techniques employed for market sizing

16.8 Data synthesis

16.9 360 degree market analysis

16.10 List of abbreviations

Research Methodology

Technavio presents a detailed picture of the market by way of study, synthesis, and summation of data from multiple sources. The analysts have presented the various facets of the market with a particular focus on identifying the key industry influencers. The data thus presented is comprehensive, reliable, and the result of extensive research, both primary and secondary.

INFORMATION SOURCES

Primary sources

  • Manufacturers and suppliers
  • Channel partners
  • Industry experts
  • Strategic decision makers

Secondary sources

  • Industry journals and periodicals
  • Government data
  • Financial reports of key industry players
  • Historical data
  • Press releases

DATA ANALYSIS

Data Synthesis

  • Collation of data
  • Estimation of key figures
  • Analysis of derived insights

Data Validation

  • Triangulation with data models
  • Reference against proprietary databases
  • Corroboration with industry experts

REPORT WRITING

Qualitative

  • Market drivers
  • Market challenges
  • Market trends
  • Five forces analysis

Quantitative

  • Market size and forecast
  • Market segmentation
  • Geographical insights
  • Competitive landscape

Interested in this report?

Get your sample now to see our research methodology and insights!

Download Now

Frequently Asked Questions

Secondary Packaging market growth will increase by USD 91.4 billion during 2026-2030.

The Secondary Packaging market is expected to grow at a CAGR of 4.5% during 2026-2030.

Secondary Packaging market is segmented by Type (Paper, Plastic) Application (Food, Beverages, Pharmaceuticals, Personal and home care, Others) Product (Folding cartons, Corrugated boxes, Plastic crates and totes, Others)

Amcor Plc, Ball Corp., Crown Holdings Inc., Daio Paper Corp., DS Smith Plc, Graphic Packaging Holding Co., Huhtamaki Oyj, International Paper Co., Mondi Plc, Packaging Corp. of America, Rengo Co. Ltd., Salzgitter AG, Sealed Air Corp., Smurfit Kappa Group, Sonoco Products Co., Stora Enso Oyj, Tetra Laval SA are a few of the key vendors in the Secondary Packaging market.

North America will register the highest growth rate of 32.2% among the other regions. Therefore, the Secondary Packaging market in North America is expected to garner significant business opportunities for the vendors during the forecast period.

US, Canada, Mexico, Germany, UK, France, Italy, Spain, The Netherlands, China, Japan, India, South Korea, Australia, Indonesia, Brazil, Argentina, Colombia, Saudi Arabia, UAE, South Africa, Israel, Turkey

  • Rapid e-commerce growth increasing demand for protective transport packaging solutions is the driving factor this market.

The Secondary Packaging market vendors should focus on grabbing business opportunities from the Type segment as it accounted for the largest market share in the base year.