US Sedimentation And Centrifugation Market Size 2025-2029
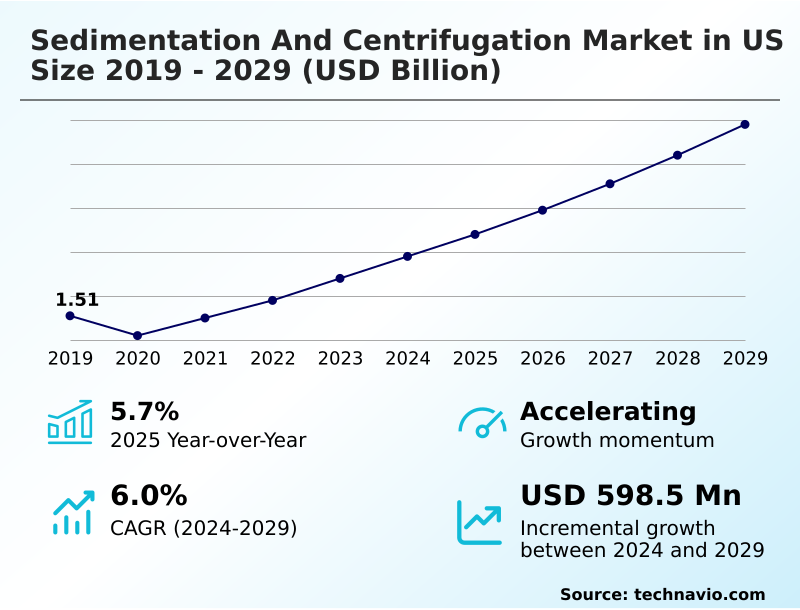
The us sedimentation and centrifugation market size is valued to increase by USD 598.5 million, at a CAGR of 6% from 2024 to 2029. Stringent environmental regulations and water management imperatives will drive the us sedimentation and centrifugation market.
Major Market Trends & Insights
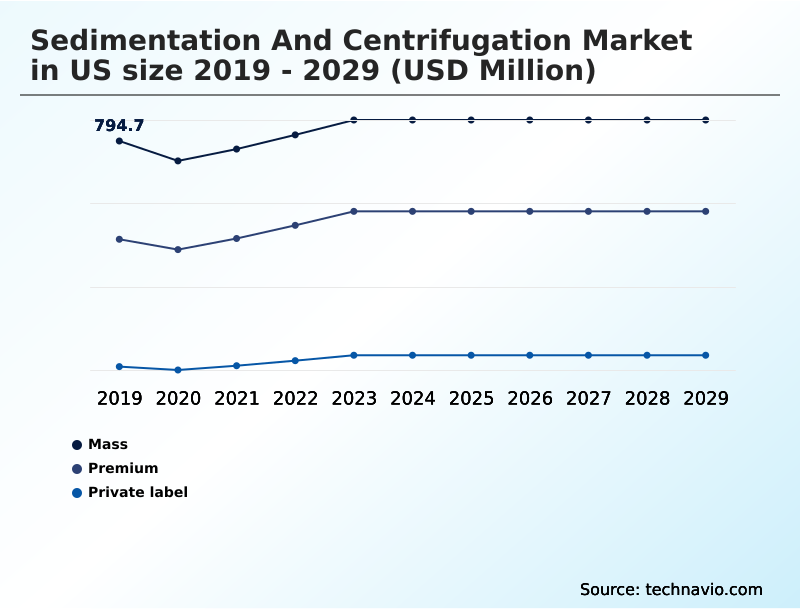
- By Product Type - Mass segment was valued at USD 851.2 million in 2023
- By Type - Clarifiers segment accounted for the largest market revenue share in 2023
Market Size & Forecast
- Market Opportunities: USD 862.3 million
- Market Future Opportunities: USD 598.5 million
- CAGR from 2024 to 2029 : 6%
Market Summary
- The sedimentation and centrifugation market in us is propelled by a confluence of stringent regulatory frameworks and technological advancements across key end-use sectors. The expansion of biopharmaceutical manufacturing creates a substantial demand for high-performance centrifugal force systems essential for processes like cell harvesting centrifuge operations and protein purification.
- Concurrently, environmental mandates compel investments in advanced sludge dewatering and wastewater clarification technologies to minimize waste volume and recover valuable resources, a core part of biosolids management.
- For instance, a food processing facility can leverage a three-phase separation system not only to treat its industrial effluent treatment but also to recover valuable byproducts, turning a compliance cost into a revenue stream. This dynamic is further shaped by the need to modernize aging infrastructure, where technologies like the lamella clarifier offer enhanced efficiency.
- The market is also navigating challenges from alternative technologies like the membrane bioreactor and the high capital investment required for premium equipment, pushing vendors toward innovation in process intensification and operational efficiency to maintain a competitive edge.
What will be the Size of the US Sedimentation And Centrifugation Market during the forecast period?
Get Key Insights on Market Forecast (PDF) Get Free Sample
How is the US Sedimentation And Centrifugation Market Segmented?
The us sedimentation and centrifugation industry research report provides comprehensive data (region-wise segment analysis), with forecasts and estimates in "USD million" for the period 2025-2029, as well as historical data from 2019-2023 for the following segments.
- Product type
- Mass
- Premium
- Private label
- Type
- Clarifiers
- Decanter
- Disk centrifuge
- Dissolved air flotation system
- Hydrocyclone
- End-user
- Food and beverages
- Pharmaceuticals
- Chemicals
- Power
- Others
- Deployment
- Sedimentation
- Centrifugation
- Technology
- Solid-liquid separation
- Liquid-liquid separation
- Liquid-solid-solid separation
- Geography
- North America
- US
- North America
By Product Type Insights
The mass segment is estimated to witness significant growth during the forecast period.
The mass segment represents the largest portion of the market, defined by standardized and cost-effective equipment designed for a wide range of conventional applications. The technology in this segment is mature, focusing on reliable performance and durability.
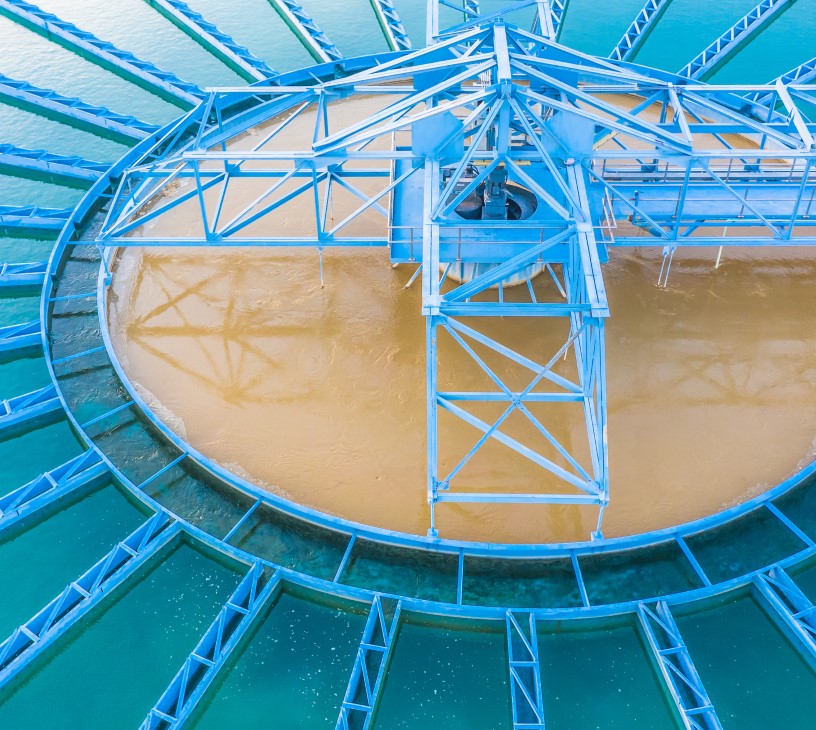
Products include conventional clarifiers, workhorse decanter centrifuge models, and hydrocyclone classifier units. The primary end-users are municipal water treatment facilities and the mining industry, where purchasing criteria prioritize long-term reliability and competitive capital cost.
Technology for solid-liquid separation and gravity settling is built to handle high flow rates and abrasive materials consistently. These systems for suspended solids removal ensure effective dewatering and thickening, where proper solids classification can improve downstream process efficiency by 15%.
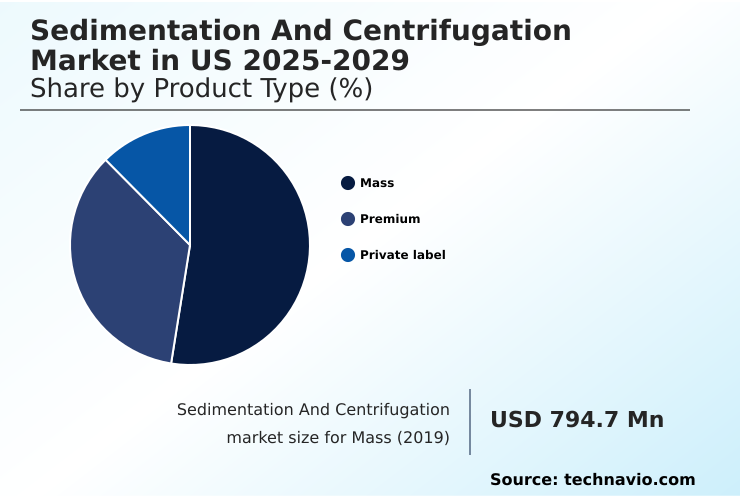
The Mass segment was valued at USD 851.2 million in 2023 and showed a gradual increase during the forecast period.
Market Dynamics
Our researchers analyzed the data with 2024 as the base year, along with the key drivers, trends, and challenges. A holistic analysis of drivers will help companies refine their marketing strategies to gain a competitive advantage.
- Strategic decision-making in the sedimentation and centrifugation market in us increasingly centers on total cost of ownership rather than initial capital outlay. For example, optimizing centrifuge differential speed through advanced automation can lead to significant energy savings and improved separation efficiency.
- The debate over centrifugation vs membrane filtration efficiency is critical in municipal wastewater, where plant footprint and effluent quality requirements dictate technology choice. While a decanter centrifuge for sludge dewatering remains a standard for reducing sludge volume with centrifuges, the adoption of a single-use centrifuge for cell therapy is transforming biomanufacturing by eliminating cross-contamination risks.
- The choice of a hydrocyclone for mineral classification versus other methods depends on the specific demands of the process. For high-purity applications, a gmp centrifuge for active pharmaceutical ingredients is non-negotiable. Effective maintenance of industrial decanter centrifuges is proven to extend equipment life, reducing lifecycle costs by more than 15% compared to reactive repair schedules.
- As industries adopt centrifuge automation and remote monitoring, the focus shifts to predictive analytics for solid-liquid separation process optimization. This is crucial when managing coal ash with dewatering centrifuges or using dissolved air flotation for oil removal.
- Furthermore, the growth of the bioeconomy is creating new opportunities for centrifugal technology for bioeconomy applications, especially in centrifugal separation in food processing and the centrifugal separation of immiscible liquids. The high-g-force decanter centrifuge performance is pivotal in applications requiring fine particle removal, while the use of a tricanter for the three-phase separation for edible oils showcases the technology's versatility.
- Clarifier design for wastewater treatment and other sedimentation equipment for water purification continue to be foundational.
What are the key market drivers leading to the rise in the adoption of US Sedimentation And Centrifugation Industry?
- A primary driver for the market is the comprehensive and consistently enforced framework of environmental regulations and water management imperatives.
- Robust growth within key end-use industries is a powerful catalyst for the market, particularly for high-performance equipment. The biopharmaceutical sector drives immense demand for sophisticated centrifugal force solutions like the disk stack separator for cell harvesting centrifuge processes.
- These applications, central to biopharmaceutical manufacturing, demand equipment meeting the highest gmp-compliant separation standards. The adoption of single-use centrifugation reduces cross-contamination risks and increases manufacturing flexibility, cutting cleaning validation times by half.
- Similarly, the food industry's expansion in plant-based proteins and the bioeconomy's focus on renewable fuels create new frontiers for the tricanter and other separation technologies essential for downstream processing and achieving high product yields, including through liquid-liquid extraction.
What are the market trends shaping the US Sedimentation And Centrifugation Industry?
- A transformative trend is reshaping the market through the deep integration of automation and digitalization. This shift, often called Industry 4.0, moves beyond basic equipment operation toward intelligent systems.
- A transformative trend is the deep integration of automation and digitalization, enabling intelligent systems that provide real-time data for process intensification. Modern centrifuges and clarifiers use advanced sensors to monitor effluent turbidity and sludge blanket level, facilitating a shift from reactive to predictive maintenance that can reduce unplanned downtime by over 30%.
- This connectivity allows for remote control, optimizing sludge dewatering and yeast separation processes. Advanced algorithms automate functions like adjusting the differential speed of a decanter centrifuge, which can lower energy consumption by up to 15%.
- This focus on efficiency is critical in applications from pulp cleaning to edible oil refining, ensuring equipment operates at peak performance while minimizing operational costs through better solids control system management and dewatering.
What challenges does the US Sedimentation And Centrifugation Industry face during its growth?
- A formidable challenge confronting the market is the substantial capital investment required for new equipment and the protracted procurement cycles.
- While sedimentation and centrifugation are established technologies, a significant challenge arises from the increasing adoption of alternatives. Membrane bioreactor systems, for example, can eliminate the need for secondary clarifiers in wastewater clarification, offering a smaller footprint. In sludge dewatering, decanter centrifuges face competition from screw presses, which have gained popularity in smaller facilities.
- In bioprocessing, tangential flow filtration presents an alternative to centrifugation for cell harvesting, particularly for sensitive cells. Furthermore, a shortage of skilled labor capable of operating and maintaining sophisticated equipment for biosolids management and mineral processing creates a knowledge gap.
- This can lead to suboptimal performance and a 10% increase in energy consumption due to inefficient operation of equipment used for managing coal combustion residuals or drilling mud solids control.
Exclusive Technavio Analysis on Customer Landscape
The us sedimentation and centrifugation market forecasting report includes the adoption lifecycle of the market, covering from the innovator’s stage to the laggard’s stage. It focuses on adoption rates in different regions based on penetration. Furthermore, the us sedimentation and centrifugation market report also includes key purchase criteria and drivers of price sensitivity to help companies evaluate and develop their market growth analysis strategies.

Customer Landscape of US Sedimentation And Centrifugation Industry
Competitive Landscape
Companies are implementing various strategies, such as strategic alliances, us sedimentation and centrifugation market forecast, partnerships, mergers and acquisitions, geographical expansion, and product/service launches, to enhance their presence in the industry.
Alfa Laval AB - The company provides specialized sedimentation and centrifugation systems, such as advanced i-Dec decanter centrifuges engineered for continuous sludge dewatering in various treatment applications.
The industry research and growth report includes detailed analyses of the competitive landscape of the market and information about key companies, including:
- Alfa Laval AB
- Andritz AG
- Bazell Technologies
- Beckman Coulter, Inc.
- Birtley Industrial Equipment Corp.
- Centrisys
- Derrick Corp.
- Elgin Power and Separation Solutions
- Flottweg SE
- Franzenburg Centrifuge
- GEA Group AG
- GN Solids America
- McLanahan Corp.
- SIEBTECHNIK GmbH
- Thermo Fisher Scientific Inc.
- Thomas Broadbent and Sons Ltd.
- Tomoe Engineering USA, Inc.
- Trucent
- US Centrifuge
- Vision Machine Inc.
- Western States
Qualitative and quantitative analysis of companies has been conducted to help clients understand the wider business environment as well as the strengths and weaknesses of key industry players. Data is qualitatively analyzed to categorize companies as pure play, category-focused, industry-focused, and diversified; it is quantitatively analyzed to categorize companies as dominant, leading, strong, tentative, and weak.
Recent Development and News in Us sedimentation and centrifugation market
- In August 2024, Houston City Council approved a contract exceeding $1 billion as a major part of its multi-billion-dollar consent decree with the Environmental Protection Agency to overhaul its sanitary sewer system and treatment facilities.
- In April 2024, Novo Nordisk committed to an $11 billion investment to expand its manufacturing facilities in Clayton, North Carolina, to boost production of biologic drugs.
- In February 2025, The Great Lakes Water Authority (GLWA) approved new water and sewer rate increases for metro Detroit following extensive public feedback to fund infrastructure modernization.
- In July 2024, the United States Environmental Protection Agency announced the selection of organizations to receive $20 million in funding for its Water Technical Assistance program to support workforce development.
Dive into Technavio’s robust research methodology, blending expert interviews, extensive data synthesis, and validated models for unparalleled US Sedimentation And Centrifugation Market insights. See full methodology.
| Market Scope | |
|---|---|
| Page number | 236 |
| Base year | 2024 |
| Historic period | 2019-2023 |
| Forecast period | 2025-2029 |
| Growth momentum & CAGR | Accelerate at a CAGR of 6% |
| Market growth 2025-2029 | USD 598.5 million |
| Market structure | Fragmented |
| YoY growth 2024-2025(%) | 5.7% |
| Key countries | US |
| Competitive landscape | Leading Companies, Market Positioning of Companies, Competitive Strategies, and Industry Risks |
Research Analyst Overview
- The sedimentation and centrifugation market is characterized by a dynamic interplay between regulatory drivers and technological innovation. Core equipment such as the decanter centrifuge and disk stack separator are fundamental to diverse industries, from biosolids management in municipalities to mineral processing. The push for process intensification is compelling end-users to adopt more efficient systems.
- For instance, in edible oil refining, advanced centrifuges improve yield by over 5% compared to older models. A critical boardroom consideration is the adoption of single-use centrifugation in biopharma, which mitigates contamination risk for cell harvesting centrifuge operations. The market for wastewater clarification is driven by infrastructure upgrades, with lamella clarifier units gaining favor.
- Specialized equipment like the hydrocyclone classifier for pulp cleaning and the tricanter for three-phase separation address niche requirements. Technologies are essential for managing waste streams from flue gas desulfurization gypsum and for produced water treatment. Meanwhile, competition from tangential flow filtration and membrane bioreactor systems in certain applications pressures vendors to innovate.
- This landscape necessitates a focus on total cost of ownership, where advancements in solid-liquid separation, solids control system technology, and yeast separation offer significant operational advantages.
What are the Key Data Covered in this US Sedimentation And Centrifugation Market Research and Growth Report?
-
What is the expected growth of the US Sedimentation And Centrifugation Market between 2025 and 2029?
-
USD 598.5 million, at a CAGR of 6%
-
-
What segmentation does the market report cover?
-
The report is segmented by Product Type (Mass, Premium, and Private label), Type (Clarifiers, Decanter, Disk centrifuge, Dissolved air flotation system, and Hydrocyclone), End-user (Food and beverages, Pharmaceuticals, Chemicals, Power, and Others), Deployment (Sedimentation, and Centrifugation), Technology (Solid-liquid separation, Liquid-liquid separation, and Liquid-solid-solid separation) and Geography (North America)
-
-
Which regions are analyzed in the report?
-
North America
-
-
What are the key growth drivers and market challenges?
-
Stringent environmental regulations and water management imperatives , High capital investment and extended procurement cycles
-
-
Who are the major players in the US Sedimentation And Centrifugation Market?
-
Alfa Laval AB, Andritz AG, Bazell Technologies, Beckman Coulter, Inc., Birtley Industrial Equipment Corp., Centrisys, Derrick Corp., Elgin Power and Separation Solutions, Flottweg SE, Franzenburg Centrifuge, GEA Group AG, GN Solids America, McLanahan Corp., SIEBTECHNIK GmbH, Thermo Fisher Scientific Inc., Thomas Broadbent and Sons Ltd., Tomoe Engineering USA, Inc., Trucent, US Centrifuge, Vision Machine Inc. and Western States
-
Market Research Insights
- The market's dynamics are heavily influenced by a strategic shift from waste treatment to resource recovery, compelling end-users to view streams as sources of value. This is enabled by technologies that achieve superior cake dryness and centrate quality. In municipal applications, the focus on nutrient recovery and struvite precipitation has increased, with advanced systems improving phosphorus capture by over 20%.
- In biopharmaceutical manufacturing, the adoption of gmp-compliant separation protocols is non-negotiable, where clean-in-place (cip) and sterilize-in-place (sip) capabilities can reduce changeover times by up to 40% compared to manual processes. This emphasis on efficiency and purity, from coagulation and flocculation in water treatment to intricate upstream bioprocessing, defines the competitive landscape.
We can help! Our analysts can customize this us sedimentation and centrifugation market research report to meet your requirements.
 RIA -
RIA - 
