Swimming Pool Market Analysis, Size, and Forecast 2026-2030: North America (US, Canada, and Mexico), Europe (Germany, UK, and France), APAC (China, Japan, and India), South America (Brazil, Argentina, and Colombia), Middle East and Africa (Saudi Arabia, UAE, and South Africa), and Rest of World (ROW)

Swimming Pool Market Analysis, Size, and Forecast 2026-2030:
North America (US, Canada, and Mexico), Europe (Germany, UK, and France), APAC (China, Japan, and India), South America (Brazil, Argentina, and Colombia), Middle East and Africa (Saudi Arabia, UAE, and South Africa), and Rest of World (ROW)

Published: Mar 2026 289 Pages SKU: IRTNTR43962

Market Overview at a Glance

$8.68 B
Market Opportunity
4.9%
CAGR 2025 - 2030
52.8%
North America Growth
$17.29 B
Construction segment 2024

Swimming Pool Market Size 2026-2030

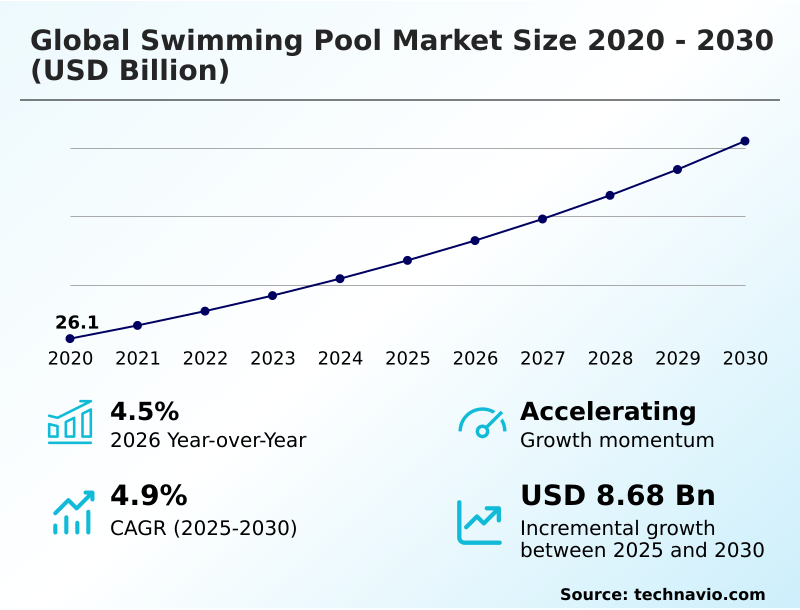
The swimming pool market size is valued to increase by USD 8.68 billion, at a CAGR of 4.9% from 2025 to 2030. Increasing demand for luxurious lifestyles will drive the swimming pool market.

Major Market Trends & Insights

  • North America dominated the market and accounted for a 52.8% growth during the forecast period.
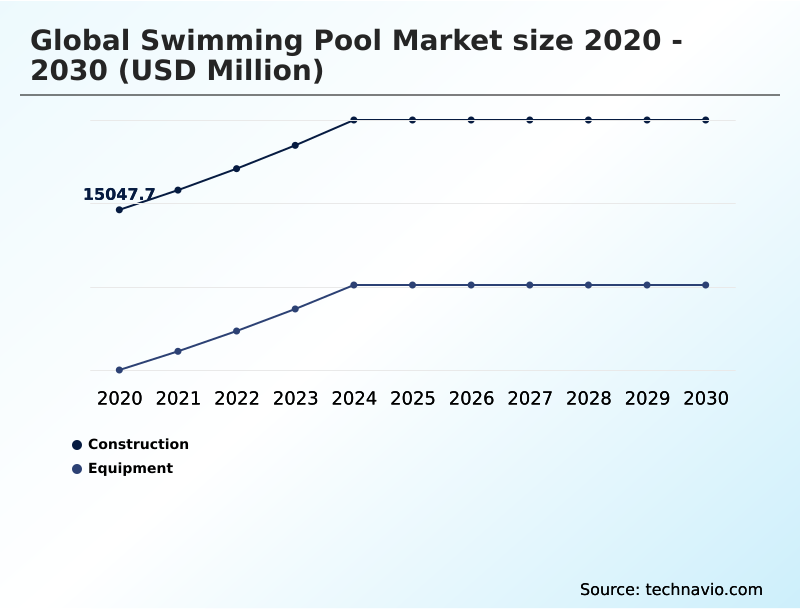
  • By Type - Construction segment was valued at USD 17.29 billion in 2024
  • By End-user - Residential segment accounted for the largest market revenue share in 2024

Market Size & Forecast

  • Market Opportunities: USD 14.37 billion
  • Market Future Opportunities: USD 8.68 billion
  • CAGR from 2025 to 2030 : 4.9%

Market Summary

  • The swimming pool market is undergoing a significant transformation, driven by a convergence of technology and evolving consumer preferences for wellness and luxury. The focus is shifting from basic recreational installations to sophisticated, automated environments that serve as centerpieces for health and social entertainment.
  • Demand for staycation amenities is fueling investment in high-end outdoor living environments, incorporating features like integrated spas and advanced underwater LED lighting. This trend is supported by innovations in energy-efficient hardware, including variable speed pumps and solar heating systems, which address long-standing concerns about operational costs.
  • At the same time, water conservation technology is becoming a standard requirement, with automatic safety covers and advanced water recycling systems helping to minimize environmental impact. For instance, a commercial hospitality operator can leverage an automated pool management platform integrated with digital water testing to optimize maintenance schedules for its commercial aquatic facilities.
  • This ensures compliance with health standards while managing high bather loads efficiently, thereby reducing labor costs and chemical usage. The market is also defined by a wide array of construction materials, from traditional reinforced concrete construction to modern fiberglass pool shells and vinyl liner pools, catering to diverse aesthetic and budgetary needs.

What will be the Size of the Swimming Pool Market during the forecast period?

Get Key Insights on Market Forecast (PDF) Request Free Sample

How is the Swimming Pool Market Segmented?

The swimming pool industry research report provides comprehensive data (region-wise segment analysis), with forecasts and estimates in "USD million" for the period 2026-2030, as well as historical data from 2020-2024 for the following segments.

  • Type
    • Construction
    • Equipment
  • End-user
    • Residential
    • Commercial
  • Product
    • Residential pools
    • Standard commercial pools
    • Olympic size pools
  • Geography
    • North America
      • US
      • Canada
      • Mexico
    • Europe
      • Germany
      • UK
      • France
    • APAC
      • China
      • Japan
      • India
    • South America
      • Brazil
      • Argentina
      • Colombia
    • Middle East and Africa
      • Saudi Arabia
      • UAE
      • South Africa
    • Rest of World (ROW)

By Type Insights

The construction segment is estimated to witness significant growth during the forecast period.

The global swimming pool market's construction segment is foundational, involving complex engineering from site excavation to the structural reinforcement of the pool shell. This phase represents the largest initial financial outlay for both residential and commercial projects.

High-end custom projects often utilize concrete and gunite for their design flexibility, while pre-fabricated modular pools and fiberglass pool shells are gaining traction for faster installation.

The selection of interior finishes, like pebble textures or glass bead finishes, is crucial for aesthetics and longevity. This segment's health is closely tied to residential real estate trends and hospitality sector expansion.

Professional builders must integrate advanced plumbing and electrical systems, including pvc piping and leak detection sensors, ensuring that operational costs for end-users, which can constitute a high portion of their budget, are managed effectively through efficient design.

Request Free Sample

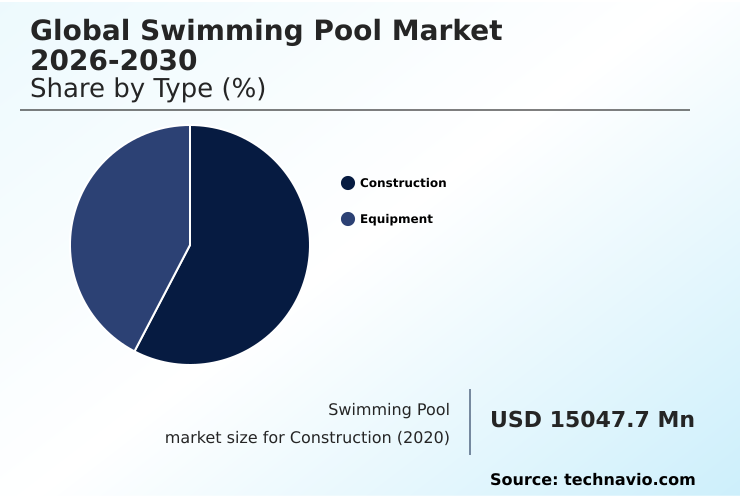
The Construction segment was valued at USD 17.29 billion in 2024 and showed a gradual increase during the forecast period.

Request Free Sample

Regional Analysis

North America is estimated to contribute 52.8% to the growth of the global market during the forecast period.Technavio’s analysts have elaborately explained the regional trends and drivers that shape the market during the forecast period.

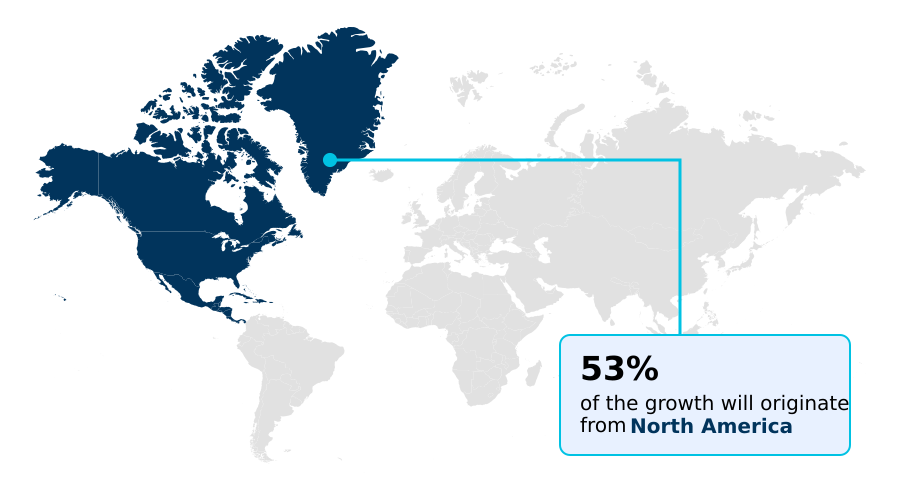
See How Swimming Pool Market Demand is Rising in North America Request Free Sample

The geographic landscape of the global swimming pool market is diverse, with regional priorities shaping technology adoption and design trends.

In North America, the market is mature, with a strong focus on smart pool automation and energy-efficient hardware; adoption rates for automated systems have grown by 15% annually in some Sunbelt states.

Europe prioritizes sustainability, where the demand for natural swimming ponds and eco-friendly water treatment has risen by over 10% in countries like Germany.

The APAC region is experiencing the most rapid expansion, driven by luxury residential and resort-style amenities in its booming tourism sector.

In Southeast Asia, the use of unique materials like sukabumi green stone is a key aesthetic trend for vacation rental amenities.

Facilities in this region that implement high-performance filtration systems report water waste reductions of up to 20%, a critical factor in urban aquatic design.

Market Dynamics

Our researchers analyzed the data with 2025 as the base year, along with the key drivers, trends, and challenges. A holistic analysis of drivers will help companies refine their marketing strategies to gain a competitive advantage.

  • Consumer and commercial investment decisions in the swimming pool market are becoming increasingly sophisticated, guided by a detailed analysis of long-term value. Homeowners actively research the benefits of saltwater pool systems and the importance of variable speed pumps to understand both upfront costs and operational savings.
  • The evaluation process often includes comparing robotic pool cleaner efficiency ratings and selecting a comprehensive residential pool automation platform. A key consideration is the fiberglass vs concrete pool durability debate, which influences purchasing decisions alongside the availability of energy-efficient pool heating options.
  • For commercial operators, adherence to regulations is paramount, making commercial pool filtration requirements and anti-entrapment compliance for pools non-negotiable. The cost of installing heat pumps and automated safety cover installation costs are weighed against the benefits of a longer swimming season and enhanced safety.
  • Advanced solutions like smart pool chemical monitoring and the benefits of ozone disinfection are gaining traction for their ability to simplify maintenance. Furthermore, facilities that complete the saltwater pool conversion process and install solar covers report maintenance overheads nearly 30% lower than those using traditional methods.
  • Understanding how robotic pool cleaners work and the benefits of automatic safety covers is crucial for managing high bather loads effectively. Ultimately, the choice between natural swimming pool construction and traditional methods is influenced by both aesthetic preferences and a commitment to sustainability, with smart pool automation systems providing a high-tech overlay for any installation.

What are the key market drivers leading to the rise in the adoption of Swimming Pool Industry?

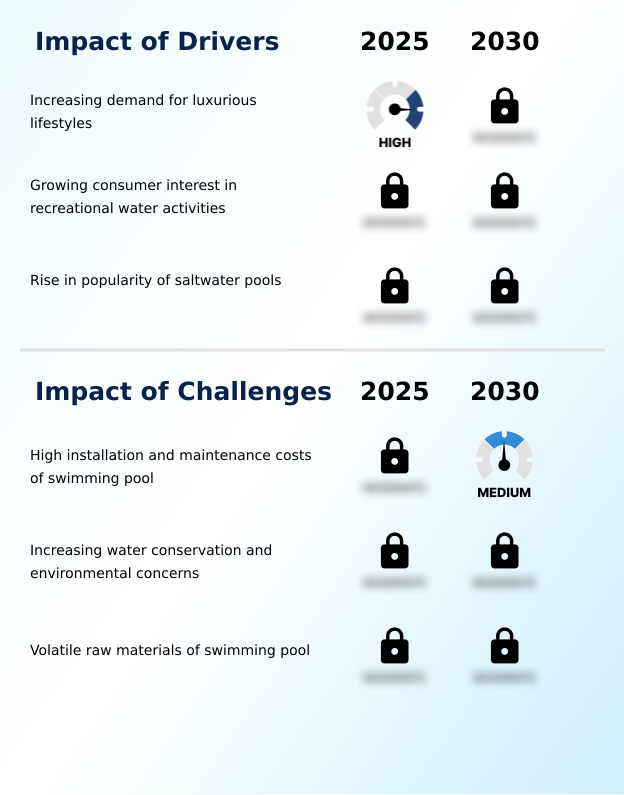
  • The increasing demand for luxurious lifestyles, where private pools are seen as a key amenity, is a primary driver of market growth.

  • A primary driver for the global swimming pool market is the increasing consumer demand for luxurious lifestyles and wellness-focused amenities. This is fueling investment in sophisticated outdoor living environments and residential lap pools.
  • In some real estate markets, properties featuring high-end, luxury residential villa-style pools command a valuation increase of up to 20%. The 'staycation' phenomenon has also become a significant factor, encouraging homeowners to create resort-style amenities at home.
  • In the commercial sector, hotels and resorts with premium wellness zones and advanced commercial aquatic facilities report guest satisfaction ratings that are 15% higher on average.
  • This robust demand supports continuous innovation in key components like high-performance filtration systems and saltwater chlorinators, which deliver a healthier and more premium swimming experience aligned with modern wellness trends.

What are the market trends shaping the Swimming Pool Industry?

  • A significant upcoming market trend is the high growth within the tourism industry. This expansion is fueling demand for new and renovated aquatic facilities in the hospitality sector.

  • The global swimming pool market is rapidly evolving into a digitally integrated ecosystem, where technology enhances both user experience and operational efficiency. The adoption of IoT-based management platforms has surged, with some commercial operators reporting a 30% improvement in maintenance staff efficiency.
  • This trend toward digitalization is evident in the rise of AI-driven water testing tools, which reduce chemical imbalances by over 50% compared to manual methods, ensuring optimal water quality in settings with high bather loads. This shift also includes energy-efficient hardware, such as variable speed pumps, which optimize power usage in real-time.
  • The construction of themed aquatic attractions and the use of pre-fabricated modular pools for faster urban deployment further highlight the industry's dynamic response to modern recreational and architectural demands, including the growth of staycation amenities.

What challenges does the Swimming Pool Industry face during its growth?

  • The high installation and maintenance costs associated with swimming pools present a key challenge, potentially affecting industry growth.

  • High operational costs and growing environmental concerns present significant challenges for the global swimming pool market. The price volatility of essential raw materials, such as resins for fiberglass pool shells and steel for reinforced concrete construction, can escalate project budgets by as much as 15% during the build phase.
  • Water conservation technology is now a critical consideration, as an uncovered pool can lose thousands of gallons of water annually. Stricter environmental regulations are compelling a shift toward eco-friendly water treatment solutions. However, the initial capital outlay for systems like natural swimming ponds can be up to 40% higher than for conventional installations.
  • This economic pressure drives the need for innovation in energy-efficient hardware to offset long-term expenses and meet sustainability goals.

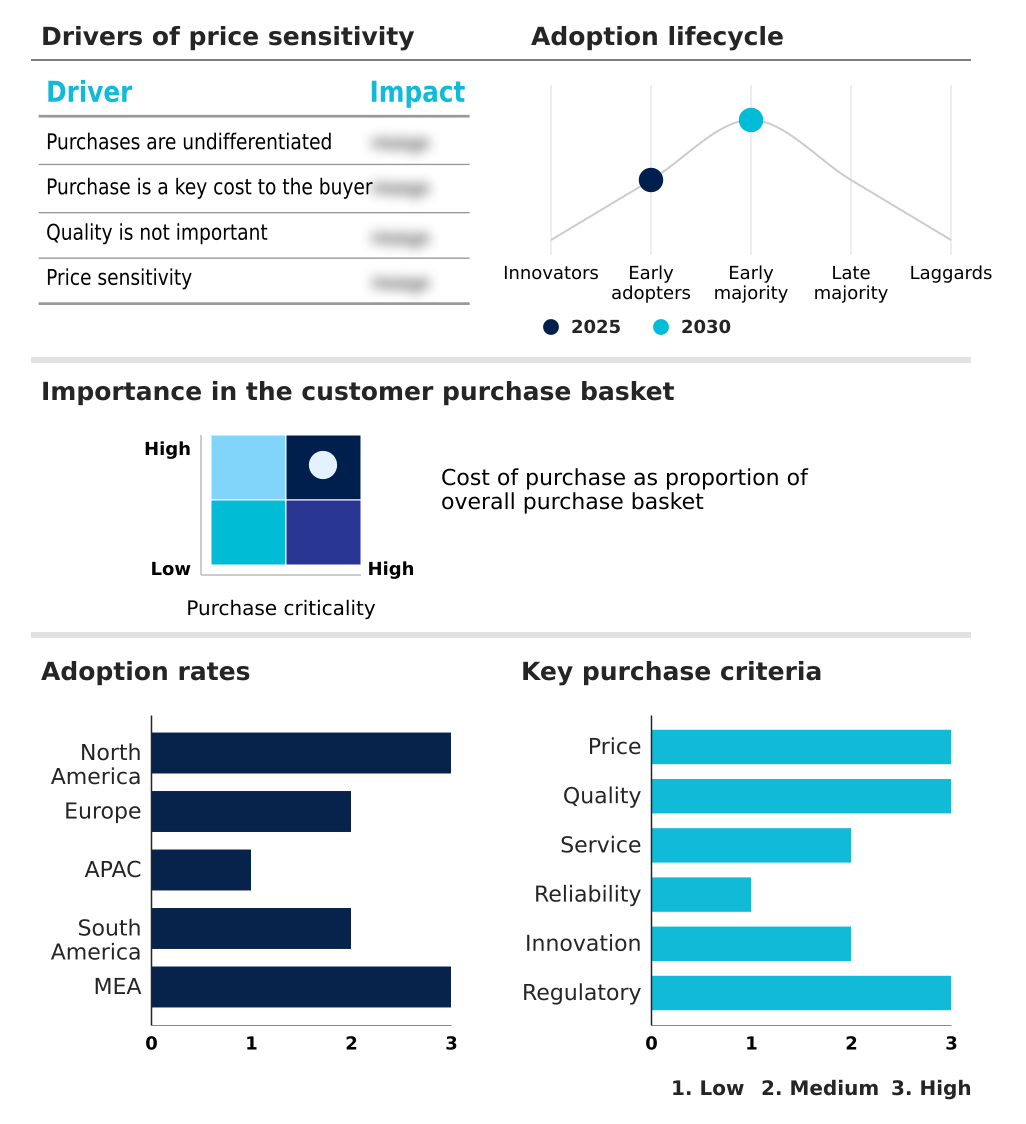
Exclusive Technavio Analysis on Customer Landscape

The swimming pool market forecasting report includes the adoption lifecycle of the market, covering from the innovator’s stage to the laggard’s stage. It focuses on adoption rates in different regions based on penetration. Furthermore, the swimming pool market report also includes key purchase criteria and drivers of price sensitivity to help companies evaluate and develop their market growth analysis strategies.

Customer Landscape of Swimming Pool Industry

Competitive Landscape

Companies are implementing various strategies, such as strategic alliances, swimming pool market forecast, partnerships, mergers and acquisitions, geographical expansion, and product/service launches, to enhance their presence in the industry.

Confer Plastics Inc. - Specializing in the manufacture of high-quality plastic steps, ladders, and safety products, the firm provides durable and secure access solutions for the swimming pool and spa industry.

The industry research and growth report includes detailed analyses of the competitive landscape of the market and information about key companies, including:

  • Confer Plastics Inc.
  • Endless Pools Inc
  • Finish Thompson Inc.
  • FLUIDRA SA
  • H.C. Harrington Co.Inc.
  • Hayward Holdings Inc.
  • Intex Recreation Corp.
  • Latham Pool Products Inc.
  • Modpools Inc.
  • Pentair Plc
  • Pool Tool Co.
  • Rheem Manufacturing Co.
  • Specialty Manufacturing Co
  • SwimEx Inc
  • Swimline
  • Therm Product
  • Val Pak Products
  • Valterra Products LLC
  • Waterco Ltd.

Qualitative and quantitative analysis of companies has been conducted to help clients understand the wider business environment as well as the strengths and weaknesses of key industry players. Data is qualitatively analyzed to categorize companies as pure play, category-focused, industry-focused, and diversified; it is quantitatively analyzed to categorize companies as dominant, leading, strong, tentative, and weak.

Recent Development and News in Swimming pool market

  • In January 2025, Fluidra released a premium catalog update introducing a new line of designer overflow systems designed for the luxury residential villa market in North America and Europe.
  • In February 2025, Zodiac Pool Systems launched its iAquaLink Plus hub, a cloud-based platform for the complete automation of residential pool and spa equipment.
  • In March 2025, Pentair initiated a marketing campaign titled 'The Wellness of Water,' highlighting its latest high-efficiency filtration systems for families focused on healthy aquatic lifestyles.
  • In May 2025, Desjoyaux Pools reported a record increase in retail sales volume, attributing the growth to the enhanced purchasing power of suburban families in developing urban corridors.

Dive into Technavio’s robust research methodology, blending expert interviews, extensive data synthesis, and validated models for unparalleled Swimming Pool Market insights. See full methodology.

Market Scope
Page number 289
Base year 2025
Historic period 2020-2024
Forecast period 2026-2030
Growth momentum & CAGR Accelerate at a CAGR of 4.9%
Market growth 2026-2030 USD 8676.9 million
Market structure Fragmented
YoY growth 2025-2026(%) 4.5%
Key countries US, Canada, Mexico, Germany, UK, France, Italy, The Netherlands, Spain, China, Japan, India, South Korea, Australia, Indonesia, Brazil, Argentina, Colombia, Saudi Arabia, UAE, South Africa, Israel and Turkey
Competitive landscape Leading Companies, Market Positioning of Companies, Competitive Strategies, and Industry Risks

Request Free Sample

Research Analyst Overview

  • The swimming pool market is advancing beyond simple recreational structures to become a nexus of high-technology and architectural design. Innovation is centered on enhancing operational efficiency and user experience through systems like saltwater chlorinators, variable speed pumps, and advanced robotic pool cleaners.
  • For boardroom consideration, the focus has shifted to capital expenditures that deliver tangible returns on investment and mitigate long-term risk. For instance, integrating automated chemical dosing and smart pool automation into both new reinforced concrete construction and fiberglass pool shells is now a strategic decision to control ongoing maintenance costs.
  • The use of high-performance filtration systems, including cartridge filters and sand filters, alongside anti-entrapment devices is critical for compliance and safety. Technologies such as underwater LED lighting, leak detection sensors in PVC piping, and solar heating systems are becoming standard.
  • Integrated leak detection sensors within PVC piping networks have been shown to reduce water loss by over 25% annually, directly impacting operational budgets. From gunite construction with pebble textures to vinyl liner pools with deck jets, the market offers diverse solutions like water chillers and air source heat pumps, all increasingly managed via automated pool management platforms.

What are the Key Data Covered in this Swimming Pool Market Research and Growth Report?

  • What is the expected growth of the Swimming Pool Market between 2026 and 2030?

    • USD 8.68 billion, at a CAGR of 4.9%

  • What segmentation does the market report cover?

    • The report is segmented by Type (Construction, and Equipment), End-user (Residential, and Commercial), Product (Residential pools, Standard commercial pools, and Olympic size pools) and Geography (North America, Europe, APAC, South America, Middle East and Africa)

  • Which regions are analyzed in the report?

    • North America, Europe, APAC, South America and Middle East and Africa

  • What are the key growth drivers and market challenges?

    • Increasing demand for luxurious lifestyles, High installation and maintenance costs of swimming pool

  • Who are the major players in the Swimming Pool Market?

    • Confer Plastics Inc., Endless Pools Inc, Finish Thompson Inc., FLUIDRA SA, H.C. Harrington Co.Inc., Hayward Holdings Inc., Intex Recreation Corp., Latham Pool Products Inc., Modpools Inc., Pentair Plc, Pool Tool Co., Rheem Manufacturing Co., Specialty Manufacturing Co, SwimEx Inc, Swimline, Therm Product, Val Pak Products, Valterra Products LLC and Waterco Ltd.

Market Research Insights

  • Market dynamics are increasingly shaped by the integration of wellness and technology into aquatic design. The demand for specialized aquatic exercise systems and hydrotherapy pools is rising as consumers prioritize health, with properties featuring these resort-style amenities seeing enhanced value.
  • Adoption of smart home integration for pool controls has led to energy consumption reductions of up to 25% for some residential users, making high-end features more sustainable. Furthermore, commercial aquatic facilities that use advanced water quality monitoring systems report up to a 40% decrease in chemical overuse and waste.
  • This push for efficiency and enhanced user experience is making sophisticated bleisure travel facilities and well-equipped vacation rental amenities key differentiators in a competitive landscape, driving innovation across the supply chain.

We can help! Our analysts can customize this swimming pool market research report to meet your requirements.

Get in touch

1. Executive Summary

1.1 Market overview

Executive Summary - Chart on Market Overview
Executive Summary - Data Table on Market Overview
Executive Summary - Chart on Global Market Characteristics
Executive Summary - Chart on Market by Geography
Executive Summary - Chart on Market Segmentation by Type
Executive Summary - Chart on Market Segmentation by End-user
Executive Summary - Chart on Market Segmentation by Product
Executive Summary - Chart on Incremental Growth
Executive Summary - Data Table on Incremental Growth
Executive Summary - Chart on Company Market Positioning

2. Technavio Analysis

2.1 Analysis of price sensitivity, lifecycle, customer purchase basket, adoption rates, and purchase criteria

2.2 Criticality of inputs and Factors of differentiation

Chart on Overview on criticality of inputs and factors of differentiation

2.3 Factors of disruption

Chart on Overview on factors of disruption

2.4 Impact of drivers and challenges

Chart on Impact of drivers and challenges in 2025 and 2030

3. Market Landscape

3.1 Market ecosystem

Chart on Parent Market
Data Table on - Parent Market

3.2 Market characteristics

Chart on Market characteristics analysis

3.3 Value chain analysis

Chart on Value chain analysis

4. Market Sizing

4.1 Market definition

Data Table on Offerings of companies included in the market definition

4.2 Market segment analysis

Market segments

4.3 Market size 2025

4.4 Market outlook: Forecast for 2025-2030

Chart on Global - Market size and forecast 2025-2030 ($ million)
Data Table on Global - Market size and forecast 2025-2030 ($ million)
Chart on Global Market: Year-over-year growth 2025-2030 (%)
Data Table on Global Market: Year-over-year growth 2025-2030 (%)

5. Historic Market Size

5.1 Global Swimming Pool Market 2020 - 2024

Historic Market Size - Data Table on Global Swimming Pool Market 2020 - 2024 ($ million)

5.2 Type segment analysis 2020 - 2024

Historic Market Size - Type Segment 2020 - 2024 ($ million)

5.3 End-user segment analysis 2020 - 2024

Historic Market Size - End-user Segment 2020 - 2024 ($ million)

5.4 Product segment analysis 2020 - 2024

Historic Market Size - Product Segment 2020 - 2024 ($ million)

5.5 Geography segment analysis 2020 - 2024

Historic Market Size - Geography Segment 2020 - 2024 ($ million)

5.6 Country segment analysis 2020 - 2024

Historic Market Size - Country Segment 2020 - 2024 ($ million)

6. Qualitative Analysis

6.1 Impact of AI on the Global Swimming Pool Market

7. Five Forces Analysis

7.1 Five forces summary

Five forces analysis - Comparison between 2025 and 2030

7.2 Bargaining power of buyers

Bargaining power of buyers - Impact of key factors 2025 and 2030

7.3 Bargaining power of suppliers

Bargaining power of suppliers - Impact of key factors in 2025 and 2030

7.4 Threat of new entrants

Threat of new entrants - Impact of key factors in 2025 and 2030

7.5 Threat of substitutes

Threat of substitutes - Impact of key factors in 2025 and 2030

7.6 Threat of rivalry

Threat of rivalry - Impact of key factors in 2025 and 2030

7.7 Market condition

Chart on Market condition - Five forces 2025 and 2030

8. Market Segmentation by Type

8.1 Market segments

Chart on Type - Market share 2025-2030 (%)
Data Table on Type - Market share 2025-2030 (%)

8.2 Comparison by Type

Chart on Comparison by Type
Data Table on Comparison by Type

8.3 Construction - Market size and forecast 2025-2030

Chart on Construction - Market size and forecast 2025-2030 ($ million)
Data Table on Construction - Market size and forecast 2025-2030 ($ million)
Chart on Construction - Year-over-year growth 2025-2030 (%)
Data Table on Construction - Year-over-year growth 2025-2030 (%)

8.4 Equipment - Market size and forecast 2025-2030

Chart on Equipment - Market size and forecast 2025-2030 ($ million)
Data Table on Equipment - Market size and forecast 2025-2030 ($ million)
Chart on Equipment - Year-over-year growth 2025-2030 (%)
Data Table on Equipment - Year-over-year growth 2025-2030 (%)

8.5 Market opportunity by Type

Market opportunity by Type ($ million)
Data Table on Market opportunity by Type ($ million)

9. Market Segmentation by End-user

9.1 Market segments

Chart on End-user - Market share 2025-2030 (%)
Data Table on End-user - Market share 2025-2030 (%)

9.2 Comparison by End-user

Chart on Comparison by End-user
Data Table on Comparison by End-user

9.3 Residential - Market size and forecast 2025-2030

Chart on Residential - Market size and forecast 2025-2030 ($ million)
Data Table on Residential - Market size and forecast 2025-2030 ($ million)
Chart on Residential - Year-over-year growth 2025-2030 (%)
Data Table on Residential - Year-over-year growth 2025-2030 (%)

9.4 Commercial - Market size and forecast 2025-2030

Chart on Commercial - Market size and forecast 2025-2030 ($ million)
Data Table on Commercial - Market size and forecast 2025-2030 ($ million)
Chart on Commercial - Year-over-year growth 2025-2030 (%)
Data Table on Commercial - Year-over-year growth 2025-2030 (%)

9.5 Market opportunity by End-user

Market opportunity by End-user ($ million)
Data Table on Market opportunity by End-user ($ million)

10. Market Segmentation by Product

10.1 Market segments

Chart on Product - Market share 2025-2030 (%)
Data Table on Product - Market share 2025-2030 (%)

10.2 Comparison by Product

Chart on Comparison by Product
Data Table on Comparison by Product

10.3 Residential pools - Market size and forecast 2025-2030

Chart on Residential pools - Market size and forecast 2025-2030 ($ million)
Data Table on Residential pools - Market size and forecast 2025-2030 ($ million)
Chart on Residential pools - Year-over-year growth 2025-2030 (%)
Data Table on Residential pools - Year-over-year growth 2025-2030 (%)

10.4 Standard commercial pools - Market size and forecast 2025-2030

Chart on Standard commercial pools - Market size and forecast 2025-2030 ($ million)
Data Table on Standard commercial pools - Market size and forecast 2025-2030 ($ million)
Chart on Standard commercial pools - Year-over-year growth 2025-2030 (%)
Data Table on Standard commercial pools - Year-over-year growth 2025-2030 (%)

10.5 Olympic size pools - Market size and forecast 2025-2030

Chart on Olympic size pools - Market size and forecast 2025-2030 ($ million)
Data Table on Olympic size pools - Market size and forecast 2025-2030 ($ million)
Chart on Olympic size pools - Year-over-year growth 2025-2030 (%)
Data Table on Olympic size pools - Year-over-year growth 2025-2030 (%)

10.6 Market opportunity by Product

Market opportunity by Product ($ million)
Data Table on Market opportunity by Product ($ million)

11. Customer Landscape

11.1 Customer landscape overview

Analysis of price sensitivity, lifecycle, customer purchase basket, adoption rates, and purchase criteria

12. Geographic Landscape

12.1 Geographic segmentation

Chart on Market share by geography 2025-2030 (%)
Data Table on Market share by geography 2025-2030 (%)

12.2 Geographic comparison

Chart on Geographic comparison
Data Table on Geographic comparison

12.3 North America - Market size and forecast 2025-2030

Chart on North America - Market size and forecast 2025-2030 ($ million)
Data Table on North America - Market size and forecast 2025-2030 ($ million)
Chart on North America - Year-over-year growth 2025-2030 (%)
Data Table on North America - Year-over-year growth 2025-2030 (%)
Chart on Regional Comparison - North America
Data Table on Regional Comparison - North America

12.3.1 US - Market size and forecast 2025-2030

Chart on US - Market size and forecast 2025-2030 ($ million)
Data Table on US - Market size and forecast 2025-2030 ($ million)
Chart on US - Year-over-year growth 2025-2030 (%)
Data Table on US - Year-over-year growth 2025-2030 (%)

12.3.2 Canada - Market size and forecast 2025-2030

Chart on Canada - Market size and forecast 2025-2030 ($ million)
Data Table on Canada - Market size and forecast 2025-2030 ($ million)
Chart on Canada - Year-over-year growth 2025-2030 (%)
Data Table on Canada - Year-over-year growth 2025-2030 (%)

12.3.3 Mexico - Market size and forecast 2025-2030

Chart on Mexico - Market size and forecast 2025-2030 ($ million)
Data Table on Mexico - Market size and forecast 2025-2030 ($ million)
Chart on Mexico - Year-over-year growth 2025-2030 (%)
Data Table on Mexico - Year-over-year growth 2025-2030 (%)

12.4 Europe - Market size and forecast 2025-2030

Chart on Europe - Market size and forecast 2025-2030 ($ million)
Data Table on Europe - Market size and forecast 2025-2030 ($ million)
Chart on Europe - Year-over-year growth 2025-2030 (%)
Data Table on Europe - Year-over-year growth 2025-2030 (%)
Chart on Regional Comparison - Europe
Data Table on Regional Comparison - Europe

12.4.1 Germany - Market size and forecast 2025-2030

Chart on Germany - Market size and forecast 2025-2030 ($ million)
Data Table on Germany - Market size and forecast 2025-2030 ($ million)
Chart on Germany - Year-over-year growth 2025-2030 (%)
Data Table on Germany - Year-over-year growth 2025-2030 (%)

12.4.2 UK - Market size and forecast 2025-2030

Chart on UK - Market size and forecast 2025-2030 ($ million)
Data Table on UK - Market size and forecast 2025-2030 ($ million)
Chart on UK - Year-over-year growth 2025-2030 (%)
Data Table on UK - Year-over-year growth 2025-2030 (%)

12.4.3 France - Market size and forecast 2025-2030

Chart on France - Market size and forecast 2025-2030 ($ million)
Data Table on France - Market size and forecast 2025-2030 ($ million)
Chart on France - Year-over-year growth 2025-2030 (%)
Data Table on France - Year-over-year growth 2025-2030 (%)

12.4.4 Italy - Market size and forecast 2025-2030

Chart on Italy - Market size and forecast 2025-2030 ($ million)
Data Table on Italy - Market size and forecast 2025-2030 ($ million)
Chart on Italy - Year-over-year growth 2025-2030 (%)
Data Table on Italy - Year-over-year growth 2025-2030 (%)

12.4.5 The Netherlands - Market size and forecast 2025-2030

Chart on The Netherlands - Market size and forecast 2025-2030 ($ million)
Data Table on The Netherlands - Market size and forecast 2025-2030 ($ million)
Chart on The Netherlands - Year-over-year growth 2025-2030 (%)
Data Table on The Netherlands - Year-over-year growth 2025-2030 (%)

12.4.6 Spain - Market size and forecast 2025-2030

Chart on Spain - Market size and forecast 2025-2030 ($ million)
Data Table on Spain - Market size and forecast 2025-2030 ($ million)
Chart on Spain - Year-over-year growth 2025-2030 (%)
Data Table on Spain - Year-over-year growth 2025-2030 (%)

12.5 APAC - Market size and forecast 2025-2030

Chart on APAC - Market size and forecast 2025-2030 ($ million)
Data Table on APAC - Market size and forecast 2025-2030 ($ million)
Chart on APAC - Year-over-year growth 2025-2030 (%)
Data Table on APAC - Year-over-year growth 2025-2030 (%)
Chart on Regional Comparison - APAC
Data Table on Regional Comparison - APAC

12.5.1 China - Market size and forecast 2025-2030

Chart on China - Market size and forecast 2025-2030 ($ million)
Data Table on China - Market size and forecast 2025-2030 ($ million)
Chart on China - Year-over-year growth 2025-2030 (%)
Data Table on China - Year-over-year growth 2025-2030 (%)

12.5.2 Japan - Market size and forecast 2025-2030

Chart on Japan - Market size and forecast 2025-2030 ($ million)
Data Table on Japan - Market size and forecast 2025-2030 ($ million)
Chart on Japan - Year-over-year growth 2025-2030 (%)
Data Table on Japan - Year-over-year growth 2025-2030 (%)

12.5.3 India - Market size and forecast 2025-2030

Chart on India - Market size and forecast 2025-2030 ($ million)
Data Table on India - Market size and forecast 2025-2030 ($ million)
Chart on India - Year-over-year growth 2025-2030 (%)
Data Table on India - Year-over-year growth 2025-2030 (%)

12.5.4 South Korea - Market size and forecast 2025-2030

Chart on South Korea - Market size and forecast 2025-2030 ($ million)
Data Table on South Korea - Market size and forecast 2025-2030 ($ million)
Chart on South Korea - Year-over-year growth 2025-2030 (%)
Data Table on South Korea - Year-over-year growth 2025-2030 (%)

12.5.5 Australia - Market size and forecast 2025-2030

Chart on Australia - Market size and forecast 2025-2030 ($ million)
Data Table on Australia - Market size and forecast 2025-2030 ($ million)
Chart on Australia - Year-over-year growth 2025-2030 (%)
Data Table on Australia - Year-over-year growth 2025-2030 (%)

12.5.6 Indonesia - Market size and forecast 2025-2030

Chart on Indonesia - Market size and forecast 2025-2030 ($ million)
Data Table on Indonesia - Market size and forecast 2025-2030 ($ million)
Chart on Indonesia - Year-over-year growth 2025-2030 (%)
Data Table on Indonesia - Year-over-year growth 2025-2030 (%)

12.6 South America - Market size and forecast 2025-2030

Chart on South America - Market size and forecast 2025-2030 ($ million)
Data Table on South America - Market size and forecast 2025-2030 ($ million)
Chart on South America - Year-over-year growth 2025-2030 (%)
Data Table on South America - Year-over-year growth 2025-2030 (%)
Chart on Regional Comparison - South America
Data Table on Regional Comparison - South America

12.6.1 Brazil - Market size and forecast 2025-2030

Chart on Brazil - Market size and forecast 2025-2030 ($ million)
Data Table on Brazil - Market size and forecast 2025-2030 ($ million)
Chart on Brazil - Year-over-year growth 2025-2030 (%)
Data Table on Brazil - Year-over-year growth 2025-2030 (%)

12.6.2 Argentina - Market size and forecast 2025-2030

Chart on Argentina - Market size and forecast 2025-2030 ($ million)
Data Table on Argentina - Market size and forecast 2025-2030 ($ million)
Chart on Argentina - Year-over-year growth 2025-2030 (%)
Data Table on Argentina - Year-over-year growth 2025-2030 (%)

12.6.3 Colombia - Market size and forecast 2025-2030

Chart on Colombia - Market size and forecast 2025-2030 ($ million)
Data Table on Colombia - Market size and forecast 2025-2030 ($ million)
Chart on Colombia - Year-over-year growth 2025-2030 (%)
Data Table on Colombia - Year-over-year growth 2025-2030 (%)

12.7 Middle East and Africa - Market size and forecast 2025-2030

Chart on Middle East and Africa - Market size and forecast 2025-2030 ($ million)
Data Table on Middle East and Africa - Market size and forecast 2025-2030 ($ million)
Chart on Middle East and Africa - Year-over-year growth 2025-2030 (%)
Data Table on Middle East and Africa - Year-over-year growth 2025-2030 (%)
Chart on Regional Comparison - Middle East and Africa
Data Table on Regional Comparison - Middle East and Africa

12.7.1 Saudi Arabia - Market size and forecast 2025-2030

Chart on Saudi Arabia - Market size and forecast 2025-2030 ($ million)
Data Table on Saudi Arabia - Market size and forecast 2025-2030 ($ million)
Chart on Saudi Arabia - Year-over-year growth 2025-2030 (%)
Data Table on Saudi Arabia - Year-over-year growth 2025-2030 (%)

12.7.2 UAE - Market size and forecast 2025-2030

Chart on UAE - Market size and forecast 2025-2030 ($ million)
Data Table on UAE - Market size and forecast 2025-2030 ($ million)
Chart on UAE - Year-over-year growth 2025-2030 (%)
Data Table on UAE - Year-over-year growth 2025-2030 (%)

12.7.3 South Africa - Market size and forecast 2025-2030

Chart on South Africa - Market size and forecast 2025-2030 ($ million)
Data Table on South Africa - Market size and forecast 2025-2030 ($ million)
Chart on South Africa - Year-over-year growth 2025-2030 (%)
Data Table on South Africa - Year-over-year growth 2025-2030 (%)

12.7.4 Israel - Market size and forecast 2025-2030

Chart on Israel - Market size and forecast 2025-2030 ($ million)
Data Table on Israel - Market size and forecast 2025-2030 ($ million)
Chart on Israel - Year-over-year growth 2025-2030 (%)
Data Table on Israel - Year-over-year growth 2025-2030 (%)

12.7.5 Turkey - Market size and forecast 2025-2030

Chart on Turkey - Market size and forecast 2025-2030 ($ million)
Data Table on Turkey - Market size and forecast 2025-2030 ($ million)
Chart on Turkey - Year-over-year growth 2025-2030 (%)
Data Table on Turkey - Year-over-year growth 2025-2030 (%)

12.8 Market opportunity by geography

Market opportunity by geography ($ million)
Data Tables on Market opportunity by geography ($ million)

13. Drivers, Challenges, and Opportunity

13.1 Market drivers

Increasing demand for luxurious lifestyles
Growing consumer interest in recreational water activities
Rise in popularity of saltwater pools

13.2 Market challenges

High installation and maintenance costs of swimming pool
Increasing water conservation and environmental concerns
Volatile raw materials of swimming pool

13.3 Impact of drivers and challenges

Impact of drivers and challenges in 2025 and 2030

13.4 Market opportunities

High growth in tourism industry
Increasing use of technology in swimming pools
Growing consumer spending capability

14. Competitive Landscape

14.1 Overview

14.2

Overview on criticality of inputs and factors of differentiation

14.3 Landscape disruption

Overview on factors of disruption

14.4 Industry risks

Impact of key risks on business

15. Competitive Analysis

15.1 Companies profiled

Companies covered

15.2 Company ranking index

15.3 Market positioning of companies

Matrix on companies position and classification

15.4 Confer Plastics Inc.

Confer Plastics Inc. - Overview
Confer Plastics Inc. - Product / Service
Confer Plastics Inc. - Key offerings
SWOT

15.5 Endless Pools Inc

Endless Pools Inc - Overview
Endless Pools Inc - Product / Service
Endless Pools Inc - Key offerings
SWOT

15.6 Finish Thompson Inc.

Finish Thompson Inc. - Overview
Finish Thompson Inc. - Product / Service
Finish Thompson Inc. - Key offerings
SWOT

15.7 FLUIDRA SA

FLUIDRA SA - Overview
FLUIDRA SA - Product / Service
FLUIDRA SA - Key offerings
SWOT

15.8 H.C. Harrington Co.Inc.

H.C. Harrington Co.Inc. - Overview
H.C. Harrington Co.Inc. - Product / Service
H.C. Harrington Co.Inc. - Key offerings
SWOT

15.9 Intex Recreation Corp.

Intex Recreation Corp. - Overview
Intex Recreation Corp. - Product / Service
Intex Recreation Corp. - Key offerings
SWOT

15.10 Latham Pool Products Inc.

Latham Pool Products Inc. - Overview
Latham Pool Products Inc. - Product / Service
Latham Pool Products Inc. - Key offerings
SWOT

15.11 Pentair Plc

Pentair Plc - Overview
Pentair Plc - Business segments
Pentair Plc - Key news
Pentair Plc - Key offerings
Pentair Plc - Segment focus
SWOT

15.12 Pool Tool Co.

Pool Tool Co. - Overview
Pool Tool Co. - Product / Service
Pool Tool Co. - Key offerings
SWOT

15.13 Rheem Manufacturing Co.

Rheem Manufacturing Co. - Overview
Rheem Manufacturing Co. - Product / Service
Rheem Manufacturing Co. - Key news
Rheem Manufacturing Co. - Key offerings
SWOT

15.14 Specialty Manufacturing Co

Specialty Manufacturing Co - Overview
Specialty Manufacturing Co - Product / Service
Specialty Manufacturing Co - Key offerings
SWOT

15.15 Therm Product

Therm Product - Overview
Therm Product - Product / Service
Therm Product - Key offerings
SWOT

15.16 Val Pak Products

Val Pak Products - Overview
Val Pak Products - Product / Service
Val Pak Products - Key news
Val Pak Products - Key offerings
SWOT

15.17 Valterra Products LLC

Valterra Products LLC - Overview
Valterra Products LLC - Product / Service
Valterra Products LLC - Key offerings
SWOT

15.18 Waterco Ltd.

Waterco Ltd. - Overview
Waterco Ltd. - Business segments
Waterco Ltd. - Key offerings
Waterco Ltd. - Segment focus
SWOT

16. Appendix

16.1 Scope of the report

Market definition
Objectives
Notes and caveats

16.2 Inclusions and exclusions checklist

Inclusions checklist
Exclusions checklist

16.3 Currency conversion rates for US$

16.4 Research methodology

16.5 Data procurement

Information sources

16.6 Data validation

16.7 Validation techniques employed for market sizing

16.8 Data synthesis

16.9 360 degree market analysis

16.10 List of abbreviations

Research Methodology

Technavio presents a detailed picture of the market by way of study, synthesis, and summation of data from multiple sources. The analysts have presented the various facets of the market with a particular focus on identifying the key industry influencers. The data thus presented is comprehensive, reliable, and the result of extensive research, both primary and secondary.

INFORMATION SOURCES

Primary sources

  • Manufacturers and suppliers
  • Channel partners
  • Industry experts
  • Strategic decision makers

Secondary sources

  • Industry journals and periodicals
  • Government data
  • Financial reports of key industry players
  • Historical data
  • Press releases

DATA ANALYSIS

Data Synthesis

  • Collation of data
  • Estimation of key figures
  • Analysis of derived insights

Data Validation

  • Triangulation with data models
  • Reference against proprietary databases
  • Corroboration with industry experts

REPORT WRITING

Qualitative

  • Market drivers
  • Market challenges
  • Market trends
  • Five forces analysis

Quantitative

  • Market size and forecast
  • Market segmentation
  • Geographical insights
  • Competitive landscape

Interested in this report?

Get your sample now to see our research methodology and insights!

Download Now

Frequently Asked Questions

Swimming Pool market growth will increase by USD 8676.9 million during 2026-2030.

The Swimming Pool market is expected to grow at a CAGR of 4.9% during 2026-2030.

Swimming Pool market is segmented by Type (Construction, Equipment) End-user (Residential, Commercial) Product (Residential pools, Standard commercial pools, Olympic size pools)

Confer Plastics Inc., Endless Pools Inc, Finish Thompson Inc., FLUIDRA SA, H.C. Harrington Co.Inc., Hayward Holdings Inc., Intex Recreation Corp., Latham Pool Products Inc., Modpools Inc., Pentair Plc, Pool Tool Co., Rheem Manufacturing Co., Specialty Manufacturing Co, SwimEx Inc, Swimline, Therm Product, Val Pak Products, Valterra Products LLC, Waterco Ltd. are a few of the key vendors in the Swimming Pool market.

North America will register the highest growth rate of 52.8% among the other regions. Therefore, the Swimming Pool market in North America is expected to garner significant business opportunities for the vendors during the forecast period.

US, Canada, Mexico, Germany, UK, France, Italy, The Netherlands, Spain, China, Japan, India, South Korea, Australia, Indonesia, Brazil, Argentina, Colombia, Saudi Arabia, UAE, South Africa, Israel, Turkey

  • Increasing demand for luxurious lifestyles is the driving factor this market.

The Swimming Pool market vendors should focus on grabbing business opportunities from the Type segment as it accounted for the largest market share in the base year.