
Travel Technologies Market Size 2026-2030
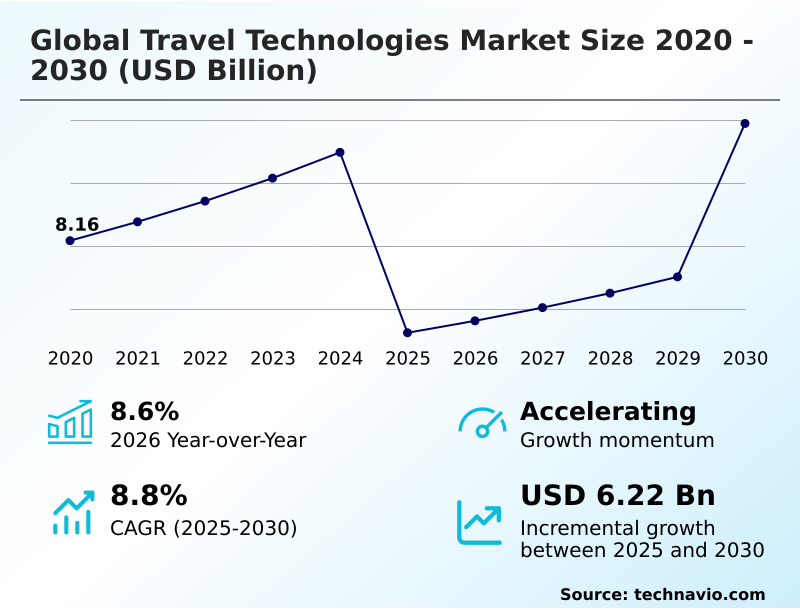
The travel technologies market size is valued to increase by USD 6.22 billion, at a CAGR of 8.8% from 2025 to 2030. Surging demand for AI and hyper-personalization will drive the travel technologies market.
Major Market Trends & Insights
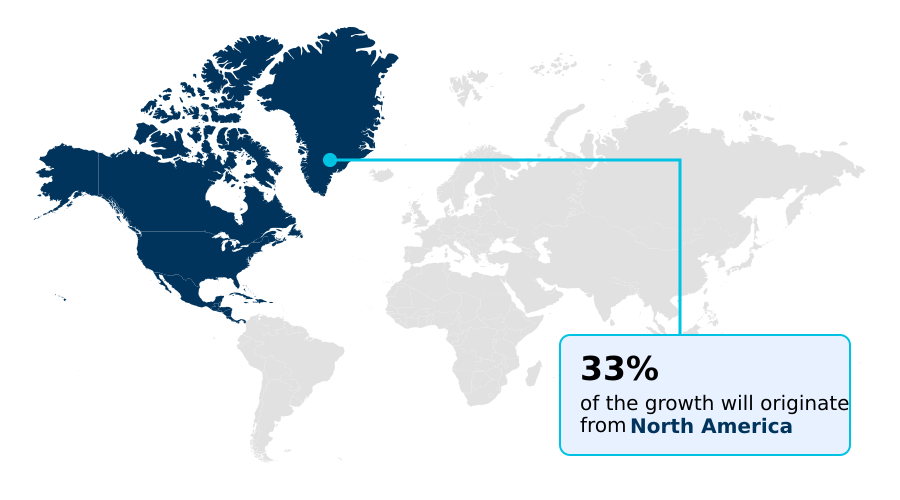
- North America dominated the market and accounted for a 32.8% growth during the forecast period.
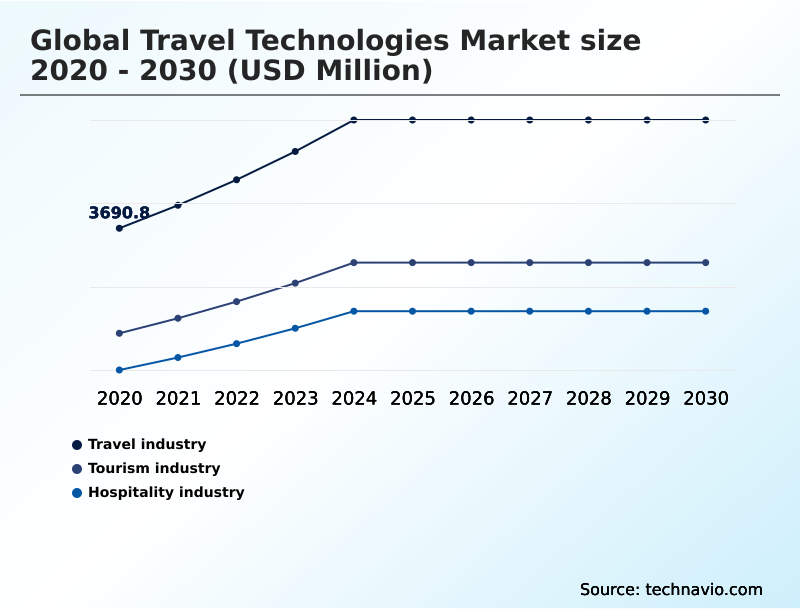
- By Application - Travel industry segment was valued at USD 4.97 billion in 2024
- By Product - Global distribution system and Airline and hospitality IT solutions segment accounted for the largest market revenue share in 2024
Market Size & Forecast
- Market Opportunities: USD 9.96 billion
- Market Future Opportunities: USD 6.22 billion
- CAGR from 2025 to 2030 : 8.8%
Market Summary
- The travel technologies market is defined by a rapid evolution toward an integrated, intelligent, and highly personalized ecosystem. This transformation is driven by the imperative to streamline complex operations while meeting the sophisticated demands of modern travelers for seamless digital experiences.
- Core to this shift is the deployment of artificial intelligence and machine learning to analyze vast datasets, enabling hyper-personalized recommendations, dynamic pricing, and predictive disruption management.
- For example, an airline can leverage AI-powered platforms to automatically rebook passengers from a canceled flight onto the next available service, simultaneously updating their hotel and ground transport arrangements, all before the traveler is even aware of the initial disruption. This level of automation not only enhances customer satisfaction but also significantly improves operational efficiency.
- Concurrently, the industry grapples with the complexities of integrating innovative solutions with entrenched legacy systems and navigating an intricate web of data privacy regulations. The successful adoption of technologies such as biometric verification, contactless payments, and digital identity wallets is creating a more frictionless journey, from booking to destination.
- As sustainability becomes a key consideration, carbon tracking and offsetting tools are also becoming integral features within corporate and leisure travel platforms, reflecting a broader market move toward responsible innovation.
What will be the Size of the Travel Technologies Market during the forecast period?
Get Key Insights on Market Forecast (PDF) Get Free Sample
How is the Travel Technologies Market Segmented?
The travel technologies industry research report provides comprehensive data (region-wise segment analysis), with forecasts and estimates in "USD million" for the period 2026-2030, as well as historical data from 2020-2024 for the following segments.
- Application
- Travel industry
- Tourism industry
- Hospitality industry
- Product
- Global distribution system
- Airline and hospitality IT solutions
- Type
- Leisure
- Business
- Group
- Geography
- North America
- US
- Canada
- Mexico
- Europe
- UK
- Germany
- France
- APAC
- China
- Japan
- India
- Middle East and Africa
- UAE
- Saudi Arabia
- South Africa
- South America
- Brazil
- Argentina
- Colombia
- Rest of World (ROW)
- North America
By Application Insights
The travel industry segment is estimated to witness significant growth during the forecast period.
The travel industry's digital transformation is propelled by the integration of advanced technologies designed to enhance operational efficiency and personalize consumer journeys. Core systems, including airline reservation systems and platforms for corporate travel management, are being overhauled with cloud-based automation.
This shift facilitates the use of sophisticated customer engagement analytics and dynamic pricing algorithms. Moreover, the focus on a seamless traveler experience is driving the adoption of biometric verification systems and frameworks for decentralized digital identity.
The implementation of tools like an AI-powered travel assistant and solutions for automated sustainability tracking is becoming standard.
For instance, the use of advanced communication tools has increased message delivery by 12%, significantly improving traveler support during disruptions through corporate travel booking tools.
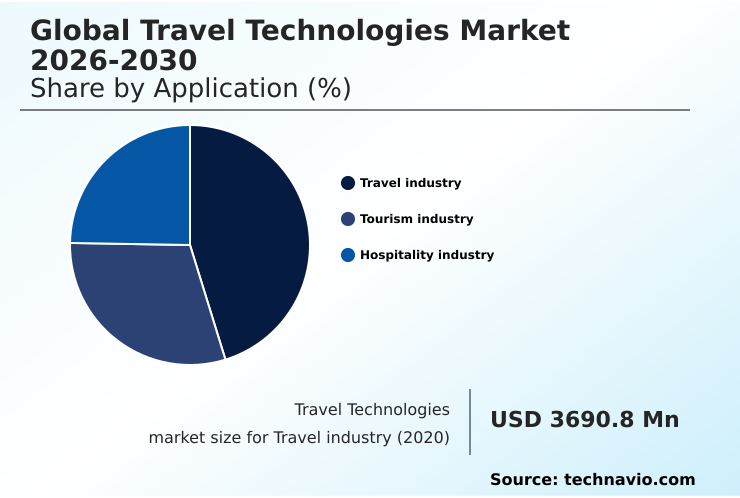
The Travel industry segment was valued at USD 4.97 billion in 2024 and showed a gradual increase during the forecast period.
Regional Analysis
North America is estimated to contribute 32.8% to the growth of the global market during the forecast period.Technavio’s analysts have elaborately explained the regional trends and drivers that shape the market during the forecast period.
See How Travel Technologies Market Demand is Rising in North America Get Free Sample
The geographic landscape is characterized by diverse adoption rates and technological priorities, with North America leading in mature implementations of predictive analytics and machine learning algorithms.
The region's focus on integrated travel management has led to platforms that unify booking, expenses, and itinerary changes, with some achieving a 20% reduction in processing times.
Meanwhile, APAC is the fastest-growing region, with a projected growth rate of 9.6%, driven by the adoption of mobile booking applications and virtual reality previews.
The use of immersive navigation tools and AI-based recommendation engines is critical for engaging a mobile-first consumer base.
Across all regions, the deployment of IoT sensors in hospitality and smart contracts for B2B transactions is gaining traction, signaling a move toward a more automated and data-centric global travel ecosystem.
Market Dynamics
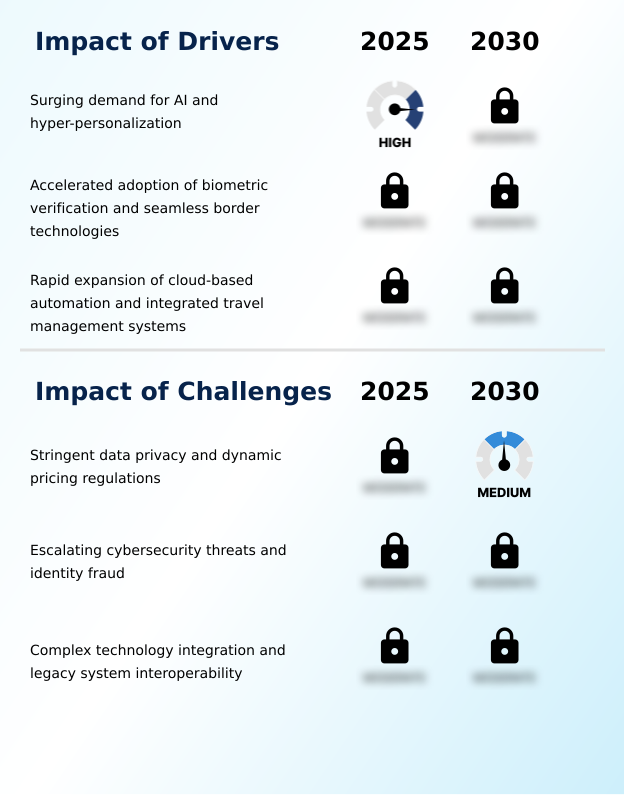
Our researchers analyzed the data with 2025 as the base year, along with the key drivers, trends, and challenges. A holistic analysis of drivers will help companies refine their marketing strategies to gain a competitive advantage.
- Navigating the strategic landscape requires a deep understanding of several interconnected dynamics. The impact of AI on travel booking platforms continues to be profound, pushing operators toward sophisticated personalization and automation. However, the benefits of biometric verification in airports, which can reduce passenger processing times by up to 40%, are often tempered by the significant challenges of legacy system interoperability.
- The role of GDS in modern travel distribution is evolving from a simple aggregator to a complex retail platform, driven by the need for optimizing airline ancillary revenue with NDC. This transition introduces new complexities that technology providers must address.
- Simultaneously, the industry is exploring advanced solutions like blockchain applications for secure travel payments and leveraging virtual reality applications in destination marketing to create more immersive consumer engagement. Proactively developing sustainable corporate travel policies is no longer optional but a core business requirement, influencing platform design and feature sets.
- Furthermore, managing cybersecurity threats in travel apps and using big data for tourism flow management are critical operational imperatives that demand constant vigilance and investment. Successfully balancing these technological opportunities and operational risks is the key to sustained success.
What are the key market drivers leading to the rise in the adoption of Travel Technologies Industry?
- The surging demand for AI-driven hyper-personalization is a primary driver of the market, compelling providers to deliver tailored travel experiences in real time.
- Market growth is fueled by the rapid adoption of cloud-native platforms that enhance operational efficiency and customer experience.
- Advanced property management systems (PMS) and revenue management software are enabling the hospitality sector to optimize pricing and occupancy dynamically, with some hotels increasing direct bookings by up to 20%.
- The push for sustainable travel solutions is also a significant factor, compelling providers to integrate carbon tracking into travel commerce platforms.
- In parallel, the deployment of seamless border technologies and smart airport initiatives is creating a more fluid journey for travelers. This is supported by the widespread use of mobile-first applications and contactless payment solutions.
- The demand for integrated tour operator software and travel ERP systems reflects a broader industry move towards consolidating technology stacks to eliminate data silos and improve service delivery across airline and hospitality IT solutions.
What are the market trends shaping the Travel Technologies Industry?
- The pervasive adoption of virtual and augmented reality for immersive planning is fundamentally reshaping how consumers discover and evaluate travel options. This technology provides interactive, detailed previews of destinations, boosting booking confidence.
- Market trends are coalescing around the creation of a seamless and intelligent digital travel ecosystem. The evolution of the global distribution system (GDS) is central, as it adapts to the new distribution capability (NDC) to offer richer content.
- This shift is mirrored by advancements in hospitality IT solutions and passenger service systems (PSS), which are leveraging customer data analytics to enhance service. However, a significant hurdle remains the challenge of legacy system integration. The proliferation of mobile travel applications and sophisticated online booking engines puts pressure on providers to deliver a frictionless travel experience.
- Platforms are increasingly integrating digital identity and advanced itinerary management tools to meet consumer expectations for convenience and security, with some platforms reducing booking errors by over 15% through automation. This creates data-driven pricing models that are more responsive to market conditions.
What challenges does the Travel Technologies Industry face during its growth?
- Stringent data privacy regulations and scrutiny over dynamic pricing models present a significant challenge, impacting operational agility and requiring substantial compliance investment.
- The primary challenges stem from security vulnerabilities and regulatory complexities inherent in a digitized travel landscape. The need to secure the digital passenger journey against fraud and data breaches requires constant investment in travel technology infrastructure and robust passenger data security protocols. The adoption of digital identity wallets and decentralized financial platforms introduces new security paradigms that must be managed.
- At the same time, platforms offering dynamic packaging capabilities and hyper-personalization algorithms must navigate stringent data privacy laws, which can limit the effectiveness of data-driven pricing models. The reliance on digital booking platforms and other digital tools creates a massive attack surface.
- A data breach can affect millions of users, with recovery costs often exceeding initial security investments by a factor of three or four. Integrating a generative AI travel assistant also presents challenges in ensuring data accuracy and preventing biases.
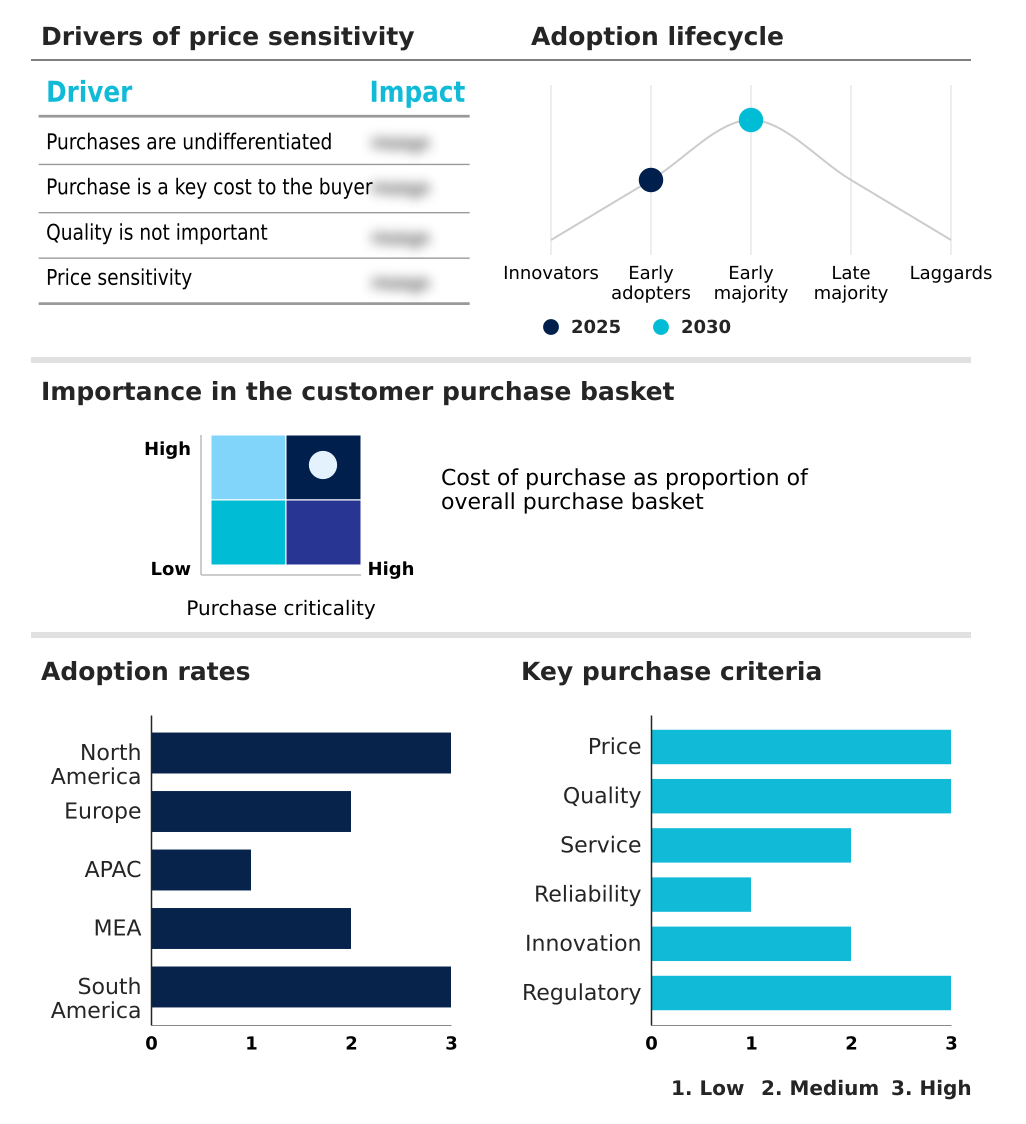
Exclusive Technavio Analysis on Customer Landscape
The travel technologies market forecasting report includes the adoption lifecycle of the market, covering from the innovator’s stage to the laggard’s stage. It focuses on adoption rates in different regions based on penetration. Furthermore, the travel technologies market report also includes key purchase criteria and drivers of price sensitivity to help companies evaluate and develop their market growth analysis strategies.
Customer Landscape of Travel Technologies Industry
Competitive Landscape
Companies are implementing various strategies, such as strategic alliances, travel technologies market forecast, partnerships, mergers and acquisitions, geographical expansion, and product/service launches, to enhance their presence in the industry.
Accelya Group - Offerings include a comprehensive suite of solutions, encompassing global distribution systems, airline IT, and hospitality platforms designed to automate critical processes for the travel industry.
The industry research and growth report includes detailed analyses of the competitive landscape of the market and information about key companies, including:
- Accelya Group
- Airbnb Inc.
- Amadeus IT Group SA
- Booking Holdings Inc.
- China TravelSky Holding Co Ltd
- Expedia Group Inc.
- GP Solutions GmbH
- Hitit Computer Services
- Hotelbeds Group
- IBS Software Pvt. Ltd.
- Rezdy Pty Ltd
- Sabre Corp.
- SITA
- Tourplan
- Travelfusion Ltd
- Travelport LP
- Traveltek Group Ltd
- TrekkSoft AG
- TripAdvisor Inc.
- Verint Systems Inc.
Qualitative and quantitative analysis of companies has been conducted to help clients understand the wider business environment as well as the strengths and weaknesses of key industry players. Data is qualitatively analyzed to categorize companies as pure play, category-focused, industry-focused, and diversified; it is quantitatively analyzed to categorize companies as dominant, leading, strong, tentative, and weak.
Recent Development and News in Travel technologies market
- In October 2025, Amadeus IT Group expanded its partnership with Microsoft Corp. to deploy advanced generative AI tools aimed at automating corporate travel booking and enhancing dynamic pricing models across North American distribution channels.
- In June 2025, Qantas disclosed a severe cyberattack that compromised an external customer service platform, exposing the personal data of approximately six million customers.
- In August 2025, Despegar completed the integration of a new blockchain-based payment gateway across its primary Latin American markets to enable secure, instant cross-border transactions.
- In January 2025, Perplexity announced a strategic partnership with Tripadvisor and Selfbook, allowing users to research and book hotels directly within the Perplexity AI platform, creating a frictionless journey from discovery to confirmation.
Dive into Technavio’s robust research methodology, blending expert interviews, extensive data synthesis, and validated models for unparalleled Travel Technologies Market insights. See full methodology.
| Market Scope | |
|---|---|
| Page number | 297 |
| Base year | 2025 |
| Historic period | 2020-2024 |
| Forecast period | 2026-2030 |
| Growth momentum & CAGR | Accelerate at a CAGR of 8.8% |
| Market growth 2026-2030 | USD 6222.5 million |
| Market structure | Fragmented |
| YoY growth 2025-2026(%) | 8.6% |
| Key countries | US, Canada, Mexico, UK, Germany, France, Spain, Italy, Russia, China, Japan, India, Australia, Singapore, South Korea, UAE, Saudi Arabia, South Africa, Egypt, Israel, Brazil, Argentina and Colombia |
| Competitive landscape | Leading Companies, Market Positioning of Companies, Competitive Strategies, and Industry Risks |
Research Analyst Overview
- The market is undergoing a fundamental re-architecture, driven by the need for greater efficiency and deeper personalization. Core technologies like passenger service systems and tour operator software are being enhanced with artificial intelligence and machine learning, enabling unprecedented levels of automation.
- The deployment of travel ERP systems and integrated travel commerce platforms is streamlining back-office functions, while contactless payment solutions and mobile booking applications are redefining the customer interface. For board-level strategy, the focus on sustainable travel solutions is critical, influencing procurement decisions and brand reputation. Successful implementation of revenue management software, for instance, can improve yield by double-digit percentages.
- The transition to advanced airline and hospitality IT solutions is non-negotiable for legacy carriers and hotel chains looking to compete with digital-native challengers. This requires a strategic approach to modernizing B2B travel distribution channels and customer engagement analytics, with some firms reporting a 12% increase in customer interactions through new messaging hubs.
- Ultimately, creating a secure digital passenger journey through digital identity wallets and a robust decentralized financial platform will differentiate the leaders.
What are the Key Data Covered in this Travel Technologies Market Research and Growth Report?
-
What is the expected growth of the Travel Technologies Market between 2026 and 2030?
-
USD 6.22 billion, at a CAGR of 8.8%
-
-
What segmentation does the market report cover?
-
The report is segmented by Application (Travel industry, Tourism industry, and Hospitality industry), Product (Global distribution system and Airline and hospitality IT solutions), Type (Leisure, Business, and Group) and Geography (North America, Europe, APAC, Middle East and Africa, South America)
-
-
Which regions are analyzed in the report?
-
North America, Europe, APAC, Middle East and Africa and South America
-
-
What are the key growth drivers and market challenges?
-
Surging demand for AI and hyper-personalization, Stringent data privacy and dynamic pricing regulations
-
-
Who are the major players in the Travel Technologies Market?
-
Accelya Group, Airbnb Inc., Amadeus IT Group SA, Booking Holdings Inc., China TravelSky Holding Co Ltd, Expedia Group Inc., GP Solutions GmbH, Hitit Computer Services, Hotelbeds Group, IBS Software Pvt. Ltd., Rezdy Pty Ltd, Sabre Corp., SITA, Tourplan, Travelfusion Ltd, Travelport LP, Traveltek Group Ltd, TrekkSoft AG, TripAdvisor Inc. and Verint Systems Inc.
-
Market Research Insights
- The market's dynamics are shaped by a strategic pivot toward intelligent travel platforms that deliver quantifiable business outcomes. The adoption of data-driven pricing models has enabled some operators to improve revenue yields by over 15% without sacrificing volume. Concurrently, a focus on passenger data security within a frictionless travel experience is paramount.
- The integration of corporate travel booking tools with real-time itinerary adjustments is becoming standard, as enterprises demand greater control and flexibility. By leveraging sophisticated customer data analytics, providers can deliver personalized travel recommendations that increase conversion rates.
- The overarching goal is a cohesive digital travel ecosystem where smart airport initiatives and cloud-native platforms reduce operational friction, with North America alone poised to contribute 32.8% of the market's incremental growth.
We can help! Our analysts can customize this travel technologies market research report to meet your requirements.
 RIA -
RIA - 
