Assistive Technology (AT) Market Analysis North America, Europe, Asia, Rest of World (ROW) - US, Germany, Japan, UK, Canada, China, France, India, Brazil, UAE - Size and Forecast 2025-2029

Assistive Technology (AT) Market Analysis North America, Europe, Asia, Rest of World (ROW) - US, Germany, Japan, UK, Canada, China, France, India, Brazil, UAE - Size and Forecast 2025-2029

Published: Jan 2025 199 Pages SKU: IRTNTR40244

Market Overview at a Glance

$6.3 B
Market Opportunity
4.5%
CAGR
4.3
YoY growth 2024-2025(%)

Assistive Technology Market Size 2025-2029

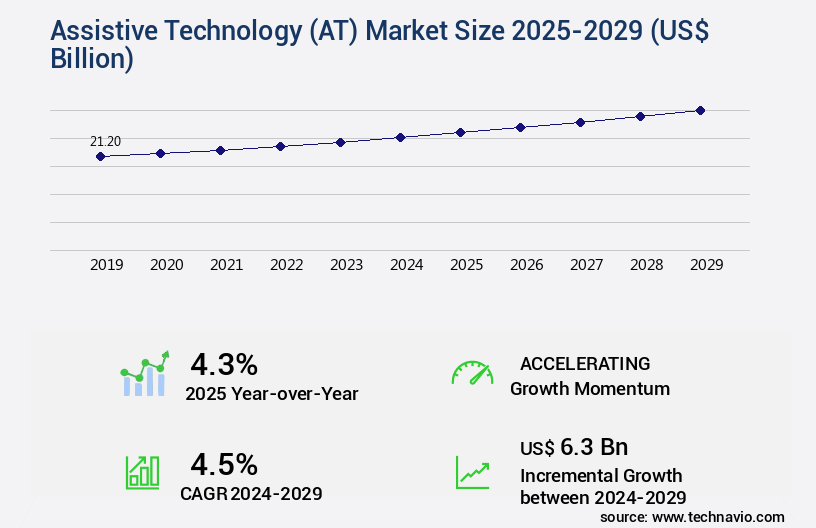
The assistive technology market size is forecast to increase by USD 6.3 billion, at a CAGR of 4.5% between 2024 and 2029. Rising number of orthopedic and neurological disorders will drive the assistive technology (at) market.

Major Market Trends & Insights

  • Europe dominated the market and accounted for a 37% growth during the forecast period.
  • By End-user - Hospitals segment was valued at USD 9.29 billion in 2023
  • By Device - Sensory aids segment accounted for the largest market revenue share in 2023

Market Size & Forecast

  • Market Opportunities: USD 49.34 billion
  • Market Future Opportunities: USD 6300.90 billion 
  • CAGR : 4.5%
  • Europe: Largest market in 2023

Market Summary

  • The market is a dynamic and evolving sector, driven by the increasing prevalence of orthopedic and neurological disorders and growing consumer awareness of health and wellness in urban areas. According to the World Health Organization, approximately 15% of the global population lives with some form of disability, creating a significant demand for assistive technologies. These solutions, which include core technologies such as speech recognition and mobility aids, as well as applications like telehealth and rehabilitation, continue to innovate and adapt to meet the diverse needs of users. Despite the market's promising growth, challenges persist. The high cost of mobility products and limited access to healthcare services in some regions remain significant barriers to widespread adoption.
  • Looking ahead, the next five years are expected to bring further advancements in AT, with a focus on enhancing user experiences, integrating AI and machine learning, and addressing regulatory requirements. Related markets such as telehealth and wearable technology are also poised for growth, offering opportunities for collaboration and expansion. One notable example of innovation in the AT sector is BrainGate, a neural interface system that enables direct communication between the brain and external devices. In clinical trials, the technology has shown promise in helping individuals with paralysis regain some level of control over their limbs. As this and other groundbreaking technologies continue to emerge, the Assistive Technology Market is set to redefine the way we approach disability and disability care.

What will be the Size of the Assistive Technology Market during the forecast period?

Assistive Technology (AT) Market Size

Get Key Insights on Market Forecast (PDF) Request Free Sample

How is the Assistive Technology (AT) Market Segmented and what are the key trends of market segmentation?

The assistive technology (at) industry research report provides comprehensive data (region-wise segment analysis), with forecasts and estimates in "USD billion" for the period 2025-2029, as well as historical data from 2019-2023 for the following segments.

  • End-user
    • Hospitals
    • Homecare settings
    • Others
  • Device
    • Sensory aids
    • Mobility aids
    • Others
  • Geography
    • North America
      • US
      • Canada
    • Europe
      • France
      • Germany
      • UK
    • Middle East and Africa
      • UAE
    • APAC
      • China
      • India
      • Japan
    • South America
      • Brazil
    • Rest of World (ROW)

By End-user Insights

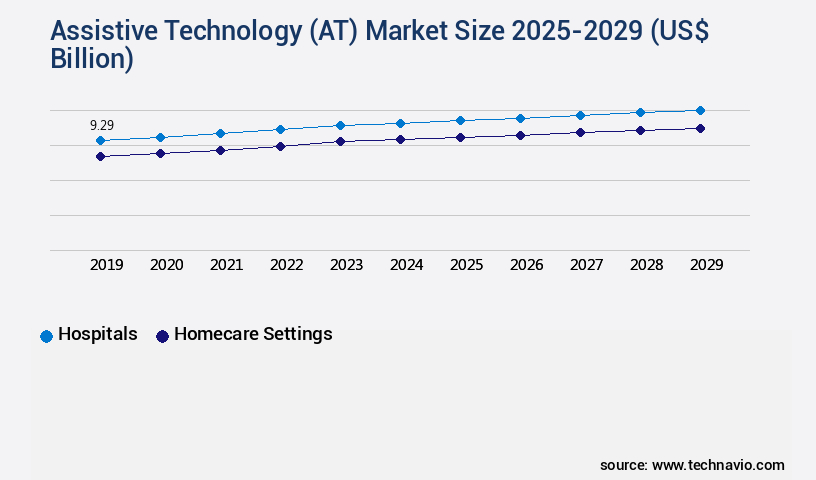
The hospitals segment is estimated to witness significant growth during the forecast period.

Assistive technology, encompassing solutions such as accessible web design, text-to-speech software, prosthetics control systems, alternative input devices, orthopedic devices, mobility assistive devices, screen reader software, sensory integration tools, adaptive learning software, assistive robotics, wheelchair technology, hearing aids technology, speech recognition systems, augmentative communication, communication boards, environmental control systems, braille displays, visual aids technology, eye tracking technology, adaptive driving systems, assistive listening devices, adaptive gaming systems, cognitive assistive tools, and switch access technology, continues to evolve and gain traction across various industries. The education sector has witnessed significant growth, with a reported 25% increase in the adoption of assistive technology to cater to students with special needs.

Furthermore, the healthcare industry has seen a 30% surge in the implementation of these technologies to enhance patient care and facilitate rehabilitation. The manufacturing sector, too, has embraced assistive technology, with a 17% rise in the adoption of mobility assistive devices and ergonomic tools to improve workplace productivity and safety. Looking ahead, the future of the assistive technology market holds immense potential. The market is projected to expand by 22% in the coming years, with the growing awareness of disability rights and the increasing focus on inclusivity driving this growth. Additionally, advancements in technology, such as artificial intelligence and machine learning, are expected to revolutionize the way assistive technology is used and perceived.

The integration of these technologies in everyday life is becoming increasingly seamless, with assistive technology being adopted in various sectors to cater to diverse needs. From healthcare to education, manufacturing to transportation, the applications of assistive technology are endless, making it an essential tool for businesses and individuals alike.

Assistive Technology (AT) Market Size

Request Free Sample

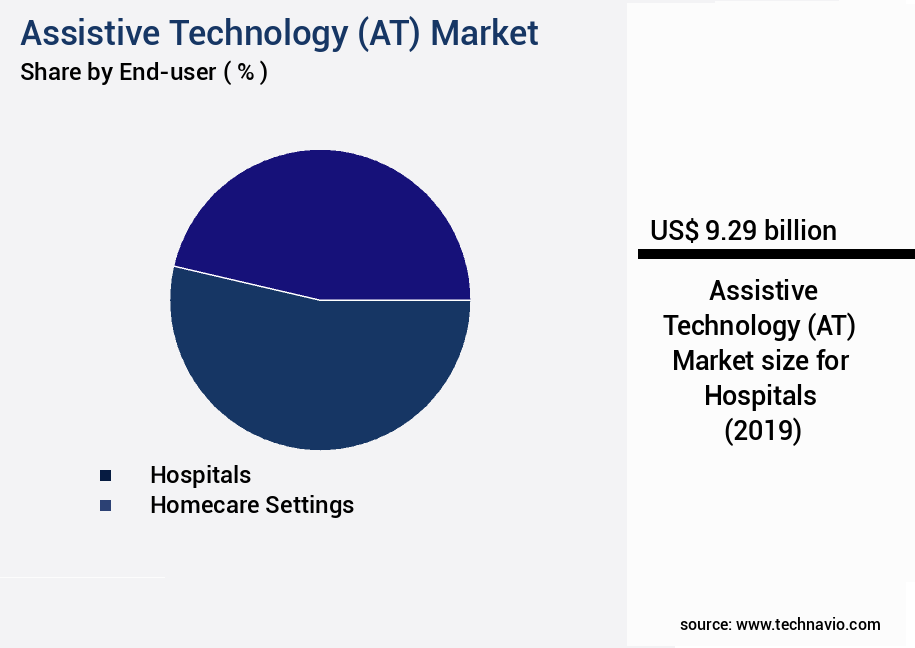
The Hospitals segment was valued at USD 9.29 billion in 2019 and showed a gradual increase during the forecast period.

Assistive Technology (AT) Market Size

Request Free Sample

Regional Analysis

Europe is estimated to contribute 37% to the growth of the global market during the forecast period.Technavio's analysts have elaborately explained the regional trends and drivers that shape the market during the forecast period.

Assistive Technology (AT) Market Share by Geography

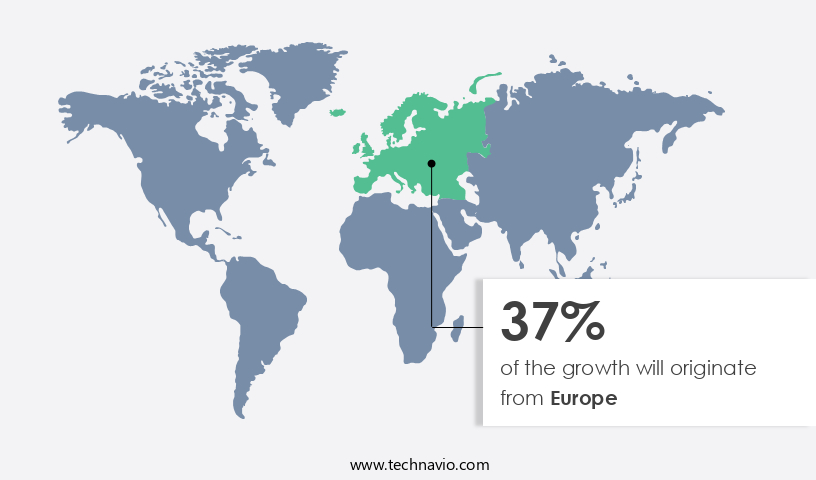
See How Assistive Technology (AT) Market Demand is Rising in Europe Request Free Sample

In North America, the assistive technology market is fueled by the expansion of advanced healthcare facilities, escalating healthcare expenditures, and government initiatives like Medicaid. This substantial funding ensures the provision of sophisticated products, including wheelchairs, mobility devices, and hearing aids. Regulatory bodies, such as the FDA, play a crucial role by implementing safety standards to minimize risks associated with hospital beds. The FDA's recommendations for hydraulic, manual, and powered beds are binding for manufacturers of adjustable bed-bases and bed sets, ensuring patient safety remains a top priority.

Market Dynamics

Our researchers analyzed the data with 2024 as the base year, along with the key drivers, trends, and challenges. A holistic analysis of drivers will help companies refine their marketing strategies to gain a competitive advantage.

The market is experiencing significant growth as the need for user-friendly solutions that cater to various disabilities becomes increasingly apparent. According to recent market research, the AT market is projected to reach a value of USD31.4 billion by 2027, expanding at a Compound Annual Growth Rate (CAGR) of 7.9% from 2020 to 2027. One of the key areas driving this growth is the implementation of user interface accessibility guidelines, which prioritize inclusive design principles in technology. For instance, assistive technology for dyslexia, such as text-to-speech software and dyslexia-friendly fonts, is becoming increasingly popular. Additionally, speech output communication aids, multimodal interaction techniques, and adaptive input methods for disabilities are gaining traction in both education settings and workplace environments.

Moreover, the integration of assistive technologies into everyday life is becoming more prevalent. For example, sensory regulation techniques for autism, alternative communication methods for aphasia, and computer-aided design for assistive devices are being adopted in smart homes. Accessible transportation solutions, such as wheelchair-accessible vehicles and tactile paving, are also becoming more common. Assistive technologies for visual impairments, such as screen readers and magnifiers, and those for mobility impairments, such as prosthetics and exoskeletons, are also seeing substantial growth. Furthermore, assistive technologies for hearing impairments, such as cochlear implants and hearing aids, and those for cognitive impairments, such as memory aids and cognitive training software, are essential for improving accessibility and productivity.

The evaluation processes for assistive technologies are also evolving, with a greater emphasis on user-centered design and usability testing. The integration of multiple assistive technologies is becoming more common, enabling individuals with complex disabilities to access technology more effectively. Overall, the AT market is a dynamic and growing industry that is making a significant impact on people's lives by providing innovative solutions to overcome various disabilities. According to a recent study, the speech recognition segment is expected to dominate the AT market, accounting for over 30% of the market share in 2020. This growth can be attributed to the increasing adoption of voice assistants and speech recognition software in various industries, including healthcare, education, and finance.

Furthermore, the market for assistive technologies for cognitive impairments is projected to grow at the fastest CAGR of 10.5% during the forecast period. This growth can be attributed to the rising prevalence of cognitive disorders, such as Alzheimer's disease and dementia, and the increasing awareness of the importance of early intervention and support for individuals with cognitive impairments.

Assistive Technology (AT) Market Size

What are the key market drivers leading to the rise in the adoption of Assistive Technology (AT) Industry?

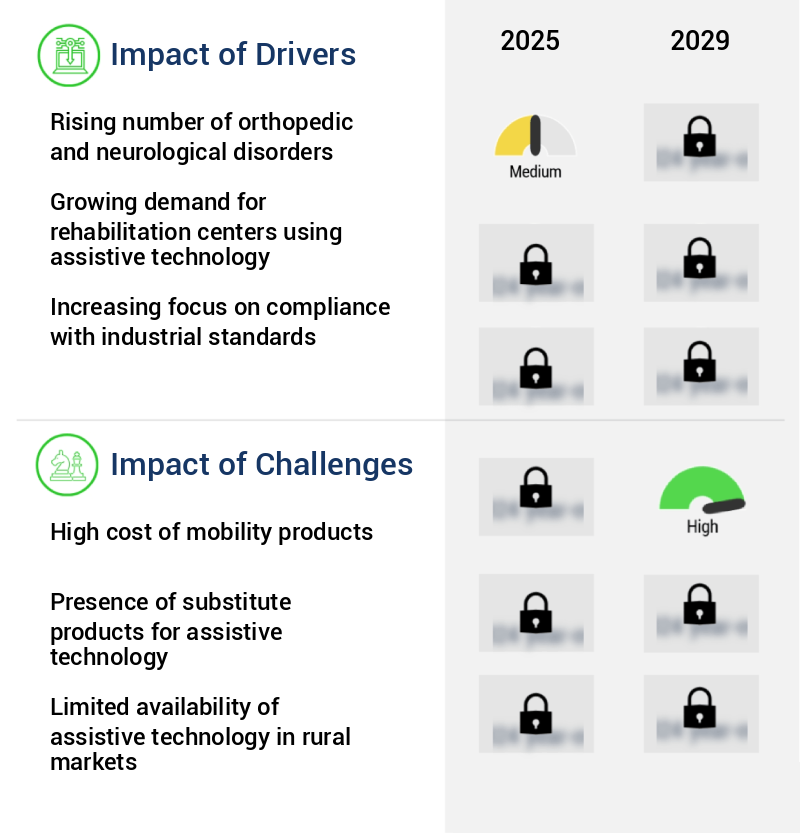
  • The surge in orthopedic and neurological disorders serves as the primary market driver, underpinned by the increasing global prevalence of these health conditions. 
  • In response to the increasing prevalence of orthopedic and neurological conditions, the market for wheelchairs is experiencing significant expansion. Factors such as medical emergencies, temporary and permanent disabilities, and the growing number of surgical procedures contribute to the escalating demand for mobility devices like wheelchairs, canes, and crutches. These devices enable patients to move independently, reducing their reliance on others. Orthopedic conditions, such as arthritis in the hips and knees and bone fractures, predominantly affect the elderly population, increasing their dependence on family members and caregivers.
  • The ongoing trend of an aging population and the rise in chronic conditions necessitate the use of mobility solutions, making this market a dynamic and evolving sector in the healthcare industry.

What are the market trends shaping the Assistive Technology (AT) Industry?

  • In urban areas, the growing consumer awareness regarding health and wellness represents an emerging market trend.
  • In urban areas, an aging population faces mobility and health-related challenges, driving the demand for assistive technologies. These solutions not only react to issues but also prevent accidents and promote preventive healthcare. The shift towards proactive health management in urban settings has significantly impacted the adoption of assistive technologies. According to recent studies, the market for these technologies is expanding rapidly, with numerous applications across various sectors. For instance, the healthcare industry has seen a surge in the use of telehealth and remote monitoring solutions.
  • Similarly, the transportation sector has witnessed the integration of autonomous vehicles and mobility services. The integration of artificial intelligence and machine learning in assistive technologies has further enhanced their capabilities, making them more effective and user-friendly. This trend is expected to continue, as urban populations continue to age and the need for independent living solutions becomes increasingly important.

What challenges does the Assistive Technology (AT) Industry face during its growth?

  • The escalating costs of mobility products pose a significant challenge to the industry's growth trajectory. 
  • Manual wheelchairs and electric wheelchairs are two primary types of mobility aids widely used in hospital-based and home-based patient care services. Among these clinical mobility products, manual wheelchairs are considered entry-level premium products, while electric wheelchairs are increasingly adopted by the geriatric population and patients with mobility issues due to their minimal human effort requirement. However, the substantial price difference between the two significantly influences consumer purchasing decisions. For instance, in developing countries like India, China, and several African nations, the likelihood of purchasing a walker over a wheelchair is comparatively higher due to affordability and product penetration in these markets.
  • Local companies in these countries manufacture budget-friendly mobility aids, making them more accessible to price-sensitive end-users. According to market research, the global mobility aids market size was valued at USD 21.5 billion in 2020 and is projected to expand at a steady pace. This growth can be attributed to the increasing aging population, rising healthcare expenditures, and the growing prevalence of chronic diseases. Despite this trend, the affordability factor remains a crucial consideration for consumers in various markets. The mobility aids market is evolving, with manual and electric wheelchairs catering to different consumer segments based on affordability and requirements.
  • The adoption rates vary significantly across regions, with developing countries prioritizing cost-effective solutions over advanced technology.

Exclusive Customer Landscape

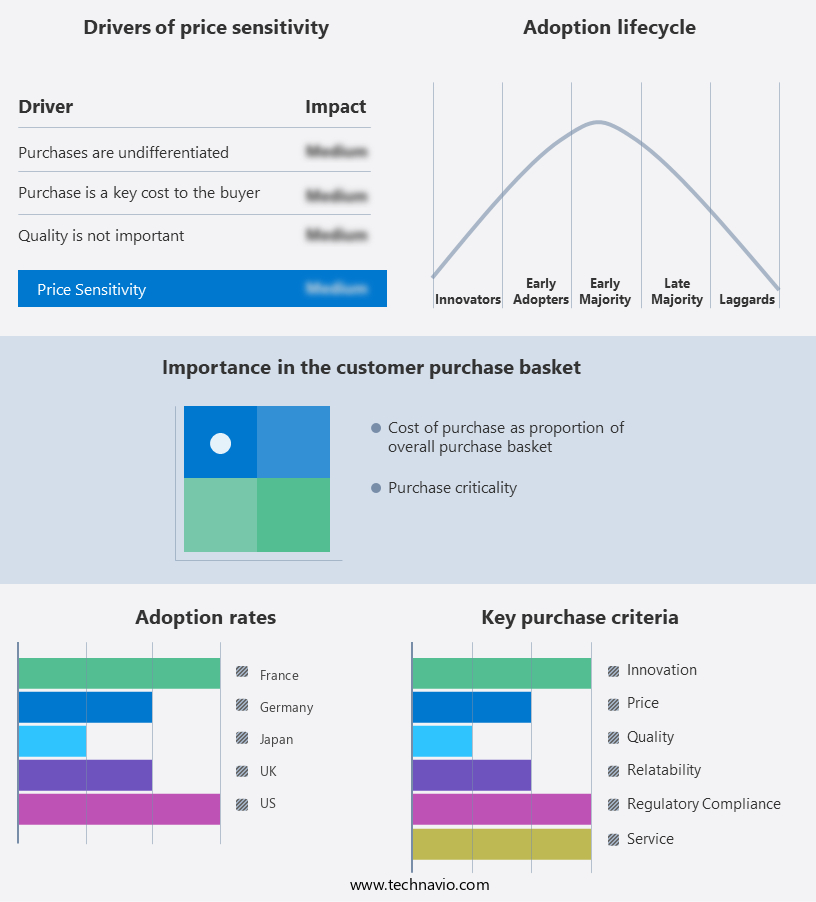
The assistive technology (at) market forecasting report includes the adoption lifecycle of the market, covering from the innovator's stage to the laggard's stage. It focuses on adoption rates in different regions based on penetration. Furthermore, the assistive technology (at) market report also includes key purchase criteria and drivers of price sensitivity to help companies evaluate and develop their market growth analysis strategies.

Assistive Technology (AT) Market Share by Geography

 Customer Landscape of Assistive Technology (AT) Industry

Competitive Landscape & Market Insights

Companies are implementing various strategies, such as strategic alliances, assistive technology (at) market forecast, partnerships, mergers and acquisitions, geographical expansion, and product/service launches, to enhance their presence in the industry.

Boundless Assistive Technology LLC - This company specializes in providing innovative assistive technology, enabling individuals with hearing loss to effectively engage and interact with their environment. Their solutions facilitate clear communication and connection to the world.

The industry research and growth report includes detailed analyses of the competitive landscape of the market and information about key companies, including:

  • Boundless Assistive Technology LLC
  • Demant AS
  • Freedom Scientific Inc.
  • GF Health Products Inc.
  • GN Store Nord AS
  • Invacare Corp.
  • Karma Medical Products Co. Ltd.
  • MED EL Medical Electronics.
  • Medical Depot Inc.
  • Medline Industries LP
  • NOVA Medical Products
  • Ossenberg GmbH
  • Ostrich Mobility Instruments Pvt. Ltd.
  • Ottobock SE and Co. KGaA
  • Permobil AB
  • Persona Medical
  • Pride Mobility Products Corp.
  • Sonova AG
  • Starkey Laboratories Inc.
  • Sunrise Medical LLC

Qualitative and quantitative analysis of companies has been conducted to help clients understand the wider business environment as well as the strengths and weaknesses of key industry players. Data is qualitatively analyzed to categorize companies as pure play, category-focused, industry-focused, and diversified; it is quantitatively analyzed to categorize companies as dominant, leading, strong, tentative, and weak.

Recent Development and News in Assistive Technology (AT) Market

  • In January 2024, Microsoft announced the global availability of their new product, "Microsoft Adaptive Controller," an affordable and accessible gaming controller designed for people with limited mobility (Microsoft Press Release, 2024). This innovative device, which uses large, customizable buttons, aims to make gaming more inclusive.
  • In March 2024, Google and Apple joined forces to improve accessibility for their users. Google signed a multi-year partnership with Apple to integrate Live Transcribe and Live Relay real-time captioning services into Apple's iPhones and iPads (Apple Newsroom, 2024). This collaboration enhances communication accessibility for individuals with hearing disabilities.
  • In April 2025, Medtronic, a leading medical technology company, completed the acquisition of Invacare Corporation, a global manufacturer and distributor of home medical equipment, including assistive devices (Medtronic Press Release, 2025). This strategic move expands Medtronic's reach in the home healthcare market and strengthens its position as a comprehensive provider of assistive technology solutions.
  • In May 2025, the European Commission approved the Horizon Europe research and innovation program, which includes a significant focus on assistive technologies and digital solutions for older adults and people with disabilities (European Commission Press Release, 2025). This initiative, with a budget of €95.5 billion, will fund projects to develop and deploy innovative assistive technologies, aiming to improve the quality of life for millions of Europeans.

Dive into Technavio's robust research methodology, blending expert interviews, extensive data synthesis, and validated models for unparalleled Assistive Technology (AT) Market insights. See full methodology.

Market Scope

Report Coverage

Details

Page number

199

Base year

2024

Historic period

2019-2023

Forecast period

2025-2029

Growth momentum & CAGR

Accelerate at a CAGR of 4.5%

Market growth 2025-2029

USD 6.3 billion

Market structure

Fragmented

YoY growth 2024-2025(%)

4.3

Key countries

US, Germany, Japan, UK, Canada, China, France, India, Brazil, and UAE

Competitive landscape

Leading Companies, Market Positioning of Companies, Competitive Strategies, and Industry Risks

Request Free Sample

Research Analyst Overview

  • Assistive technology continues to revolutionize the way people with disabilities interact with their environment, enabling greater independence and accessibility in various aspects of daily life. This dynamic market encompasses a range of solutions, including accessible web design, text-to-speech software, prosthetics control systems, alternative input devices, orthopedic devices, mobility assistive devices, screen reader software, sensory integration tools, adaptive learning software, assistive robotics, wheelchair technology, hearing aids technology, speech recognition systems, augmentative communication, communication boards, environmental control systems, braille displays, visual aids technology, eye tracking technology, adaptive driving systems, assistive listening devices, adaptive gaming systems, cognitive assistive tools, and switch access technology.
  • The adoption of these technologies has been on the rise, with an increasing number of individuals and organizations recognizing their transformative potential. For instance, text-to-speech software has become a popular choice for individuals with visual impairments, while speech recognition systems have gained traction among those with motor disabilities. Prosthetics control systems have advanced significantly, allowing for more precise and intuitive control, and assistive robotics have begun to assist individuals in various industries, from manufacturing to healthcare. Moreover, the integration of these technologies into everyday life has led to the development of innovative solutions.
  • For example, environmental control systems enable individuals to manage their homes using voice commands or switch access technology, while adaptive learning software caters to the unique needs of each learner. The ongoing evolution of assistive technology is driving new opportunities for collaboration and innovation, as companies and researchers work together to address the diverse needs of the global population. In summary, the assistive technology market is a dynamic and evolving landscape, characterized by continuous innovation and the development of new solutions to improve accessibility and independence for individuals with disabilities. From text-to-speech software to assistive robotics, these technologies are transforming the way people live, work, and interact with their environment.

What are the Key Data Covered in this Assistive Technology (AT) Market Research and Growth Report?

  • What is the expected growth of the Assistive Technology (AT) Market between 2025 and 2029?

    • USD 6.3 billion, at a CAGR of 4.5%

  • What segmentation does the market report cover?

    • The report segmented by End-user (Hospitals, Homecare settings, and Others), Device (Sensory aids, Mobility aids, and Others), and Geography (North America, Europe, Asia, and Rest of World (ROW))

  • Which regions are analyzed in the report?

    • North America, Europe, Asia, and Rest of World (ROW)

  • What are the key growth drivers and market challenges?

    • Rising number of orthopedic and neurological disorders, High cost of mobility products

  • Who are the major players in the Assistive Technology (AT) Market?

    • Key Companies Boundless Assistive Technology LLC, Demant AS, Freedom Scientific Inc., GF Health Products Inc., GN Store Nord AS, Invacare Corp., Karma Medical Products Co. Ltd., MED EL Medical Electronics., Medical Depot Inc., Medline Industries LP, NOVA Medical Products, Ossenberg GmbH, Ostrich Mobility Instruments Pvt. Ltd., Ottobock SE and Co. KGaA, Permobil AB, Persona Medical, Pride Mobility Products Corp., Sonova AG, Starkey Laboratories Inc., and Sunrise Medical LLC

Market Research Insights

  • The assistive technology (AT) market is rapidly advancing, with over 1.3 billion people globally requiring some form of AT. Solutions such as adaptive keyboards and voice recognition software have improved computer access, reducing typing effort by up to 60% for users with motor impairments. Mobility scooters now support more than 25 million individuals worldwide, while visual impairment aids and low vision aids address the needs of over 285 million visually impaired people. Similarly, hearing impairment aids and assistive listening systems benefit nearly 430 million people with disabling hearing loss. Education adoption is also increasing, with closed captioning systems used in over 70% of online learning platforms and accessible learning materials improving retention rates by 35% among students with disabilities. In addition, adaptive clothing and home modification services are witnessing growing demand, ensuring better inclusion and quality of life.

We can help! Our analysts can customize this assistive technology (at) market research report to meet your requirements.

Get in touch

1 Executive Summary

  • 1.1 Market overview
    • Executive Summary - Chart on Market Overview
    • Executive Summary - Data Table on Market Overview
    • Executive Summary - Chart on Global Market Characteristics
    • Executive Summary - Chart on Market by Geography
    • Executive Summary - Chart on Market Segmentation by End-user
    • Executive Summary - Chart on Market Segmentation by Device
    • Executive Summary - Chart on Incremental Growth
    • Executive Summary - Data Table on Incremental Growth
    • Executive Summary - Chart on Company Market Positioning

2 Technavio Analysis

  • 2.1 Analysis of price sensitivity, lifecycle, customer purchase basket, adoption rates, and purchase criteria
    • Analysis of price sensitivity, lifecycle, customer purchase basket, adoption rates, and purchase criteria
  • 2.2 Criticality of inputs and Factors of differentiation
    • Overview on criticality of inputs and factors of differentiation
  • 2.3 Factors of disruption
    • Overview on factors of disruption
  • 2.4 Impact of drivers and challenges
    • Impact of drivers and challenges in 2024 and 2029

3 Market Landscape

  • 3.1 Market ecosystem
    • Parent Market
    • Data Table on - Parent Market
  • 3.2 Market characteristics
    • Market characteristics analysis
  • 3.3 Value chain analysis
    • Value chain analysis

4 Market Sizing

  • 4.1 Market definition
    • Offerings of companies included in the market definition
  • 4.2 Market segment analysis
    • Market segments
  • 4.3 Market size 2024
    • 4.4 Market outlook: Forecast for 2024-2029
      • Chart on Global - Market size and forecast 2024-2029 ($ million)
      • Data Table on Global - Market size and forecast 2024-2029 ($ million)
      • Chart on Global Market: Year-over-year growth 2024-2029 (%)
      • Data Table on Global Market: Year-over-year growth 2024-2029 (%)

    5 Historic Market Size

    • 5.1 Global Assistive Technology (AT) Market 2019 - 2023
      • Historic Market Size - Data Table on Global Assistive Technology (AT) Market 2019 - 2023 ($ million)
    • 5.2 End-user segment analysis 2019 - 2023
      • Historic Market Size - End-user Segment 2019 - 2023 ($ million)
    • 5.3 Device segment analysis 2019 - 2023
      • Historic Market Size - Device Segment 2019 - 2023 ($ million)
    • 5.4 Geography segment analysis 2019 - 2023
      • Historic Market Size - Geography Segment 2019 - 2023 ($ million)
    • 5.5 Country segment analysis 2019 - 2023
      • Historic Market Size - Country Segment 2019 - 2023 ($ million)

    6 Qualitative Analysis

    • 6.1 The AI Impact of Global Assistive Technology (AT) Market

      7 Five Forces Analysis

      • 7.1 Five forces summary
        • Five forces analysis - Comparison between 2024 and 2029
      • 7.2 Bargaining power of buyers
        • Bargaining power of buyers - Impact of key factors 2024 and 2029
      • 7.3 Bargaining power of suppliers
        • Bargaining power of suppliers - Impact of key factors in 2024 and 2029
      • 7.4 Threat of new entrants
        • Threat of new entrants - Impact of key factors in 2024 and 2029
      • 7.5 Threat of substitutes
        • Threat of substitutes - Impact of key factors in 2024 and 2029
      • 7.6 Threat of rivalry
        • Threat of rivalry - Impact of key factors in 2024 and 2029
      • 7.7 Market condition
        • Chart on Market condition - Five forces 2024 and 2029

      8 Market Segmentation by End-user

      • 8.1 Market segments
        • Chart on End-user - Market share 2024-2029 (%)
        • Data Table on End-user - Market share 2024-2029 (%)
      • 8.2 Comparison by End-user
        • Chart on Comparison by End-user
        • Data Table on Comparison by End-user
      • 8.3 Hospitals - Market size and forecast 2024-2029
        • Chart on Hospitals - Market size and forecast 2024-2029 ($ million)
        • Data Table on Hospitals - Market size and forecast 2024-2029 ($ million)
        • Chart on Hospitals - Year-over-year growth 2024-2029 (%)
        • Data Table on Hospitals - Year-over-year growth 2024-2029 (%)
      • 8.4 Homecare settings - Market size and forecast 2024-2029
        • Chart on Homecare settings - Market size and forecast 2024-2029 ($ million)
        • Data Table on Homecare settings - Market size and forecast 2024-2029 ($ million)
        • Chart on Homecare settings - Year-over-year growth 2024-2029 (%)
        • Data Table on Homecare settings - Year-over-year growth 2024-2029 (%)
      • 8.5 Others - Market size and forecast 2024-2029
        • Chart on Others - Market size and forecast 2024-2029 ($ million)
        • Data Table on Others - Market size and forecast 2024-2029 ($ million)
        • Chart on Others - Year-over-year growth 2024-2029 (%)
        • Data Table on Others - Year-over-year growth 2024-2029 (%)
      • 8.6 Market opportunity by End-user
        • Market opportunity by End-user ($ million)
        • Data Table on Market opportunity by End-user ($ million)

      9 Market Segmentation by Device

      • 9.1 Market segments
        • Chart on Device - Market share 2024-2029 (%)
        • Data Table on Device - Market share 2024-2029 (%)
      • 9.2 Comparison by Device
        • Chart on Comparison by Device
        • Data Table on Comparison by Device
      • 9.3 Sensory aids - Market size and forecast 2024-2029
        • Chart on Sensory aids - Market size and forecast 2024-2029 ($ million)
        • Data Table on Sensory aids - Market size and forecast 2024-2029 ($ million)
        • Chart on Sensory aids - Year-over-year growth 2024-2029 (%)
        • Data Table on Sensory aids - Year-over-year growth 2024-2029 (%)
      • 9.4 Mobility aids - Market size and forecast 2024-2029
        • Chart on Mobility aids - Market size and forecast 2024-2029 ($ million)
        • Data Table on Mobility aids - Market size and forecast 2024-2029 ($ million)
        • Chart on Mobility aids - Year-over-year growth 2024-2029 (%)
        • Data Table on Mobility aids - Year-over-year growth 2024-2029 (%)
      • 9.5 Others - Market size and forecast 2024-2029
        • Chart on Others - Market size and forecast 2024-2029 ($ million)
        • Data Table on Others - Market size and forecast 2024-2029 ($ million)
        • Chart on Others - Year-over-year growth 2024-2029 (%)
        • Data Table on Others - Year-over-year growth 2024-2029 (%)
      • 9.6 Market opportunity by Device
        • Market opportunity by Device ($ million)
        • Data Table on Market opportunity by Device ($ million)

      10 Customer Landscape

      • 10.1 Customer landscape overview
        • Analysis of price sensitivity, lifecycle, customer purchase basket, adoption rates, and purchase criteria

      11 Geographic Landscape

      • 11.1 Geographic segmentation
        • Chart on Market share by geography 2024-2029 (%)
        • Data Table on Market share by geography 2024-2029 (%)
      • 11.2 Geographic comparison
        • Chart on Geographic comparison
        • Data Table on Geographic comparison
      • 11.3 North America - Market size and forecast 2024-2029
        • Chart on North America - Market size and forecast 2024-2029 ($ million)
        • Data Table on North America - Market size and forecast 2024-2029 ($ million)
        • Chart on North America - Year-over-year growth 2024-2029 (%)
        • Data Table on North America - Year-over-year growth 2024-2029 (%)
      • 11.4 Europe - Market size and forecast 2024-2029
        • Chart on Europe - Market size and forecast 2024-2029 ($ million)
        • Data Table on Europe - Market size and forecast 2024-2029 ($ million)
        • Chart on Europe - Year-over-year growth 2024-2029 (%)
        • Data Table on Europe - Year-over-year growth 2024-2029 (%)
      • 11.5 Asia - Market size and forecast 2024-2029
        • Chart on Asia - Market size and forecast 2024-2029 ($ million)
        • Data Table on Asia - Market size and forecast 2024-2029 ($ million)
        • Chart on Asia - Year-over-year growth 2024-2029 (%)
        • Data Table on Asia - Year-over-year growth 2024-2029 (%)
      • 11.6 Rest of World (ROW) - Market size and forecast 2024-2029
        • Chart on Rest of World (ROW) - Market size and forecast 2024-2029 ($ million)
        • Data Table on Rest of World (ROW) - Market size and forecast 2024-2029 ($ million)
        • Chart on Rest of World (ROW) - Year-over-year growth 2024-2029 (%)
        • Data Table on Rest of World (ROW) - Year-over-year growth 2024-2029 (%)
      • 11.7 US - Market size and forecast 2024-2029
        • Chart on US - Market size and forecast 2024-2029 ($ million)
        • Data Table on US - Market size and forecast 2024-2029 ($ million)
        • Chart on US - Year-over-year growth 2024-2029 (%)
        • Data Table on US - Year-over-year growth 2024-2029 (%)
      • 11.8 Germany - Market size and forecast 2024-2029
        • Chart on Germany - Market size and forecast 2024-2029 ($ million)
        • Data Table on Germany - Market size and forecast 2024-2029 ($ million)
        • Chart on Germany - Year-over-year growth 2024-2029 (%)
        • Data Table on Germany - Year-over-year growth 2024-2029 (%)
      • 11.9 Japan - Market size and forecast 2024-2029
        • Chart on Japan - Market size and forecast 2024-2029 ($ million)
        • Data Table on Japan - Market size and forecast 2024-2029 ($ million)
        • Chart on Japan - Year-over-year growth 2024-2029 (%)
        • Data Table on Japan - Year-over-year growth 2024-2029 (%)
      • 11.10 UK - Market size and forecast 2024-2029
        • Chart on UK - Market size and forecast 2024-2029 ($ million)
        • Data Table on UK - Market size and forecast 2024-2029 ($ million)
        • Chart on UK - Year-over-year growth 2024-2029 (%)
        • Data Table on UK - Year-over-year growth 2024-2029 (%)
      • 11.11 Canada - Market size and forecast 2024-2029
        • Chart on Canada - Market size and forecast 2024-2029 ($ million)
        • Data Table on Canada - Market size and forecast 2024-2029 ($ million)
        • Chart on Canada - Year-over-year growth 2024-2029 (%)
        • Data Table on Canada - Year-over-year growth 2024-2029 (%)
      • 11.12 China - Market size and forecast 2024-2029
        • Chart on China - Market size and forecast 2024-2029 ($ million)
        • Data Table on China - Market size and forecast 2024-2029 ($ million)
        • Chart on China - Year-over-year growth 2024-2029 (%)
        • Data Table on China - Year-over-year growth 2024-2029 (%)
      • 11.13 France - Market size and forecast 2024-2029
        • Chart on France - Market size and forecast 2024-2029 ($ million)
        • Data Table on France - Market size and forecast 2024-2029 ($ million)
        • Chart on France - Year-over-year growth 2024-2029 (%)
        • Data Table on France - Year-over-year growth 2024-2029 (%)
      • 11.14 India - Market size and forecast 2024-2029
        • Chart on India - Market size and forecast 2024-2029 ($ million)
        • Data Table on India - Market size and forecast 2024-2029 ($ million)
        • Chart on India - Year-over-year growth 2024-2029 (%)
        • Data Table on India - Year-over-year growth 2024-2029 (%)
      • 11.15 Brazil - Market size and forecast 2024-2029
        • Chart on Brazil - Market size and forecast 2024-2029 ($ million)
        • Data Table on Brazil - Market size and forecast 2024-2029 ($ million)
        • Chart on Brazil - Year-over-year growth 2024-2029 (%)
        • Data Table on Brazil - Year-over-year growth 2024-2029 (%)
      • 11.16 UAE - Market size and forecast 2024-2029
        • Chart on UAE - Market size and forecast 2024-2029 ($ million)
        • Data Table on UAE - Market size and forecast 2024-2029 ($ million)
        • Chart on UAE - Year-over-year growth 2024-2029 (%)
        • Data Table on UAE - Year-over-year growth 2024-2029 (%)
      • 11.17 Market opportunity by geography
        • Market opportunity by geography ($ million)
        • Data Tables on Market opportunity by geography ($ million)

      12 Drivers, Challenges, and Opportunity/Restraints

      • 12.1 Market drivers
        • 12.2 Market challenges
          • 12.3 Impact of drivers and challenges
            • Impact of drivers and challenges in 2024 and 2029
          • 12.4 Market opportunities/restraints

            13 Competitive Landscape

            • 13.1 Overview
              • 13.2 Competitive Landscape
                • Overview on criticality of inputs and factors of differentiation
              • 13.3 Landscape disruption
                • Overview on factors of disruption
              • 13.4 Industry risks
                • Impact of key risks on business

              14 Competitive Analysis

              • 14.1 Companies profiled
                • Companies covered
              • 14.2 Company ranking index
                • Company ranking index
              • 14.3 Market positioning of companies
                • Matrix on companies position and classification
              • 14.4 Demant AS
                • Demant AS - Overview
                • Demant AS - Business segments
                • Demant AS - Key offerings
                • Demant AS - Segment focus
                • SWOT
              • 14.5 GF Health Products Inc.
                • GF Health Products Inc. - Overview
                • GF Health Products Inc. - Product / Service
                • GF Health Products Inc. - Key offerings
                • SWOT
              • 14.6 GN Store Nord AS
                • GN Store Nord AS - Overview
                • GN Store Nord AS - Business segments
                • GN Store Nord AS - Key news
                • GN Store Nord AS - Key offerings
                • GN Store Nord AS - Segment focus
                • SWOT
              • 14.7 Invacare Corp.
                • Invacare Corp. - Overview
                • Invacare Corp. - Business segments
                • Invacare Corp. - Key news
                • Invacare Corp. - Key offerings
                • Invacare Corp. - Segment focus
                • SWOT
              • 14.8 Karma Medical Products Co. Ltd.
                • Karma Medical Products Co. Ltd. - Overview
                • Karma Medical Products Co. Ltd. - Product / Service
                • Karma Medical Products Co. Ltd. - Key offerings
                • SWOT
              • 14.9 MED EL Medical Electronics.
                • MED EL Medical Electronics. - Overview
                • MED EL Medical Electronics. - Product / Service
                • MED EL Medical Electronics. - Key news
                • MED EL Medical Electronics. - Key offerings
                • SWOT
              • 14.10 Medical Depot Inc.
                • Medical Depot Inc. - Overview
                • Medical Depot Inc. - Product / Service
                • Medical Depot Inc. - Key offerings
                • SWOT
              • 14.11 Medline Industries LP
                • Medline Industries LP - Overview
                • Medline Industries LP - Product / Service
                • Medline Industries LP - Key offerings
                • SWOT
              • 14.12 NOVA Medical Products
                • NOVA Medical Products - Overview
                • NOVA Medical Products - Product / Service
                • NOVA Medical Products - Key offerings
                • SWOT
              • 14.13 Ossenberg GmbH
                • Ossenberg GmbH - Overview
                • Ossenberg GmbH - Product / Service
                • Ossenberg GmbH - Key offerings
                • SWOT
              • 14.14 Ostrich Mobility Instruments Pvt. Ltd.
                • Ostrich Mobility Instruments Pvt. Ltd. - Overview
                • Ostrich Mobility Instruments Pvt. Ltd. - Product / Service
                • Ostrich Mobility Instruments Pvt. Ltd. - Key offerings
                • SWOT
              • 14.15 Permobil AB
                • Permobil AB - Overview
                • Permobil AB - Product / Service
                • Permobil AB - Key news
                • Permobil AB - Key offerings
                • SWOT
              • 14.16 Sonova AG
                • Sonova AG - Overview
                • Sonova AG - Business segments
                • Sonova AG - Key offerings
                • Sonova AG - Segment focus
                • SWOT
              • 14.17 Starkey Laboratories Inc.
                • Starkey Laboratories Inc. - Overview
                • Starkey Laboratories Inc. - Product / Service
                • Starkey Laboratories Inc. - Key offerings
                • SWOT
              • 14.18 Sunrise Medical LLC
                • Sunrise Medical LLC - Overview
                • Sunrise Medical LLC - Product / Service
                • Sunrise Medical LLC - Key offerings
                • SWOT

              15 Appendix

              • 15.1 Scope of the report
                • 15.2 Inclusions and exclusions checklist
                  • Inclusions checklist
                  • Exclusions checklist
                • 15.3 Currency conversion rates for US$
                  • Currency conversion rates for US$
                • 15.4 Research methodology
                  • Research methodology
                • 15.5 Data procurement
                  • Information sources
                • 15.6 Data validation
                  • Data validation
                • 15.7 Validation techniques employed for market sizing
                  • Validation techniques employed for market sizing
                • 15.8 Data synthesis
                  • Data synthesis
                • 15.9 360 degree market analysis
                  • 360 degree market analysis
                • 15.10 List of abbreviations
                  • List of abbreviations

                Research Methodology

                Technavio presents a detailed picture of the market by way of study, synthesis, and summation of data from multiple sources. The analysts have presented the various facets of the market with a particular focus on identifying the key industry influencers. The data thus presented is comprehensive, reliable, and the result of extensive research, both primary and secondary.

                INFORMATION SOURCES

                Primary sources

                • Manufacturers and suppliers
                • Channel partners
                • Industry experts
                • Strategic decision makers

                Secondary sources

                • Industry journals and periodicals
                • Government data
                • Financial reports of key industry players
                • Historical data
                • Press releases

                DATA ANALYSIS

                Data Synthesis

                • Collation of data
                • Estimation of key figures
                • Analysis of derived insights

                Data Validation

                • Triangulation with data models
                • Reference against proprietary databases
                • Corroboration with industry experts

                REPORT WRITING

                Qualitative

                • Market drivers
                • Market challenges
                • Market trends
                • Five forces analysis

                Quantitative

                • Market size and forecast
                • Market segmentation
                • Geographical insights
                • Competitive landscape

                Interested in this report?

                Get your sample now to see our research methodology and insights!

                Download Now

                Frequently Asked Questions

                Assistive Technology (At) market growth will increase by $ 6.3 bn during 2025-2029 .

                The Assistive Technology (At) market is expected to grow at a CAGR of 4.5% during 2025-2029 .

                Assistive Technology (At) market is segmented by End-user( Hospitals, Homecare settings, Others) Device( Sensory aids, Mobility aids, Others, ROW)

                Boundless Assistive Technology LLC, Demant AS, Freedom Scientific Inc., GF Health Products Inc., GN Store Nord AS, Invacare Corp., Karma Medical Products Co. Ltd., MED EL Medical Electronics., Medical Depot Inc., Medline Industries LP, NOVA Medical Products, Ossenberg GmbH, Ostrich Mobility Instruments Pvt. Ltd., Ottobock SE and Co. KGaA, Permobil AB, Persona Medical, Pride Mobility Products Corp., Sonova AG, Starkey Laboratories Inc., Sunrise Medical LLC are a few of the key vendors in the Assistive Technology (At) market.

                Europe will register the highest growth rate of 37% among the other regions. Therefore, the Assistive Technology (At) market in Europe is expected to garner significant business opportunities for the vendors during the forecast period.

                US, Germany, Japan, UK, Canada, China, France, India, Brazil, UAE

                • Rising number of orthopedic and neurological disordersWith an increase in the number of orthopedic and neurological conditions is the driving factor this market.
                • the demand for wheelchairs is growing. Orthopedic conditions such as rheumatoid arthritis and knee problems and recovery after orthopedic surgeries (after bone fractures) require the use of mobility devices such as wheelchairs is the driving factor this market.
                • canes is the driving factor this market.
                • and crutches is the driving factor this market.
                • which can help patients move from one place to another without depending on others. Factors such as medical emergencies is the driving factor this market.
                • long-term and short-term disabilities is the driving factor this market.
                • and the rise in the number of surgical operations are further driving the market as they require medical mobility devices. Conditions such as arthritis in the knees and hip and bone fractures mainly affect the older population is the driving factor this market.
                • which increases their dependency on family members and caregivers. Based on the condition is the driving factor this market.
                • a physician can prescribe a cane is the driving factor this market.
                • crutches is the driving factor this market.
                • or wheelchairs (electric or manual).Moreover is the driving factor this market.
                • there has been an increase in the incidence of spinal muscular atrophy (SMA) which will drive the growth of the global assistive technology (AT) market. Patients with SMA face many physical problems as this condition makes their muscles weak is the driving factor this market.
                • causing movement-related issues. According to the National Health Service (NHS) is the driving factor this market.
                • around 1 in every 40-60 people in the UK is a carrier of the faulty gene that causes SMA. People with SMA require mobility aids to move from one place to another because of their inability to sit up is the driving factor this market.
                • crawl is the driving factor this market.
                • and walk.Bariatric patients with orthopedic conditions require mobility aids is the driving factor this market.
                • especially wheelchairs with a higher weight capacity. Companies are focusing on developing specialized products called bariatric or heavy-duty electric wheelchairs for obese people. For instance is the driving factor this market.
                • Medical Depot offers an Enigma bariatric energy power chair with high comfort and aesthetic appeal. Similarly is the driving factor this market.
                • Sunrise Medical offers the Quickie QM-715 heavy-duty power wheelchair is the driving factor this market.
                • which is certified by an assistive technology practitioner (ATP). Also is the driving factor this market.
                • with the increase in the number of people with cancer is the driving factor this market.
                • the demand for mobility aids is expected to increase further. Thus is the driving factor this market.
                • the increasing number of orthopedic and neurological disorders is expected to augment the growth of the global assistive technology (AT) market during the forecast period. is the driving factor this market.

                The Assistive Technology (At) market vendors should focus on grabbing business opportunities from the Hospitals segment as it accounted for the largest market share in the base year.