Energy Efficient HVAC Systems Market Size 2025-2029
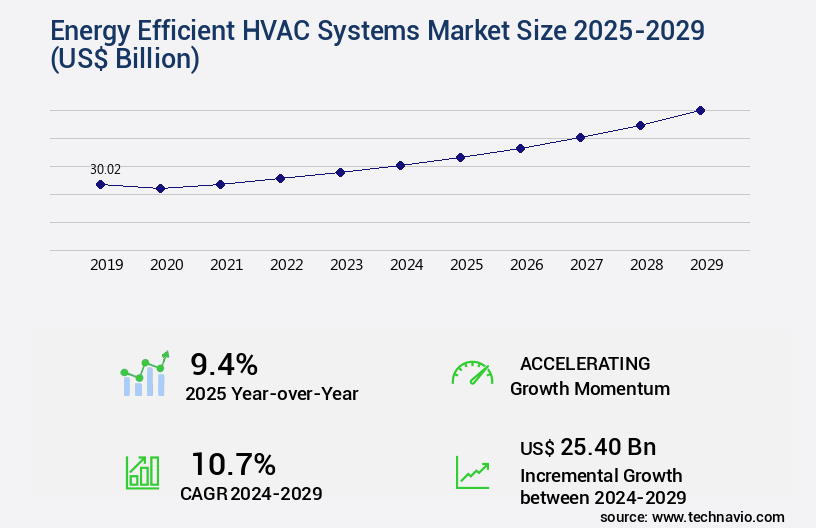
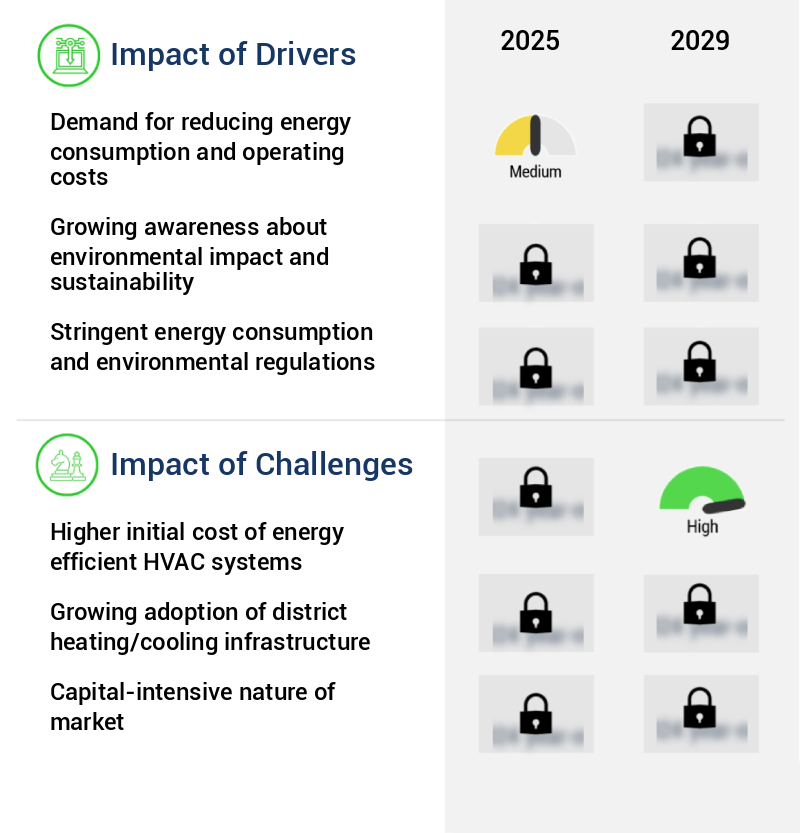
The energy efficient hvac systems market size is valued to increase by USD 25.40 billion, at a CAGR of 10.7% from 2024 to 2029. Demand for reducing energy consumption and operating costs will drive the energy efficient hvac systems market.
Market Insights
- APAC dominated the market and accounted for a 38% growth during the 2025-2029.
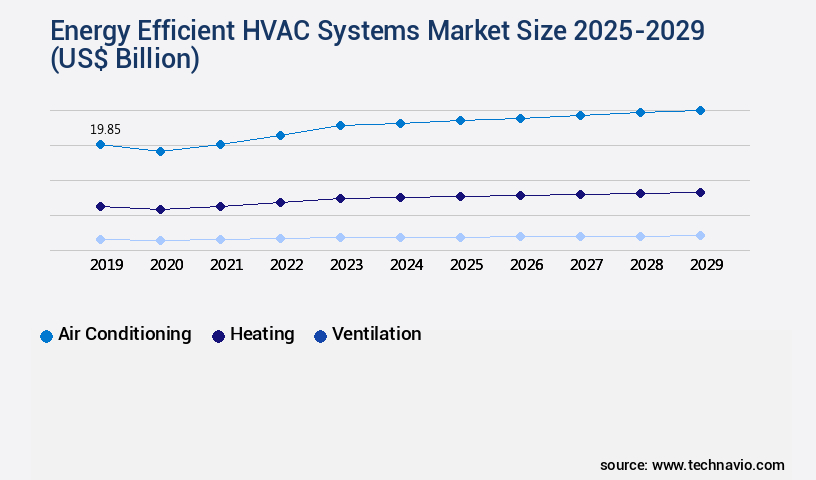
- By Product - Air Conditioning segment was valued at USD 19.85 billion in 2023
- By End-user - Residential segment accounted for the largest market revenue share in 2023
Market Size & Forecast
- Market Opportunities: USD 112.66 billion
- Market Future Opportunities 2024: USD 25.40 billion
- CAGR from 2024 to 2029 : 10.7%
Market Summary
- The market is driven by the global push towards reducing energy consumption and operating costs. This trend is particularly prominent in industries with large HVAC installations, such as commercial and industrial sectors. One real-world business scenario illustrating this trend is a manufacturing plant that optimizes its supply chain by investing in energy-efficient HVAC systems. By improving operational efficiency and reducing energy usage, the plant can lower its carbon footprint and save on utility bills. Another significant development in the market is the growing adoption of R32 refrigerant in air conditioning systems.
- R32 is a more energy-efficient alternative to traditional refrigerants, offering a lower global warming potential and improved cooling capacity. However, the higher initial cost of energy-efficient HVAC systems can be a barrier to entry for some businesses. Despite this challenge, the long-term savings and environmental benefits make energy-efficient HVAC systems an attractive investment for forward-thinking organizations.
What will be the size of the Energy Efficient HVAC Systems Market during the forecast period?

Get Key Insights on Market Forecast (PDF) Request Free Sample
- The market continues to evolve, driven by increasing demand for sustainable and cost-effective climate control solutions. One notable trend is the integration of advanced controls, such as real-time energy monitoring, variable speed fans, and occupancy sensing, which enable companies to optimize energy usage and reduce operational costs. For instance, implementing advanced controls can lead to an average energy savings of 10-30% compared to traditional HVAC systems. This trend is particularly relevant for businesses seeking to improve their bottom line and adhere to sustainability standards. Moreover, the adoption of energy modeling software, building envelope design, and HVAC optimization strategies further enhances energy efficiency.
- By focusing on system redundancy design, load shedding strategies, and commissioning processes, companies can ensure their HVAC systems operate at peak performance while minimizing energy waste. Additionally, the use of high-efficiency motors, water-cooled chillers, and absorption chillers contributes to energy savings and reduced carbon emissions. These strategies not only help businesses save on energy costs but also contribute to a greener and more sustainable built environment.
Unpacking the Energy Efficient HVAC Systems Market Landscape
HVAC systems with energy efficiency at their core have gained significant traction in commercial and industrial buildings, outpacing traditional systems in various aspects. Energy audits reveal that HVAC systems account for nearly 40% of a building's energy consumption, making their optimization crucial for cost reduction and ROI improvement.
Heat transfer coefficient enhancements in HVAC systems, such as in direct expansion systems and heat pump systems, have led to a 20% increase in thermal efficiency. Cooling tower efficiency improvements, achieved through chiller plant optimization and variable speed drives, have resulted in a 15% reduction in water usage.
Building automation systems, including demand-controlled ventilation and smart thermostats, facilitate HVAC zoning control and optimize energy usage based on occupancy and thermal comfort requirements. Energy Star certification for HVAC systems and air handling units ensures compliance with energy efficiency standards and contributes to a building's sustainability goals.
Energy recovery ventilators, humidity control systems, and air filtration systems contribute to maintaining indoor air quality while minimizing energy waste. Coil selection, maintenance schedules, insulation materials, and ductwork design also play essential roles in enhancing HVAC system efficiency.
Geothermal heat pumps and inverter drive technology further boost system reliability and efficiency, making energy-efficient HVAC systems a smart investment for businesses.
Key Market Drivers Fueling Growth
The market is propelled forward by the imperative demand for energy savings and cost reduction.
- The market is experiencing significant growth due to the increasing demand for energy savings and cost reduction in various sectors. In residential, commercial, and industrial buildings, heating, cooling, and climate control technologies consume a substantial amount of energy. Fossil fuels, including heating oil, natural gas, and coal, are commonly used for space heating, contributing to increased operational expenses. To address this issue, energy efficient HVAC systems are gaining popularity. According to recent studies, implementing energy-efficient HVAC systems can result in energy use reduction by up to 12%, leading to substantial cost savings.
- Additionally, these systems contribute to improved indoor air quality and enhanced comfort levels. As a result, the adoption of energy-efficient HVAC systems is forecasted to increase in various industries, including healthcare, education, and hospitality, where energy management is a critical concern.
Prevailing Industry Trends & Opportunities
The use of R32 refrigerant in air conditioning systems is becoming increasingly prevalent, marking a notable market trend.
- The market is experiencing significant evolution, driven by the increasing demand for sustainable and cost-effective cooling solutions across various sectors. Traditional refrigerants, such as chlorofluorocarbons (CFCs) and hydrochlorofluorocarbons (HCFCs), are being replaced with advanced, low Global Warming Potential (GWP) alternatives. One notable trend in the Variable Refrigerant Flow (VRF) systems market is the growing preference for these low GWP refrigerants.
- This shift towards energy efficiency is spurring innovation among HVAC manufacturers, resulting in products that optimize refrigerant usage while maintaining high performance. For instance, some systems have reported energy savings up to 30%, leading to substantial cost reductions for businesses. This trend is expected to fuel the demand for VRF systems worldwide.
Significant Market Challenges
The higher initial cost of energy-efficient HVAC (Heating, Ventilation, and Air Conditioning) systems represents a significant challenge to the industry's growth, as businesses and consumers must weigh this expense against long-term energy savings and environmental benefits.
- The market is witnessing significant growth due to the increasing focus on energy savings, cost reduction, and emission mitigation. According to industry estimates, energy efficient HVAC systems can lead to operational cost savings of up to 15%, making them an attractive investment for businesses. Furthermore, these systems contribute to a reduction in greenhouse gas emissions, aligning with global sustainability goals. However, the higher initial cost of energy efficient HVAC systems remains a barrier to entry for many organizations. The average cost difference between high-efficiency and conventional HVAC systems can range from 10% to 30%.
- Despite this challenge, the long-term energy savings and environmental benefits make energy efficient HVAC systems a worthwhile investment for businesses in various sectors, including commercial, industrial, and residential.

In-Depth Market Segmentation: Energy Efficient HVAC Systems Market
The energy efficient hvac systems industry research report provides comprehensive data (region-wise segment analysis), with forecasts and estimates in "USD billion" for the period 2025-2029, as well as historical data from 2019-2023 for the following segments.
- Product
- Air Conditioning
- Heating
- Ventilation
- End-user
- Residential
- Commercial
- Industrial
- Technology Specificity
- Inverter Technology
- IoT-Enabled Systems
- Variable Refrigerant Flow
- Distribution Channel
- Direct Sales
- Distributors
- Online Retail
- Geography
- North America
- Europe
- France
- Germany
- Italy
- Spain
- UK
- Middle East and Africa
- APAC
- Australia
- China
- India
- Japan
- South Korea
- South America
- Rest of World (ROW)
By Product Insights
The air conditioning segment is estimated to witness significant growth during the forecast period.
The market continues to evolve, driven by the increasing focus on reducing energy consumption and improving indoor air quality. HVAC systems, including air conditioning, play a crucial role in maintaining thermal comfort in buildings. Energy audits and HVAC commissioning are essential for optimizing energy use and identifying areas for improvement. Key components, such as heat transfer coefficient in cooling towers, compressor efficiency, and variable speed drives in building automation systems, significantly impact system performance. Energy recovery ventilators, air filtration systems, and smart thermostats enhance indoor air quality and contribute to demand-controlled ventilation. Heat pump systems, including variable refrigerant flow and geothermal heat pumps, offer high energy efficiency.
Proper coil selection, maintenance schedules, and insulation materials are crucial for system reliability. Building energy modeling, HVAC zoning control, and inverter drive technology further optimize energy usage. A notable achievement in the market is the increasing adoption of Energy Star certified products, which have reduced energy consumption by up to 40% compared to standard systems. Air handling units, ductwork design, and refrigerant charge optimization are other critical aspects of energy-efficient HVAC systems.

Request Free Sample
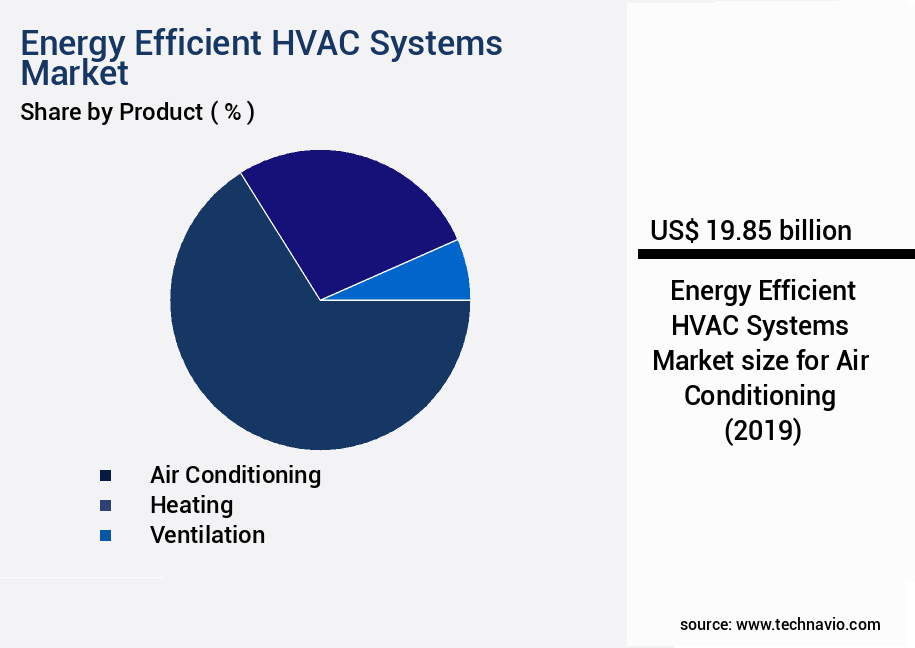
The Air Conditioning segment was valued at USD 19.85 billion in 2019 and showed a gradual increase during the forecast period.

Request Free Sample
Regional Analysis
APAC is estimated to contribute 38% to the growth of the global market during the forecast period.Technavio’s analysts have elaborately explained the regional trends and drivers that shape the market during the forecast period.

See How Energy Efficient HVAC Systems Market Demand is Rising in APAC Request Free Sample
The market in APAC is experiencing significant growth, driven by the region's expanding population, extreme climatic conditions, and increasing urbanization. With the rise in commercial and residential construction activities, the demand for heating, ventilation, and air conditioning (HVAC) systems is surging. This trend is particularly pronounced in countries like China and India, where green building initiatives are gaining momentum. The adoption of energy-efficient HVAC systems is a key component of these initiatives, as they help reduce energy consumption and lower operational costs.
According to industry estimates, energy efficient HVAC systems accounted for over 50% of the total HVAC systems market in APAC in 2020. Furthermore, the use of advanced heating and cooling solutions in commercial buildings, such as malls, office buildings, and manufacturing facilities, is expected to fuel the demand for energy efficient HVAC systems in the coming years.

Customer Landscape of Energy Efficient HVAC Systems Industry
Competitive Intelligence by Technavio Analysis: Leading Players in the Energy Efficient HVAC Systems Market
Companies are implementing various strategies, such as strategic alliances, energy efficient hvac systems market forecast, partnerships, mergers and acquisitions, geographical expansion, and product/service launches, to enhance their presence in the industry.
Bosch Thermotechnology - The company specializes in energy-efficient HVAC solutions, including air conditioners, heat pumps, gas furnaces, and air handlers, designed for optimal residential comfort and energy savings. These systems prioritize efficiency, reducing homeowners' carbon footprint and utility bills.
The industry research and growth report includes detailed analyses of the competitive landscape of the market and information about key companies, including:
- Bosch Thermotechnology
- Carrier Corporation
- Daikin Industries
- Danfoss
- Emerson Electric
- Fujitsu General
- Goodman Manufacturing
- Honeywell International
- Ingersoll Rand
- Johnson Controls
- LG Electronics
- Lennox International
- Midea Group
- Mitsubishi Electric
- Nortek Global HVAC
- Panasonic Corporation
- Rheem Manufacturing
- Samsung Electronics
- Trane Technologies
- Toshiba Carrier
Qualitative and quantitative analysis of companies has been conducted to help clients understand the wider business environment as well as the strengths and weaknesses of key industry players. Data is qualitatively analyzed to categorize companies as pure play, category-focused, industry-focused, and diversified; it is quantitatively analyzed to categorize companies as dominant, leading, strong, tentative, and weak.
Recent Development and News in Energy Efficient HVAC Systems Market
- In August 2024, Carrier Global Corporation, a leading HVAC manufacturer, announced the launch of its new line of energy-efficient, water-source heat pumps, the AquaEdge 19DV. These innovative systems boast a Seasonal Energy Efficiency Ratio (SEER) of up to 23.5, making them one of the most efficient HVAC solutions on the market (Carrier Global Corporation Press Release, August 2024).
- In November 2024, Schneider Electric, a leading energy management and automation company, entered into a strategic partnership with Daikin Industries, a major HVAC manufacturer. The collaboration aimed to integrate Schneider Electric's EcoStruxure building platform with Daikin's energy-efficient HVAC systems, offering enhanced energy management and optimization (Schneider Electric Press Release, November 2024).
- In March 2025, Johnson Controls, a leading global provider of smart buildings, announced the acquisition of Blue Hawk Energy Services, a cooperative of independent HVAC contractors. This strategic move expanded Johnson Controls' reach and capabilities in the energy-efficient HVAC market, enabling them to offer more comprehensive services to their clients (Johnson Controls Press Release, March 2025).
- In May 2025, the European Union passed the new Energy Performance of Buildings Directive (EPBD), which mandates the installation of energy-efficient HVAC systems in all new and renovated buildings. The directive is expected to significantly boost the demand for energy-efficient HVAC systems in Europe (European Parliament Press Release, May 2025).
Dive into Technavio’s robust research methodology, blending expert interviews, extensive data synthesis, and validated models for unparalleled Energy Efficient HVAC Systems Market insights. See full methodology.
Market Scope
|
Report Coverage
|
Details
|
Page number
|
207
|
Base year
|
2024
|
Historic period
|
2019-2023 |
Forecast period
|
2025-2029
|
Growth momentum & CAGR
|
Accelerate at a CAGR of 10.7%
|
Market growth 2025-2029
|
USD 25.40 billion
|
Market structure
|
Fragmented
|
YoY growth 2024-2025(%)
|
9.4
|
Key countries
|
US, China, Germany, Japan, UK, Australia, India, France, Brazil, UAE, Rest of World (ROW), Saudi Arabia, France, South Korea, Mexico, Italy, and Spain
|
Competitive landscape
|
Leading Companies, Market Positioning of Companies, Competitive Strategies, and Industry Risks
|
Request Free Sample
Why Choose Technavio for Energy Efficient HVAC Systems Market Insights?
"Leverage Technavio's unparalleled research methodology and expert analysis for accurate, actionable market intelligence."
The market is experiencing significant growth as building owners and operators seek to reduce energy consumption and improve indoor environmental quality. One key trend in this market is the optimization of variable refrigerant flow (VRF) system design, which can lead to substantial energy savings. However, integrating these systems with building automation systems poses challenges that require careful planning and coordination.
Another area of focus is the energy efficiency improvements in heat pump systems, which are becoming increasingly popular due to their ability to provide both heating and cooling. Demand controlled ventilation systems and energy recovery ventilators are also gaining traction, with performance metrics such as airflow rates and pressure drops playing a crucial role in their design and implementation.
HVAC commissioning best practices are essential to ensure the efficient operation of energy-saving systems. These practices include refrigerant charge optimization, variable speed drive application in HVAC systems, and air handling unit design for optimal airflow. Smart thermostat energy saving algorithms and building energy modeling software comparison are also important tools for operational planning and supply chain management.
High efficiency chiller plant operation strategies, thermal energy storage system design considerations, and indirect expansion system capacity calculations are key considerations for large-scale commercial and industrial applications. Air filtration system selection criteria and thermal comfort analysis and design are also critical factors in creating healthy and productive indoor environments.
Predictive maintenance strategies for HVAC systems, such as heat transfer coefficient calculations in HVAC and indoor air quality monitoring and improvement, can help prevent costly repairs and downtime. Overall, the market is expected to grow at a robust rate compared to traditional systems, offering significant opportunities for businesses to reduce energy costs and improve sustainability.
What are the Key Data Covered in this Energy Efficient HVAC Systems Market Research and Growth Report?
-
What is the expected growth of the Energy Efficient HVAC Systems Market between 2025 and 2029?
-
What segmentation does the market report cover?
-
The report is segmented by Product (Air Conditioning, Heating, and Ventilation), End-user (Residential, Commercial, and Industrial), Geography (APAC, North America, Europe, South America, and Middle East and Africa), Technology Specificity (Inverter Technology, IoT-Enabled Systems, and Variable Refrigerant Flow), and Distribution Channel (Direct Sales, Distributors, and Online Retail)
-
Which regions are analyzed in the report?
-
APAC, North America, Europe, South America, and Middle East and Africa
-
What are the key growth drivers and market challenges?
-
Who are the major players in the Energy Efficient HVAC Systems Market?
-
Bosch Thermotechnology, Carrier Corporation, Daikin Industries, Danfoss, Emerson Electric, Fujitsu General, Goodman Manufacturing, Honeywell International, Ingersoll Rand, Johnson Controls, LG Electronics, Lennox International, Midea Group, Mitsubishi Electric, Nortek Global HVAC, Panasonic Corporation, Rheem Manufacturing, Samsung Electronics, Trane Technologies, and Toshiba Carrier
We can help! Our analysts can customize this energy efficient hvac systems market research report to meet your requirements.
Get in touch
1 Executive Summary
- 1.1 Market overview
- Executive Summary - Chart on Market Overview
- Executive Summary - Data Table on Market Overview
- Executive Summary - Chart on Global Market Characteristics
- Executive Summary - Chart on Market by Geography
- Executive Summary - Chart on Market Segmentation by Product
- Executive Summary - Chart on Market Segmentation by End-user
- Executive Summary - Chart on Incremental Growth
- Executive Summary - Data Table on Incremental Growth
- Executive Summary - Chart on Company Market Positioning
2 Technavio Analysis
- 2.1 Analysis of price sensitivity, lifecycle, customer purchase basket, adoption rates, and purchase criteria
- Analysis of price sensitivity, lifecycle, customer purchase basket, adoption rates, and purchase criteria
- 2.2 Criticality of inputs and Factors of differentiation
- Overview on criticality of inputs and factors of differentiation
- 2.3 Factors of disruption
- Overview on factors of disruption
- 2.4 Impact of drivers and challenges
- Impact of drivers and challenges in 2024 and 2029
3 Market Landscape
- 3.1 Market ecosystem
- Parent Market
- Data Table on - Parent Market
- 3.2 Market characteristics
- Market characteristics analysis
4 Market Sizing
- 4.1 Market definition
- Offerings of companies included in the market definition
- 4.2 Market segment analysis
- 4.4 Market outlook: Forecast for 2024-2029
- Chart on Global - Market size and forecast 2024-2029 ($ million)
- Data Table on Global - Market size and forecast 2024-2029 ($ million)
- Chart on Global Market: Year-over-year growth 2024-2029 (%)
- Data Table on Global Market: Year-over-year growth 2024-2029 (%)
5 Historic Market Size
- 5.1 Global Energy Efficient HVAC Systems Market 2019 - 2023
- Historic Market Size - Data Table on Global Energy Efficient HVAC Systems Market 2019 - 2023 ($ million)
- 5.2 Product segment analysis 2019 - 2023
- Historic Market Size - Product Segment 2019 - 2023 ($ million)
- 5.3 End-user segment analysis 2019 - 2023
- Historic Market Size - End-user Segment 2019 - 2023 ($ million)
- 5.4 Geography segment analysis 2019 - 2023
- Historic Market Size - Geography Segment 2019 - 2023 ($ million)
- 5.5 Country segment analysis 2019 - 2023
- Historic Market Size - Country Segment 2019 - 2023 ($ million)
6 Qualitative Analysis
- 6.1 The AI impact on Global Energy Efficient HVAC Systems Market
7 Five Forces Analysis
- 7.1 Five forces summary
- Five forces analysis - Comparison between 2024 and 2029
- 7.2 Bargaining power of buyers
- Bargaining power of buyers - Impact of key factors 2024 and 2029
- 7.3 Bargaining power of suppliers
- Bargaining power of suppliers - Impact of key factors in 2024 and 2029
- 7.4 Threat of new entrants
- Threat of new entrants - Impact of key factors in 2024 and 2029
- 7.5 Threat of substitutes
- Threat of substitutes - Impact of key factors in 2024 and 2029
- 7.6 Threat of rivalry
- Threat of rivalry - Impact of key factors in 2024 and 2029
- 7.7 Market condition
- Chart on Market condition - Five forces 2024 and 2029
8 Market Segmentation by Product
- 8.1 Market segments
- Chart on Product - Market share (2024-2029) (%)
- Data Table on Product - Market share (2024-2029) (%)
- 8.2 Comparison by Product
- Chart on Comparison by Product
- Data Table on Comparison by Product
- 8.3 Air Conditioning - Market size and forecast (2024-2029)
- Chart on Air Conditioning - Market size and forecast (2024-2029) ($ million)
- Data Table on Air Conditioning - Market size and forecast (2024-2029) ($ million)
- Chart on Air Conditioning - Year-over-year growth (2024-2029) (%)
- Data Table on Air Conditioning - Year-over-year growth (2024-2029) (%)
- 8.4 Heating - Market size and forecast (2024-2029)
- Chart on Heating - Market size and forecast (2024-2029) ($ million)
- Data Table on Heating - Market size and forecast (2024-2029) ($ million)
- Chart on Heating - Year-over-year growth (2024-2029) (%)
- Data Table on Heating - Year-over-year growth (2024-2029) (%)
- 8.5 Ventilation - Market size and forecast (2024-2029)
- Chart on Ventilation - Market size and forecast (2024-2029) ($ million)
- Data Table on Ventilation - Market size and forecast (2024-2029) ($ million)
- Chart on Ventilation - Year-over-year growth (2024-2029) (%)
- Data Table on Ventilation - Year-over-year growth (2024-2029) (%)
- 8.6 Market opportunity by Product
- Market opportunity by Product ($ million)
- Data Table on Market opportunity by Product ($ million)
9 Market Segmentation by End-user
- 9.1 Market segments
- Chart on End-user - Market share (2024-2029) (%)
- Data Table on End-user - Market share (2024-2029) (%)
- 9.2 Comparison by End-user
- Chart on Comparison by End-user
- Data Table on Comparison by End-user
- 9.3 Residential - Market size and forecast (2024-2029)
- Chart on Residential - Market size and forecast (2024-2029) ($ million)
- Data Table on Residential - Market size and forecast (2024-2029) ($ million)
- Chart on Residential - Year-over-year growth (2024-2029) (%)
- Data Table on Residential - Year-over-year growth (2024-2029) (%)
- 9.4 Commercial - Market size and forecast (2024-2029)
- Chart on Commercial - Market size and forecast (2024-2029) ($ million)
- Data Table on Commercial - Market size and forecast (2024-2029) ($ million)
- Chart on Commercial - Year-over-year growth (2024-2029) (%)
- Data Table on Commercial - Year-over-year growth (2024-2029) (%)
- 9.5 Industrial - Market size and forecast (2024-2029)
- Chart on Industrial - Market size and forecast (2024-2029) ($ million)
- Data Table on Industrial - Market size and forecast (2024-2029) ($ million)
- Chart on Industrial - Year-over-year growth (2024-2029) (%)
- Data Table on Industrial - Year-over-year growth (2024-2029) (%)
- 9.6 Market opportunity by End-user
- Market opportunity by End-user ($ million)
- Data Table on Market opportunity by End-user ($ million)
10 Market Segmentation by Technology Specificity
- 10.1 Market segments
- Chart on Technology Specificity - Market share (2024-2029) (%)
- Data Table on Technology Specificity - Market share (2024-2029) (%)
- 10.2 Comparison by Technology Specificity
- Chart on Comparison by Technology Specificity
- Data Table on Comparison by Technology Specificity
- 10.3 Inverter Technology - Market size and forecast (2024-2029)
- Chart on Inverter Technology - Market size and forecast (2024-2029) ($ million)
- Data Table on Inverter Technology - Market size and forecast (2024-2029) ($ million)
- Chart on Inverter Technology - Year-over-year growth (2024-2029) (%)
- Data Table on Inverter Technology - Year-over-year growth (2024-2029) (%)
- 10.4 IoT-Enabled Systems - Market size and forecast (2024-2029)
- Chart on IoT-Enabled Systems - Market size and forecast (2024-2029) ($ million)
- Data Table on IoT-Enabled Systems - Market size and forecast (2024-2029) ($ million)
- Chart on IoT-Enabled Systems - Year-over-year growth (2024-2029) (%)
- Data Table on IoT-Enabled Systems - Year-over-year growth (2024-2029) (%)
- 10.5 Variable Refrigerant Flow - Market size and forecast (2024-2029)
- Chart on Variable Refrigerant Flow - Market size and forecast (2024-2029) ($ million)
- Data Table on Variable Refrigerant Flow - Market size and forecast (2024-2029) ($ million)
- Chart on Variable Refrigerant Flow - Year-over-year growth (2024-2029) (%)
- Data Table on Variable Refrigerant Flow - Year-over-year growth (2024-2029) (%)
- 10.6 Market opportunity by Technology Specificity
- Market opportunity by Technology Specificity ($ million)
- Data Table on Market opportunity by Technology Specificity ($ million)
11 Market Segmentation by Distribution Channel
- 11.1 Market segments
- Chart on Distribution Channel - Market share (2024-2029) (%)
- Data Table on Distribution Channel - Market share (2024-2029) (%)
- 11.2 Comparison by Distribution Channel
- Chart on Comparison by Distribution Channel
- Data Table on Comparison by Distribution Channel
- 11.3 Direct Sales - Market size and forecast (2024-2029)
- Chart on Direct Sales - Market size and forecast (2024-2029) ($ million)
- Data Table on Direct Sales - Market size and forecast (2024-2029) ($ million)
- Chart on Direct Sales - Year-over-year growth (2024-2029) (%)
- Data Table on Direct Sales - Year-over-year growth (2024-2029) (%)
- 11.4 Distributors - Market size and forecast (2024-2029)
- Chart on Distributors - Market size and forecast (2024-2029) ($ million)
- Data Table on Distributors - Market size and forecast (2024-2029) ($ million)
- Chart on Distributors - Year-over-year growth (2024-2029) (%)
- Data Table on Distributors - Year-over-year growth (2024-2029) (%)
- 11.5 Online Retail - Market size and forecast (2024-2029)
- Chart on Online Retail - Market size and forecast (2024-2029) ($ million)
- Data Table on Online Retail - Market size and forecast (2024-2029) ($ million)
- Chart on Online Retail - Year-over-year growth (2024-2029) (%)
- Data Table on Online Retail - Year-over-year growth (2024-2029) (%)
- 11.6 Market opportunity by Distribution Channel
- Market opportunity by Distribution Channel ($ million)
- Data Table on Market opportunity by Distribution Channel ($ million)
12 Customer Landscape
- 12.1 Customer landscape overview
- Analysis of price sensitivity, lifecycle, customer purchase basket, adoption rates, and purchase criteria
13 Geographic Landscape
- 13.1 Geographic segmentation
- Chart on Market share by geography 2024-2029 (%)
- Data Table on Market share by geography 2024-2029 (%)
- 13.2 Geographic comparison
- Chart on Geographic comparison
- Data Table on Geographic comparison
- 13.3 APAC - Market size and forecast 2024-2029
- Chart on APAC - Market size and forecast 2024-2029 ($ million)
- Data Table on APAC - Market size and forecast 2024-2029 ($ million)
- Chart on APAC - Year-over-year growth 2024-2029 (%)
- Data Table on APAC - Year-over-year growth 2024-2029 (%)
- 13.4 North America - Market size and forecast 2024-2029
- Chart on North America - Market size and forecast 2024-2029 ($ million)
- Data Table on North America - Market size and forecast 2024-2029 ($ million)
- Chart on North America - Year-over-year growth 2024-2029 (%)
- Data Table on North America - Year-over-year growth 2024-2029 (%)
- 13.5 Europe - Market size and forecast 2024-2029
- Chart on Europe - Market size and forecast 2024-2029 ($ million)
- Data Table on Europe - Market size and forecast 2024-2029 ($ million)
- Chart on Europe - Year-over-year growth 2024-2029 (%)
- Data Table on Europe - Year-over-year growth 2024-2029 (%)
- 13.6 South America - Market size and forecast 2024-2029
- Chart on South America - Market size and forecast 2024-2029 ($ million)
- Data Table on South America - Market size and forecast 2024-2029 ($ million)
- Chart on South America - Year-over-year growth 2024-2029 (%)
- Data Table on South America - Year-over-year growth 2024-2029 (%)
- 13.7 Middle East and Africa - Market size and forecast 2024-2029
- Chart on Middle East and Africa - Market size and forecast 2024-2029 ($ million)
- Data Table on Middle East and Africa - Market size and forecast 2024-2029 ($ million)
- Chart on Middle East and Africa - Year-over-year growth 2024-2029 (%)
- Data Table on Middle East and Africa - Year-over-year growth 2024-2029 (%)
- 13.8 US - Market size and forecast 2024-2029
- Chart on US - Market size and forecast 2024-2029 ($ million)
- Data Table on US - Market size and forecast 2024-2029 ($ million)
- Chart on US - Year-over-year growth 2024-2029 (%)
- Data Table on US - Year-over-year growth 2024-2029 (%)
- 13.9 China - Market size and forecast 2024-2029
- Chart on China - Market size and forecast 2024-2029 ($ million)
- Data Table on China - Market size and forecast 2024-2029 ($ million)
- Chart on China - Year-over-year growth 2024-2029 (%)
- Data Table on China - Year-over-year growth 2024-2029 (%)
- 13.10 Japan - Market size and forecast 2024-2029
- Chart on Japan - Market size and forecast 2024-2029 ($ million)
- Data Table on Japan - Market size and forecast 2024-2029 ($ million)
- Chart on Japan - Year-over-year growth 2024-2029 (%)
- Data Table on Japan - Year-over-year growth 2024-2029 (%)
- 13.11 Canada - Market size and forecast 2024-2029
- Chart on Canada - Market size and forecast 2024-2029 ($ million)
- Data Table on Canada - Market size and forecast 2024-2029 ($ million)
- Chart on Canada - Year-over-year growth 2024-2029 (%)
- Data Table on Canada - Year-over-year growth 2024-2029 (%)
- 13.12 India - Market size and forecast 2024-2029
- Chart on India - Market size and forecast 2024-2029 ($ million)
- Data Table on India - Market size and forecast 2024-2029 ($ million)
- Chart on India - Year-over-year growth 2024-2029 (%)
- Data Table on India - Year-over-year growth 2024-2029 (%)
- 13.13 South Korea - Market size and forecast 2024-2029
- Chart on South Korea - Market size and forecast 2024-2029 ($ million)
- Data Table on South Korea - Market size and forecast 2024-2029 ($ million)
- Chart on South Korea - Year-over-year growth 2024-2029 (%)
- Data Table on South Korea - Year-over-year growth 2024-2029 (%)
- 13.14 Germany - Market size and forecast 2024-2029
- Chart on Germany - Market size and forecast 2024-2029 ($ million)
- Data Table on Germany - Market size and forecast 2024-2029 ($ million)
- Chart on Germany - Year-over-year growth 2024-2029 (%)
- Data Table on Germany - Year-over-year growth 2024-2029 (%)
- 13.15 UK - Market size and forecast 2024-2029
- Chart on UK - Market size and forecast 2024-2029 ($ million)
- Data Table on UK - Market size and forecast 2024-2029 ($ million)
- Chart on UK - Year-over-year growth 2024-2029 (%)
- Data Table on UK - Year-over-year growth 2024-2029 (%)
- 13.16 Australia - Market size and forecast 2024-2029
- Chart on Australia - Market size and forecast 2024-2029 ($ million)
- Data Table on Australia - Market size and forecast 2024-2029 ($ million)
- Chart on Australia - Year-over-year growth 2024-2029 (%)
- Data Table on Australia - Year-over-year growth 2024-2029 (%)
- 13.17 France - Market size and forecast 2024-2029
- Chart on France - Market size and forecast 2024-2029 ($ million)
- Data Table on France - Market size and forecast 2024-2029 ($ million)
- Chart on France - Year-over-year growth 2024-2029 (%)
- Data Table on France - Year-over-year growth 2024-2029 (%)
- 13.18 Market opportunity by geography
- Market opportunity by geography ($ million)
- Data Tables on Market opportunity by geography ($ million)
- 13.19 US - Market size and forecast (2024-2029)
- Chart on US - Market size and forecast (2024-2029) ($ million)
- Data Table on US - Market size and forecast (2024-2029) ($ million)
- Chart on US - Year-over-year growth (2024-2029) (%)
- Data Table on US - Year-over-year growth (2024-2029) (%)
- 13.20 Brazil - Market size and forecast (2024-2029)
- Chart on Brazil - Market size and forecast (2024-2029) ($ million)
- Data Table on Brazil - Market size and forecast (2024-2029) ($ million)
- Chart on Brazil - Year-over-year growth (2024-2029) (%)
- Data Table on Brazil - Year-over-year growth (2024-2029) (%)
- 13.21 UAE - Market size and forecast (2024-2029)
- Chart on UAE - Market size and forecast (2024-2029) ($ million)
- Data Table on UAE - Market size and forecast (2024-2029) ($ million)
- Chart on UAE - Year-over-year growth (2024-2029) (%)
- Data Table on UAE - Year-over-year growth (2024-2029) (%)
- 13.22 Rest of World (ROW) - Market size and forecast (2024-2029)
- Chart on Rest of World (ROW) - Market size and forecast (2024-2029) ($ million)
- Data Table on Rest of World (ROW) - Market size and forecast (2024-2029) ($ million)
- Chart on Rest of World (ROW) - Year-over-year growth (2024-2029) (%)
- Data Table on Rest of World (ROW) - Year-over-year growth (2024-2029) (%)
- 13.23 Saudi Arabia - Market size and forecast (2024-2029)
- Chart on Saudi Arabia - Market size and forecast (2024-2029) ($ million)
- Data Table on Saudi Arabia - Market size and forecast (2024-2029) ($ million)
- Chart on Saudi Arabia - Year-over-year growth (2024-2029) (%)
- Data Table on Saudi Arabia - Year-over-year growth (2024-2029) (%)
- 13.24 Mexico - Market size and forecast (2024-2029)
- Chart on Mexico - Market size and forecast (2024-2029) ($ million)
- Data Table on Mexico - Market size and forecast (2024-2029) ($ million)
- Chart on Mexico - Year-over-year growth (2024-2029) (%)
- Data Table on Mexico - Year-over-year growth (2024-2029) (%)
- 13.25 Italy - Market size and forecast (2024-2029)
- Chart on Italy - Market size and forecast (2024-2029) ($ million)
- Data Table on Italy - Market size and forecast (2024-2029) ($ million)
- Chart on Italy - Year-over-year growth (2024-2029) (%)
- Data Table on Italy - Year-over-year growth (2024-2029) (%)
- 13.26 Spain - Market size and forecast (2024-2029)
- Chart on Spain - Market size and forecast (2024-2029) ($ million)
- Data Table on Spain - Market size and forecast (2024-2029) ($ million)
- Chart on Spain - Year-over-year growth (2024-2029) (%)
- Data Table on Spain - Year-over-year growth (2024-2029) (%)
14 Drivers, Challenges, and Opportunity/Restraints
- 14.3 Impact of drivers and challenges
- Impact of drivers and challenges in 2024 and 2029
- 14.4 Market opportunities/restraints
15 Competitive Landscape
- 15.2 Competitive Landscape
- Overview on criticality of inputs and factors of differentiation
- 15.3 Landscape disruption
- Overview on factors of disruption
- 15.4 Industry risks
- Impact of key risks on business
16 Competitive Analysis
- 16.2 Market positioning of companies
- Matrix on companies position and classification
- 16.3 Bosch Thermotechnology
- Bosch Thermotechnology - Overview
- Bosch Thermotechnology - Product / Service
- Bosch Thermotechnology - Key offerings
- 16.4 Carrier Corporation
- Carrier Corporation - Overview
- Carrier Corporation - Product / Service
- Carrier Corporation - Key offerings
- 16.5 Daikin Industries
- Daikin Industries - Overview
- Daikin Industries - Product / Service
- Daikin Industries - Key offerings
- 16.6 Danfoss
- Danfoss - Overview
- Danfoss - Product / Service
- Danfoss - Key offerings
- 16.7 Emerson Electric
- Emerson Electric - Overview
- Emerson Electric - Product / Service
- Emerson Electric - Key offerings
- 16.8 Fujitsu General
- Fujitsu General - Overview
- Fujitsu General - Product / Service
- Fujitsu General - Key offerings
- 16.9 Goodman Manufacturing
- Goodman Manufacturing - Overview
- Goodman Manufacturing - Product / Service
- Goodman Manufacturing - Key offerings
- 16.10 Honeywell International
- Honeywell International - Overview
- Honeywell International - Product / Service
- Honeywell International - Key offerings
- 16.11 Ingersoll Rand
- Ingersoll Rand - Overview
- Ingersoll Rand - Product / Service
- Ingersoll Rand - Key offerings
- 16.12 Johnson Controls
- Johnson Controls - Overview
- Johnson Controls - Product / Service
- Johnson Controls - Key offerings
- 16.13 LG Electronics
- LG Electronics - Overview
- LG Electronics - Product / Service
- LG Electronics - Key offerings
- 16.14 Lennox International
- Lennox International - Overview
- Lennox International - Product / Service
- Lennox International - Key offerings
- 16.15 Midea Group
- Midea Group - Overview
- Midea Group - Product / Service
- Midea Group - Key offerings
- 16.16 Mitsubishi Electric
- Mitsubishi Electric - Overview
- Mitsubishi Electric - Product / Service
- Mitsubishi Electric - Key offerings
- 16.17 Nortek Global HVAC
- Nortek Global HVAC - Overview
- Nortek Global HVAC - Product / Service
- Nortek Global HVAC - Key offerings
- 16.18 Panasonic Corporation
- Panasonic Corporation - Overview
- Panasonic Corporation - Product / Service
- Panasonic Corporation - Key offerings
- 16.19 Rheem Manufacturing
- Rheem Manufacturing - Overview
- Rheem Manufacturing - Product / Service
- Rheem Manufacturing - Key offerings
- 16.20 Samsung Electronics
- Samsung Electronics - Overview
- Samsung Electronics - Product / Service
- Samsung Electronics - Key offerings
- 16.21 Trane Technologies
- Trane Technologies - Overview
- Trane Technologies - Product / Service
- Trane Technologies - Key offerings
- 16.22 Toshiba Carrier
- Toshiba Carrier - Overview
- Toshiba Carrier - Product / Service
- Toshiba Carrier - Key offerings
- 16.23 American standard
- American standard - Overview
- American standard - Product / Service
- American standard - Key offerings
- 16.24 ClimateMaster Inc.
- ClimateMaster Inc. - Overview
- ClimateMaster Inc. - Product / Service
- ClimateMaster Inc. - Key offerings
- 16.25 Copeland LP.
- Copeland LP. - Overview
- Copeland LP. - Product / Service
- Copeland LP. - Key offerings
- 16.26 Daikin Industries Ltd.
- Daikin Industries Ltd. - Overview
- Daikin Industries Ltd. - Product / Service
- Daikin Industries Ltd. - Key offerings
- 16.27 Gree Electric Appliances Inc. of Zhuhai
- Gree Electric Appliances Inc. of Zhuhai - Overview
- Gree Electric Appliances Inc. of Zhuhai - Product / Service
- Gree Electric Appliances Inc. of Zhuhai - Key offerings
- 16.28 Hitachi Ltd.
- Hitachi Ltd. - Overview
- Hitachi Ltd. - Product / Service
- Hitachi Ltd. - Key offerings
- 16.29 Ingersoll Rand Inc.
- Ingersoll Rand Inc. - Overview
- Ingersoll Rand Inc. - Product / Service
- Ingersoll Rand Inc. - Key offerings
- 16.30 Johnson Controls International Plc
- Johnson Controls International Plc - Overview
- Johnson Controls International Plc - Product / Service
- Johnson Controls International Plc - Key offerings
- 16.31 Lennox International Inc.
- Lennox International Inc. - Overview
- Lennox International Inc. - Product / Service
- Lennox International Inc. - Key offerings
- 16.32 LG Corp.
- LG Corp. - Overview
- LG Corp. - Product / Service
- LG Corp. - Key offerings
- 16.33 Mitsubishi Electric Corp.
- Mitsubishi Electric Corp. - Overview
- Mitsubishi Electric Corp. - Product / Service
- Mitsubishi Electric Corp. - Key offerings
- 16.34 Nortek
- Nortek - Overview
- Nortek - Product / Service
- Nortek - Key offerings
- 16.35 Paloma Co. Ltd.
- Paloma Co. Ltd. - Overview
- Paloma Co. Ltd. - Product / Service
- Paloma Co. Ltd. - Key offerings
- 16.36 Panasonic Holdings Corp.
- Panasonic Holdings Corp. - Overview
- Panasonic Holdings Corp. - Product / Service
- Panasonic Holdings Corp. - Key offerings
- 16.37 Robert Bosch GmbH
- Robert Bosch GmbH - Overview
- Robert Bosch GmbH - Product / Service
- Robert Bosch GmbH - Key offerings
- 16.38 RTX Corp.
- RTX Corp. - Overview
- RTX Corp. - Product / Service
- RTX Corp. - Key offerings
- 16.39 Samsung Electronics Co. Ltd.
- Samsung Electronics Co. Ltd. - Overview
- Samsung Electronics Co. Ltd. - Product / Service
- Samsung Electronics Co. Ltd. - Key offerings
- 16.40 Siemens AG
- Siemens AG - Overview
- Siemens AG - Product / Service
- Siemens AG - Key offerings
- 16.41 Trane Technologies plc
- Trane Technologies plc - Overview
- Trane Technologies plc - Product / Service
- Trane Technologies plc - Key offerings
- 16.42 WaterFurnace International Inc.
- WaterFurnace International Inc. - Overview
- WaterFurnace International Inc. - Product / Service
- WaterFurnace International Inc. - Key offerings
17 Appendix
- 17.2 Inclusions and exclusions checklist
- Inclusions checklist
- Exclusions checklist
- 17.3 Currency conversion rates for US$
- Currency conversion rates for US$
- 17.4 Research methodology
- 17.7 Validation techniques employed for market sizing
- Validation techniques employed for market sizing
- 17.9 360 degree market analysis
- 360 degree market analysis
- 17.10 List of abbreviations