
Enterprise Session Border Controller Market Size 2024-2028
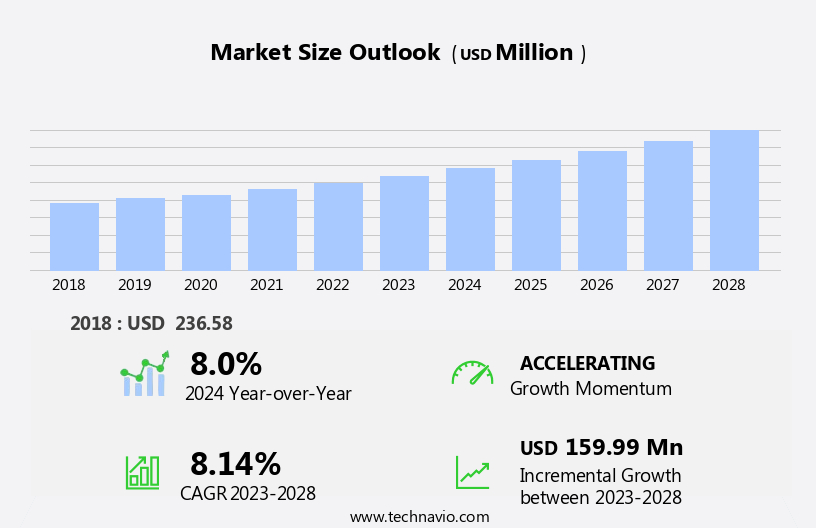
The enterprise session border controller market size is forecast to increase by USD 159.99 million at a CAGR of 8.14% between 2023 and 2028.
- The Enterprise Session Border Controller (E-SBC) market is experiencing significant growth, driven by the increasing number of mobile computing devices and the widespread adoption of the Bring Your Own Device (BYOD) concept in businesses. These trends have led to an escalating demand for secure and reliable communication solutions, which E-SBCs provide by controlling and securing sessions between IP communication endpoints. However, the market is not without challenges. Signaling issues with E-SBCs, particularly related to interoperability and security, continue to pose significant hurdles. To capitalize on the market opportunities and navigate these challenges effectively, companies must focus on developing advanced E-SBC solutions that address these signaling issues while ensuring interoperability and security.
- Additionally, they should prioritize research and development to keep up with the evolving communication landscape and emerging technologies, such as cloud and IoT, to expand their offerings and cater to the evolving needs of their customers. In summary, the E-SBC market is poised for growth, driven by the increasing adoption of mobile devices and the BYOD concept, but companies must address signaling issues and keep up with emerging technologies to stay competitive.
What will be the Size of the Enterprise Session Border Controller Market during the forecast period?
- The Enterprise Session Border Controller (E SBC) market in the US continues to experience significant growth, driven by the increasing adoption of Voice over IP (VoIP) and real-time communications. E SBCS play a crucial role in ensuring secure, high-quality communications by providing media processing, call quality metrics, and DDoS protection. Integration capabilities with various VoIP and Unified Communications (UC) platforms offer cost optimization and competitive advantage. Security remains a top priority, with demand for data security regulations compliance, security consulting, managed security services, threat intelligence, and security certifications. Deployment flexibility, network performance monitoring, customer support, and business continuity plans are also essential features.
How is this Enterprise Session Border Controller Industry segmented?
The enterprise session border controller industry research report provides comprehensive data (region-wise segment analysis), with forecasts and estimates in "USD million" for the period 2024-2028, as well as historical data from 2018-2022 for the following segments.
- End-user
- Large enterprises
- SMEs
- Capacity
- Up to 200
- Up to 600
- Up to 1000
- Up to 5000
- More than 5000
- Features
- Security
- Interoperability
- Scalability
- Application
- VoIP
- Unified Communications
- Contact Centers
- Geography
- North America
- US
- Canada
- Mexico
- Europe
- France
- Germany
- Italy
- Spain
- UK
- APAC
- China
- India
- Japan
- South Korea
- South America
- Brazil
- Middle East and Africa
- UAE
- Rest of World (ROW)
- North America
By End-user Insights
The large enterprises segment is estimated to witness significant growth during the forecast period.
The Enterprise Session Border Controller (E-SBC) market is experiencing significant growth, driven by the increasing demand for secure, high-performance communications solutions in large enterprises. E-SBCs enable high-speed switching between communication pathways, making them essential for large-volume communications in sectors such as financial services, call centers, and unified communications. The need for digitization and operational efficiency, cost reduction, and regulatory compliance are key factors driving the adoption of E-SBCs in large enterprises. E-SBCs provide security, reliability, quality, and scalability for connecting SIP trunks, on-premises enterprise telephony, UC as a Service (UCaaS), Communications Platform as a Service (CCaaS), and other SIP services.
They can be deployed in both networks and the largest public clouds to ensure secure and optimized communications. Network functions virtualization, performance optimization, and media optimization are critical features of E-SBCs, ensuring call routing, access control, and quality of service. Data privacy and regulatory compliance are addressed through security auditing and regulatory compliance features. Additionally, E-SBCs support NAT traversal, machine learning, and disaster recovery, making them indispensable for businesses seeking to optimize their communications infrastructure. The integration of software-defined networking, network functions virtualization, and application programming interfaces (APIs) further enhances the capabilities of E-SBCs, enabling advanced features such as media optimization, artificial intelligence, and IoT integration. Overall, the E-SBC market is expected to continue its growth trajectory, driven by the evolving communications needs of large enterprises and the increasing importance of secure, high-performance communications solutions.
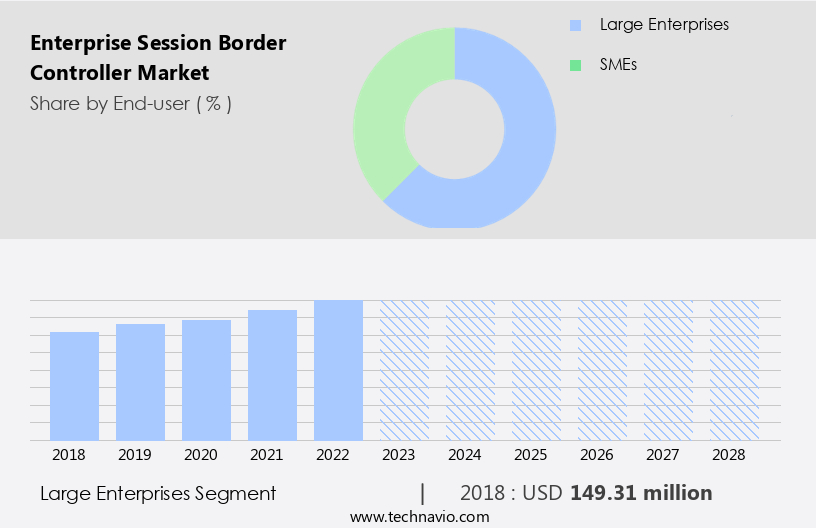
Get a glance at the market report of share of various segments Request Free Sample
The Large enterprises segment was valued at USD 149.31 million in 2018 and showed a gradual increase during the forecast period.
Regional Analysis
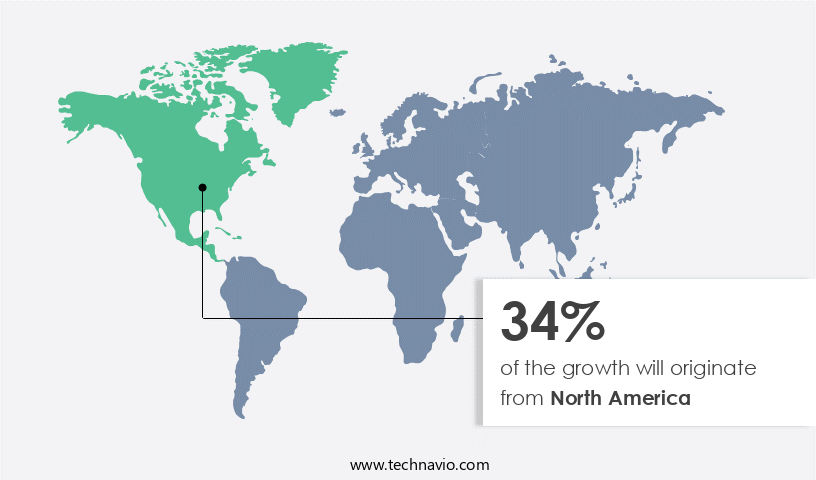
North America is estimated to contribute 34% to the growth of the global market during the forecast period.Technavio's analysts have elaborately explained the regional trends and drivers that shape the market during the forecast period.
For more insights on the market size of various regions, Request Free Sample
In North America, advanced economies like the US and Canada are driving the adoption of Enterprise Session Border Controllers (E SBCs) in business communications. High-speed Internet connections enable seamless video and voice conferencing, fueling demand among organizations, particularly small and medium-sized enterprises (SMEs), for cost-effective solutions. SMEs are embracing digitalization and leveraging conferencing to boost product promotions and streamline operations. companies in the region are harnessing Web Real-Time Communication (WebRTC) technology to create affordable, platform-independent E SBCs. Technology giants are collaborating to capitalize on WebRTC's potential, leading to an increase in the development and use of WebRTC-enabled devices and applications across industries.
E SBCs are integral to cloud communications, offering features like Security Policy, Financial Services, Software-Defined Networking, Data Privacy, Performance Optimization, Network Functions Virtualization, High Availability, Call Routing, Security Auditing, Access Control, and Quality of Service. These solutions ensure Network Security and Regulatory Compliance, critical for businesses handling sensitive data. Additionally, E SBCs provide Media Optimization, Media Gateway functionalities, and Call Control, enhancing the user experience. They offer Deployment Models, including Cloud Communications and Managed Services, catering to various business needs. E SBCs also integrate with Application Programming Interfaces (APIs) and offer Data Analytics for better insight and Network Optimization.
The Internet of Things (IoT) and Artificial Intelligence (AI) are transforming industries, and E SBCs are adapting to these trends. They support NAT Traversal, ensuring seamless connectivity for IoT devices. Machine Learning algorithms enable advanced Call Routing and Call Center solutions, improving customer experience and Contact Center efficiency. E SBCs also provide Disaster Recovery capabilities, ensuring business continuity.
Market Dynamics
Our researchers analyzed the data with 2023 as the base year, along with the key drivers, trends, and challenges. A holistic analysis of drivers will help companies refine their marketing strategies to gain a competitive advantage.
What are the key market drivers leading to the rise in the adoption of Enterprise Session Border Controller Industry?
- Increasing number of mobile computing devices is the key driver of the market.
- The proliferation of mobile computing devices has led to an increase in the use of Voice over IP (VoIP) and Unified Communications (UC) technologies for voice, video, and data services. This trend has resulted in a in mobile applications, messaging platforms, and collaboration tools. However, the use of mobile devices introduces unique challenges related to security, interoperability, and Quality of Service (QoS). Mobile networks are less secure than traditional fixed-line networks, making them susceptible to threats such as malware, eavesdropping, and unauthorized access.
- Additionally, the diversity of mobile devices and operating systems complicates interoperability between different platforms and communication protocols. Enterprise Session Border Controllers (E-SBCs) have emerged as a solution to address these challenges. E-SBCs provide security, interoperability, and QoS for VoIP and UC services, enabling secure and reliable communication and collaboration across different mobile devices and networks.
What are the market trends shaping the Enterprise Session Border Controller Industry?
- Increased adoption of BYOD concept is the upcoming market trend.
- The bring-your-own-device (BYOD) trend in workplaces is gaining popularity, with over a third of employers worldwide providing devices to their staff and over half encouraging the use of personal devices. This shift towards remote work and the use of personal devices necessitates advanced communication technologies to ensure high-quality user experiences. Web Real-Time Communication (WebRTC) solutions have emerged as a promising technology, offering professional standards of interaction and workflows across various remote devices. Regardless of the device's mode of virtual transport, WebRTC solutions ensure a seamless and high-quality user experience.
- These solutions prioritize the lower-end processing power of smartphones, enabling them to send multiple signals to all users involved in a conversation. This technology's adoption is essential for businesses to maintain productivity and communication effectiveness in today's dynamic work environment.
What challenges does the Enterprise Session Border Controller Industry face during its growth?
- Signaling issues with E-SBC is a key challenge affecting the industry growth.
- The global Enterprise Session Border Controller (E-SBC) market faces significant challenges due to signaling issues in real-time communication networks. These challenges primarily arise from the complexity of managing and securing signaling protocols, such as SIP and H.323, which are responsible for establishing, maintaining, and terminating communication sessions. Interoperability is a major concern, as different companies and service providers may implement signaling protocols differently, leading to compatibility issues. E-SBCs must support a diverse range of signaling protocols, codecs, and media formats to ensure seamless communication across heterogeneous environments, including VoIP networks, UC platforms, and SIP trunking services.
- Signaling protocols play a crucial role in maintaining the quality of communication, ensuring security, and enabling interoperability between various devices and networks. Addressing these signaling challenges is essential for the growth and success of the E-SBC market.
Exclusive Customer Landscape
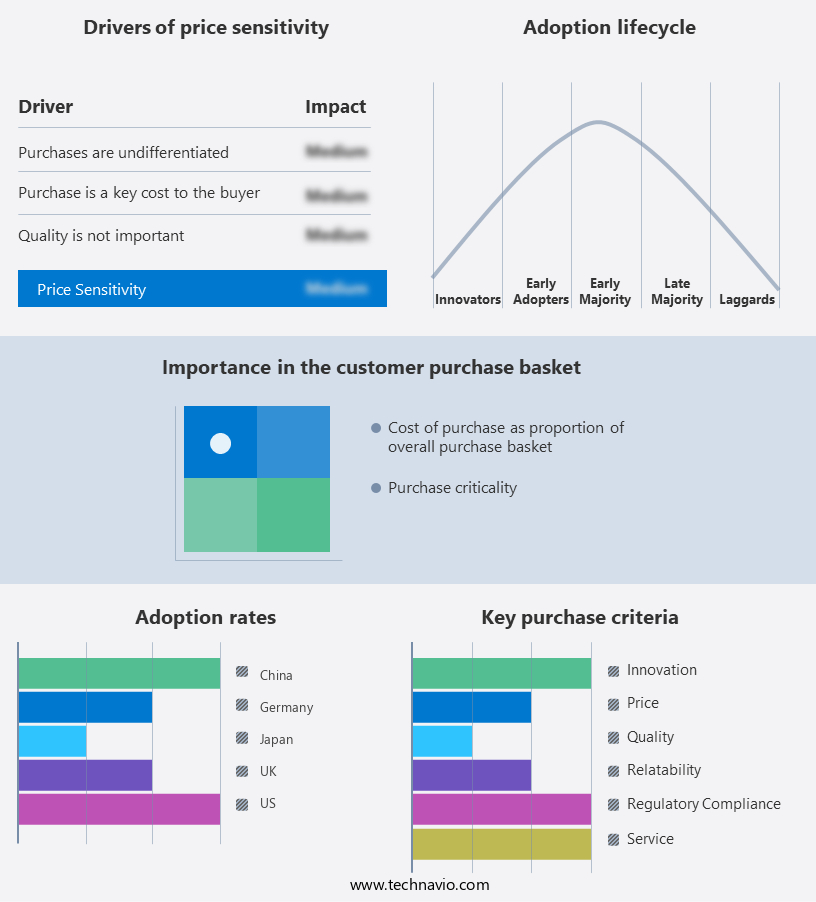
The enterprise session border controller market forecasting report includes the adoption lifecycle of the market, covering from the innovator's stage to the laggard's stage. It focuses on adoption rates in different regions based on penetration. Furthermore, the enterprise session border controller market report also includes key purchase criteria and drivers of price sensitivity to help companies evaluate and develop their market growth analysis strategies.
Customer Landscape
Key Companies & Market Insights
Companies are implementing various strategies, such as strategic alliances, enterprise session border controller market forecast, partnerships, mergers and acquisitions, geographical expansion, and product/service launches, to enhance their presence in the industry.
The industry research and growth report includes detailed analyses of the competitive landscape of the market and information about key companies, including:
- Cisco Systems Inc. (United States)
- Ribbon Communications Inc. (United States)
- Oracle Corporation (United States)
- Avaya Inc. (United States)
- Huawei Technologies Co., Ltd. (China)
- ZTE Corporation (China)
- NEC Corporation (Japan)
- Mitel Networks Corporation (Canada)
- Alcatel-Lucent Enterprise (France)
- Dialogic Corporation (United States)
- Sangoma Technologies Corporation (Canada)
- Adtran Inc. (United States)
- Edgewater Networks (United States)
- Metaswitch Networks (United Kingdom)
- Nokia Solutions and Networks GmbH (Germany, operations)
- Sonus Networks (United States)
- Ericsson AB (Sweden, operations)
- Tata Communications Ltd. (India, operations)
- NTT Communications Corporation (Japan, operations)
- Colt Technology Services (United Kingdom)
Qualitative and quantitative analysis of companies has been conducted to help clients understand the wider business environment as well as the strengths and weaknesses of key industry players. Data is qualitatively analyzed to categorize companies as pure play, category-focused, industry-focused, and diversified; it is quantitatively analyzed to categorize companies as dominant, leading, strong, tentative, and weak.
Research Analyst Overview
Enterprise Session Border Controllers (E SBCs) have emerged as a critical component in securing and optimizing communications for large enterprises. These solutions enable organizations to protect their networks from external threats, ensure data privacy, and enhance the performance of various communication applications. The market for Enterprise SBCs is witnessing significant growth due to the increasing adoption of cloud communications and unified communications (UC) in financial services and other industries. The integration of software-defined networking (SDN) and network functions virtualization (NFV) in communication infrastructure is also driving the demand for advanced E SBCs. High availability and disaster recovery are essential considerations for large enterprises, and E SBCs offer reliable call routing and session continuity features to ensure business continuity.
Moreover, E SBCs provide essential security features, such as access control, security auditing, and call control, to ensure regulatory compliance and network security. The market for Enterprise SBCs is witnessing the integration of advanced technologies like machine learning, data analytics, and artificial intelligence (AI) to provide better network optimization, media optimization, and quality of service (QoS). Moreover, the Internet of Things (IoT) is creating new opportunities for E SBCs to manage and secure communication between connected devices. E SBCs offer various deployment models, including on-premises, managed services, and cloud-based solutions, providing enterprises with flexibility and scalability. Application programming interfaces (APIs) enable seamless integration with management consoles, call centers, and service level agreements (SLAs), enhancing operational efficiency and improving the overall user experience.
Network security is a top priority for enterprises, and E SBCs provide essential security features, such as NAT traversal and media optimization, to ensure secure and high-quality communication. Moreover, E SBCs offer advanced features like data privacy and regulatory compliance to meet the evolving security requirements of large enterprises. In the evolving communication landscape, E SBCs play a crucial role in ensuring secure, optimized, and reliable communication for large enterprises. The market for Enterprise SBCs is expected to continue growing, driven by the increasing adoption of cloud communications, UC, and advanced technologies like SDN, NFV, and AI.
|
Market Scope |
|
|
Report Coverage |
Details |
|
Page number |
173 |
|
Base year |
2023 |
|
Historic period |
2018-2022 |
|
Forecast period |
2024-2028 |
|
Growth momentum & CAGR |
Accelerate at a CAGR of 8.14% |
|
Market growth 2024-2028 |
USD 159.99 million |
|
Market structure |
Fragmented |
|
YoY growth 2023-2024(%) |
8.0 |
|
Key countries |
US, China, Japan, Germany, France, Spain, Canada, India, South Korea, France, Japan, Italy, Brazil, UAE, UK, Spain, Rest of World (ROW), and Mexico |
|
Competitive landscape |
Leading Companies, Market Positioning of Companies, Competitive Strategies, and Industry Risks |
What are the Key Data Covered in this Enterprise Session Border Controller Market Research and Growth Report?
- CAGR of the Enterprise Session Border Controller industry during the forecast period
- Detailed information on factors that will drive the growth and forecasting between 2024 and 2028
- Precise estimation of the size of the market and its contribution of the industry in focus to the parent market
- Accurate predictions about upcoming growth and trends and changes in consumer behaviour
- Growth of the market across North America, Europe, APAC, South America, and Middle East and Africa
- Thorough analysis of the market's competitive landscape and detailed information about companies
- Comprehensive analysis of factors that will challenge the enterprise session border controller market growth of industry companies
We can help! Our analysts can customize this enterprise session border controller market research report to meet your requirements.
 RIA -
RIA - 
