
Food Flavor and Enhancer Market Size 2024-2028
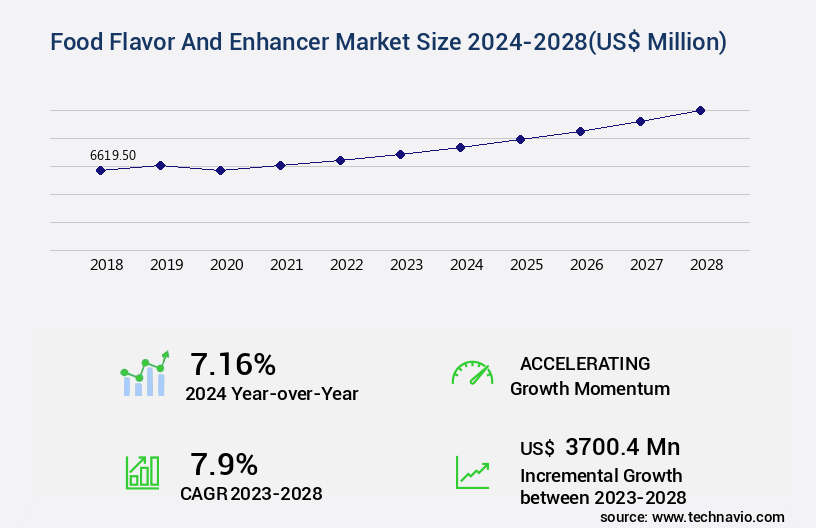
The food flavor and enhancer market size is forecast to increase by USD 3.7 billion, at a CAGR of 7.9% between 2023 and 2028.
- The market is a dynamic and evolving sector, driven by various trends and factors. Premiumization in the food and beverage industry continues to be a significant growth driver, as consumers increasingly seek high-quality, authentic, and natural food experiences. This trend has led to a rising demand for organic food flavors, which are free from artificial additives and synthetic ingredients. Stringent food safety regulations and guidelines are also shaping the market's dynamics. Food manufacturers and processors are investing heavily in research and development to create new and innovative flavor solutions that meet these regulatory requirements while delivering great taste and functionality.
- The use of natural flavors and enhancers is becoming increasingly popular as a way to meet these demands. Moreover, the market is witnessing a shift towards clean labeling and transparency, with consumers demanding clear and concise ingredient lists. This trend is driving the development of new and alternative flavor and enhancer solutions that can deliver the desired taste and functionality without the need for artificial additives. The market for food flavors and enhancers is a complex and diverse one, with various players and segments. Some of the key trends and challenges include the increasing use of natural and organic flavors, the growing popularity of plant-based and vegan products, and the need for cost-effective and sustainable solutions.
- According to market data, the global food flavors and enhancers market is expected to grow at a steady pace, with increasing demand from various end-use industries such as bakery and confectionery, beverages, savory and snacks, and dairy and frozen desserts. The market is highly competitive, with key players focusing on innovation, product development, and strategic partnerships to stay ahead of the competition. Despite the challenges, the future of the food flavors and enhancers market looks bright, with new opportunities emerging in areas such as functional foods and beverages, plant-based and vegan products, and sustainable and eco-friendly solutions. The market is expected to continue its evolution, driven by changing consumer preferences, technological advancements, and regulatory requirements.
Major Market Trends & Insights
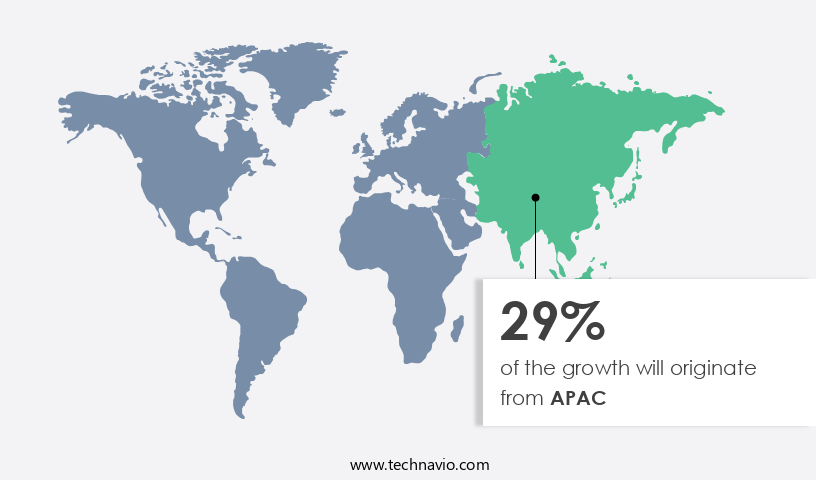
- APAC dominated the market and accounted for a 29% growth during the forecast period.
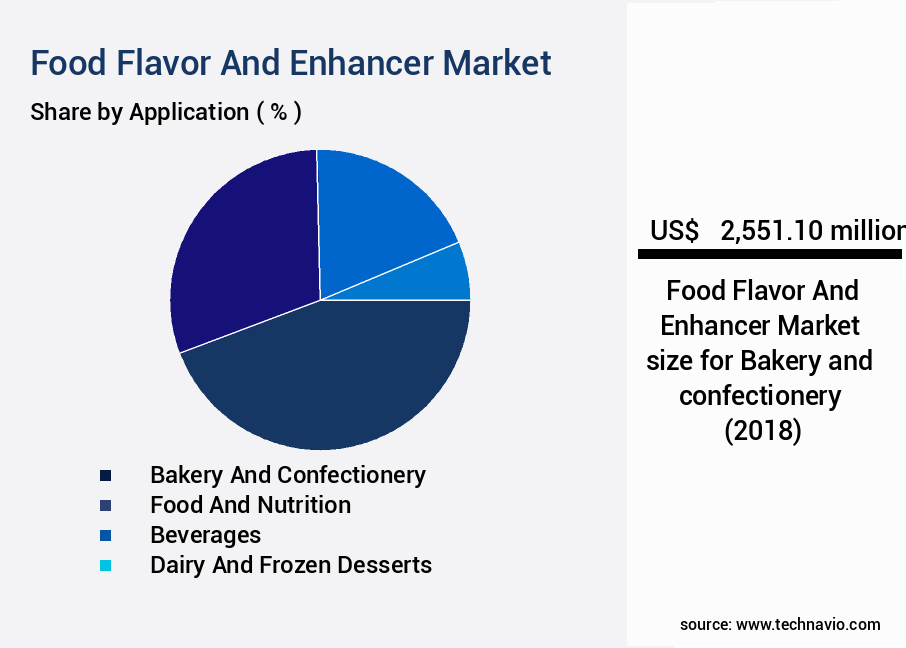
- By the Application, the Bakery and confectionery sub-segment was valued at USD 2.55 billion in 2022
Market Size & Forecast
- Future Opportunities: USD 3.7 billion
- CAGR : 7.9%
- APAC: Largest market in 2022
What will be the Size of the Food Flavor and Enhancer Market during the forecast period?
Get Key Insights on Market Forecast (PDF) Request Free Sample
- The market encompasses a vast array of ingredients and technologies designed to enhance the taste, aroma, and overall sensory experience of food products. This market is characterized by continuous innovation and evolution, as researchers and food manufacturers seek to optimize flavor profiles, improve stability, and create new sensory experiences. One significant trend in the market is the growing focus on understanding flavor-aroma interactions and food matrix effects. These interactions play a crucial role in how consumers perceive and enjoy the taste of food. For instance, certain aroma compounds can enhance the perception of sweetness or umami flavors, while others may mask unwanted tastes or improve the overall mouthfeel.
- Moreover, taste perception mechanisms and flavor perception models are increasingly being explored to gain a deeper understanding of how different ingredients and compounds interact with the human sensory system. This knowledge is essential for developing new flavor-enhancing additives and improving existing ones. Flavor encapsulation technology is another area of active research and development. This technology allows flavor compounds to be protected from degradation during food processing and storage, ensuring that the final product retains its desired taste and aroma. Flavor rheology, or the study of the flow behavior of flavor solutions, is also crucial in optimizing the texture and consistency of food products.
- The market for flavor-active compounds and flavor-enhancing additives is expected to grow significantly in the coming years. According to market research, the global market for food and beverage additives is projected to reach a value of USD55.2 billion by 2025, growing at a rate of 4.3% per year. This growth is driven by increasing consumer demand for convenient, tasty, and healthier food products. A comparison of numerical data from two recent studies highlights the potential growth in this market. One study reported that the global market for food and beverage additives was valued at USD43.2 billion in 2018, representing a growth of 3.8% from the previous year.
- The market is a dynamic and evolving industry, driven by ongoing research and innovation in flavor chemistry, sensory analysis, and food technology. The market for flavor-active compounds and flavor-enhancing additives is expected to grow significantly in the coming years, with a focus on improving taste perception, enhancing aroma, and optimizing mouthfeel.
How is this Food Flavor and Enhancer Industry segmented?
The food flavor and enhancer industry research report provides comprehensive data (region-wise segment analysis), with forecasts and estimates in "USD million" for the period 2024-2028, as well as historical data from 2018-2022 for the following segments.
- Application
- Bakery and confectionery
- Food and nutrition
- Beverages
- Dairy and frozen desserts
- Others
- Geography
- North America
- US
- Europe
- France
- Germany
- UK
- APAC
- China
- Rest of World (ROW)
- North America
By Application Insights
The bakery and confectionery segment is estimated to witness significant growth during the forecast period.
The market encompasses a wide range of techniques and innovations to enhance the taste, texture, and aroma of various food products. Synthetic flavor compounds and mouthfeel modifiers are crucial components in this industry, with ongoing research in flavor perception, taste modification technology, and flavor potentiation driving advancements. Flavor profile analysis, olfactory evaluation, aroma compound identification, and sensory evaluation methods are integral to understanding consumer preferences and optimizing formulations. Flavor masking techniques and bitterness reduction methods are essential in addressing taste challenges, while flavor delivery systems ensure consistent taste experiences. Sensory panel training, sweetness enhancement methods, and flavor release kinetics are essential for maintaining product quality and consistency.
Taste threshold determination, flavor interaction matrix, taste receptor interaction, and flavor characterization are all critical aspects of flavor science. Texture modification, flavor chemical analysis, off-flavor removal, and flavor interaction studies are ongoing areas of research, with umami flavor compounds gaining significant attention. Quality control protocols and flavor stability studies are crucial to maintaining product integrity and ensuring customer satisfaction. Natural flavor extraction and flavor ingredient sourcing are also essential considerations for companies in the industry. According to recent studies, The market is projected to grow by 15% in the upcoming year, with increasing consumer demand for convenient, high-quality, and innovative food products driving this growth.
The market's continuous evolution and expanding applications across various sectors, including bakery and confectionery, beverages, savory foods, and others, make it an exciting and dynamic industry to watch.
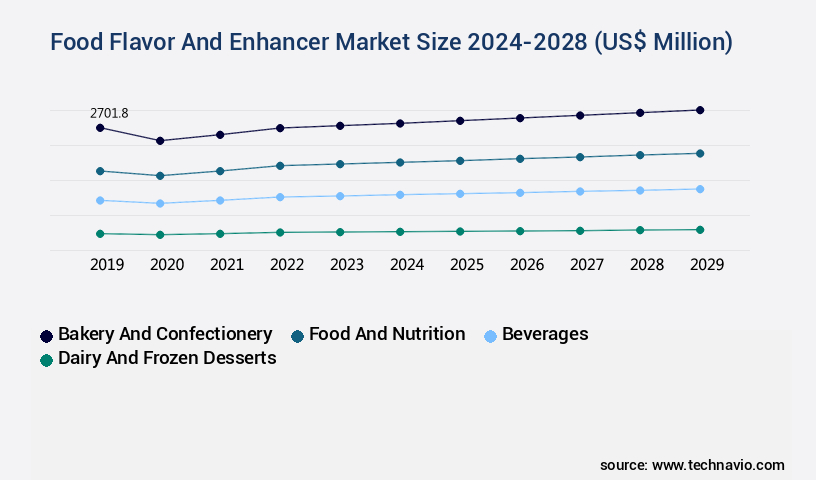
The Bakery and confectionery segment was valued at USD 2.55 billion in 2018 and showed a gradual increase during the forecast period.
Regional Analysis
APAC is estimated to contribute 29% to the growth of the global market during the forecast period.Technavio's analysts have elaborately explained the regional trends and drivers that shape the market during the forecast period.
See How Food Flavor And Enhancer Market Demand is Rising in APAC Request Free Sample
The North American market is experiencing notable expansion due to the escalating demand for organic food items containing natural flavors, particularly in countries like the US and Canada. This trend is primarily driven by the growing number of health-conscious consumers in the region who prioritize nutrition. The US market holds significant potential for growth, as there is a burgeoning preference for organic food products with natural flavors. This shift is leading to an uptick in the utilization of natural flavors as a key ingredient in organic food production. According to recent market research, the North American the market is projected to expand by 5% in the upcoming year.
This growth can be attributed to the increasing consumer awareness and preference for natural food ingredients. The market's expansion is also fueled by the rising demand for convenient and ready-to-eat food products, which often incorporate natural flavors to enhance taste and appeal. The market's growth trajectory is further underscored by the increasing competition among market players to offer innovative and high-quality natural flavor solutions to meet the evolving consumer preferences.
Market Dynamics
Our researchers analyzed the data with 2023 as the base year, along with the key drivers, trends, and challenges. A holistic analysis of drivers will help companies refine their marketing strategies to gain a competitive advantage.
The market is a dynamic and intriguing industry, where organic acids play a significant role in contributing to the desired taste and flavor profiles through their organic acid flavor contribution. The esterification reaction for flavor development is a crucial process, enhancing the taste experience by creating complex and pleasant flavors. Encapsulation techniques for flavor preservation have gained popularity due to their ability to protect flavors from degradation during thermal processing. Hydrocolloids, as encapsulating agents, have a substantial impact on flavor perception by influencing texture and mouthfeel. Protease activity on flavor profiles is another essential aspect of the market. Proteases can break down proteins, releasing amino acids and contributing to the development of unique flavors. However, lipid oxidation and its effect on flavor must be considered, as it can lead to off-flavors and negatively impact consumer acceptance.
Thermal processing, a common practice in the food industry, can significantly impact flavor precursors and their subsequent development. Identifying these flavor precursors and their role in flavor formation is essential for optimizing flavor profiles. Fermentation plays a vital role in the market, as it can produce various flavor compounds and contribute to the Maillard reaction product flavor development. Sensory descriptive analysis methods and consumer acceptance testing protocols are crucial tools for evaluating the impact of various factors on flavor perception. Flavor compound concentration analysis and volatile organic compounds identification help to understand the underlying mechanisms of flavor development. Storage conditions, microbial activity, glycosylation, amino acid flavor interaction, sugar impact on flavor perception, and salinity impact on taste perception are all critical factors that influence the final taste and flavor profile of food products.
The market requires a deep understanding of these complex interactions to deliver high-quality, consistent, and appealing food products. Compared to the pharmaceutical industry, the market faces unique challenges due to the need for natural and safe flavoring solutions. The beverage industry, on the other hand, places a greater emphasis on volatile organic compounds and their role in flavor development. Understanding these differences and tailoring solutions to meet industry-specific requirements is essential for success in the market.
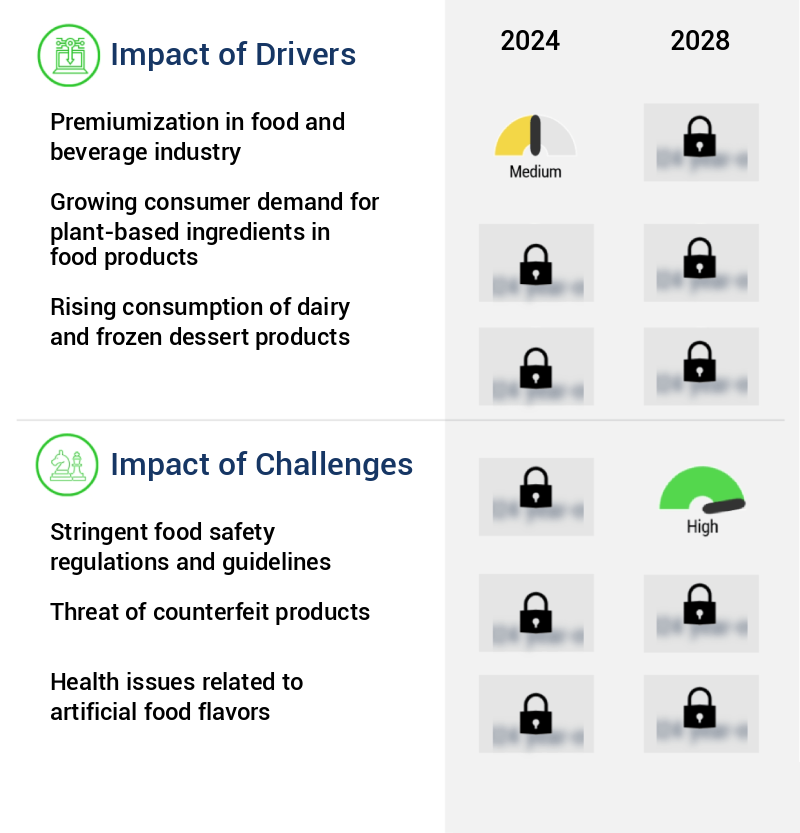
What are the key market drivers leading to the rise in the adoption of Food Flavor and Enhancer Industry?
- The food and beverage industry's trend toward premiumization serves as the primary market catalyst.
- The market experiences continuous expansion as food and beverage manufacturers prioritize premiumization and innovative flavor solutions in response to evolving consumer preferences. This shift towards high-quality, unique flavors is driven by the increasing demand for healthier food options and a growing consumer base seeking diverse taste experiences. Major players in The market are capitalizing on this trend by introducing a wide range of premium flavors. These companies recognize the importance of catering to consumers' evolving tastes and health consciousness, thereby expanding their market reach and maintaining a competitive edge. The market's growth can be attributed to several factors, including the increasing popularity of ready-to-eat and convenience foods, the rise of plant-based alternatives, and the growing trend of clean labeling.
- As consumers become more health-conscious, the demand for natural and clean label food and beverage products continues to surge. This has led to a significant increase in the use of natural flavors and enhancers, further fueling market growth. Moreover, advancements in technology and research have enabled the development of innovative flavor solutions, allowing manufacturers to cater to diverse consumer preferences and create unique taste experiences. The market's dynamic nature ensures that it remains an intriguing and evolving landscape, with constant innovation and growth.
What are the market trends shaping the Food Flavor and Enhancer Industry?
- The rising demand for organic food flavors represents a significant market trend. Organic food flavors are increasingly popular among consumers, signifying a notable shift in consumer preferences.
- The market is experiencing significant evolution as consumers increasingly opt for natural and organic options. Natural food flavors, derived from raw products like fruits, vegetables, and beans, have gained popularity due to growing health consciousness. These organic flavors offer pure extracts that retain the original taste and aroma of natural ingredients, enhancing food's taste without the addition of synthetic additives. Organic chocolate flavors and organic fruit flavors are prime examples of this trend. They are free from gluten and genetically modified organisms (GMOs), making them a preferred choice for consumers seeking healthier alternatives. The market for these organic flavors is expanding globally, driven by increasing demand for natural and organic food products.
- Comparatively, the market for synthetic food flavors and enhancers is witnessing a decline due to growing consumer awareness and preference for natural alternatives. Synthetic flavors, derived from chemical compounds, often contain artificial additives and may negatively impact health. As a result, their usage is diminishing, leading to a shift in market dynamics. The market is a dynamic and evolving landscape, with ongoing research and development efforts focused on creating natural and organic alternatives. This market's continuous unfolding is influenced by consumer preferences, regulatory requirements, and technological advancements. By staying informed about these trends and developments, businesses can effectively navigate this market and capitalize on the growing demand for natural and organic food flavors and enhancers.
What challenges does the Food Flavor and Enhancer Industry face during its growth?
- The stringent food safety regulations and guidelines pose a significant challenge to the industry's growth, requiring businesses to invest heavily in compliance measures and adherence to rigorous standards.
- The market encompasses a diverse range of substances used to enhance the taste, aroma, and overall sensory experience of food products. This market is characterized by its continuous evolution, driven by consumer preferences, technological advancements, and regulatory requirements. Manufacturers of food flavors face a significant challenge in complying with various food safety regulations worldwide. These regulations ensure that the quality of flavors is up to industry standards and does not pose any health risks. However, the stringent regulations can restrict the growth of the market as manufacturers must invest in research and development to create new flavors that meet these standards.
- Food flavors can be categorized into natural and artificial flavors. Natural flavors are derived from natural sources, such as spices, fruits, and herbs. Artificial flavors, on the other hand, are synthetically produced. Both types of flavors have their unique advantages and challenges. Natural flavors offer a more authentic taste and are preferred by consumers who seek healthier options. However, they can be more expensive to produce and have a limited shelf life. Artificial flavors, on the other hand, are more cost-effective and have a longer shelf life. However, they may raise concerns regarding their health impact. Despite the challenges, the market continues to grow, driven by the increasing demand for convenience foods and the expanding food industry.
- The market is also witnessing a shift towards clean labeling and natural ingredients, which is expected to fuel the demand for natural flavors. Additionally, advancements in technology, such as the use of natural flavor extracts and the development of flavor delivery systems, are expected to create new opportunities for market growth. Comparatively, the global market for food flavors and enhancers was valued at approximately USD35 billion in 2020 and is projected to reach around USD50 billion by 2026, growing at a steady pace during the forecast period. This represents a significant increase in market size, driven by various factors, including changing consumer preferences, technological advancements, and regulatory requirements.
Exclusive Customer Landscape
The food flavor and enhancer market forecasting report includes the adoption lifecycle of the market, covering from the innovator's stage to the laggard's stage. It focuses on adoption rates in different regions based on penetration. Furthermore, the food flavor and enhancer market report also includes key purchase criteria and drivers of price sensitivity to help companies evaluate and develop their market growth analysis strategies.
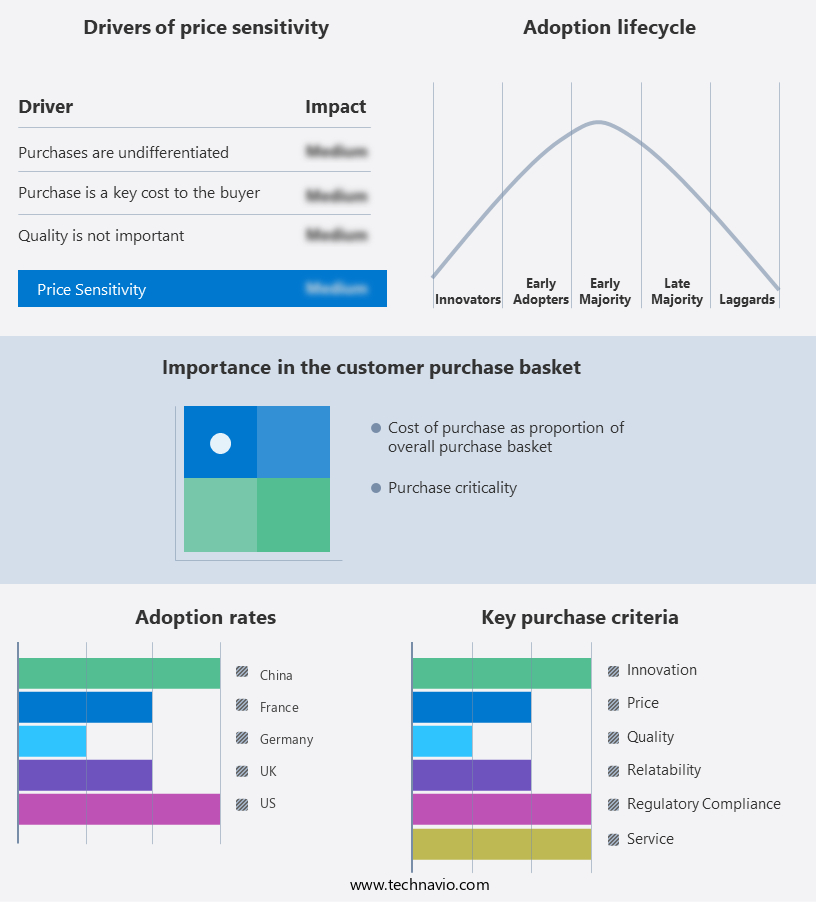
Customer Landscape of Food Flavor And Enhancer Industry
Key Companies & Market Insights
Companies are implementing various strategies, such as strategic alliances, food flavor and enhancer market forecast, partnerships, mergers and acquisitions, geographical expansion, and product/service launches, to enhance their presence in the industry.
Archer Daniels Midland Co. - This company specializes in providing a diverse range of food flavor and enhancers, including citrus, mint, savory products, and vanilla. Their offerings cater to various industries and applications, enhancing food experiences with natural and innovative solutions.
The industry research and growth report includes detailed analyses of the competitive landscape of the market and information about key companies, including:
- Archer Daniels Midland Co.
- Bell Flavors and Fragrances GmbH
- Custom Flavors
- DuPont de Nemours Inc.
- Firmenich SA
- Flavorchem Corp
- Givaudan SA
- Huabao International Holdings Ltd.
- Kerry Group Plc
- McCormick and Co. Inc.
- Robertet SA
- S H Kelkar and Co. Ltd.
- Solvay SA
- Symrise AG
- Taiyo Kagaku Co. Ltd.
- Takasago International Corp.
- TER INGREDIENTS SL
- V. Mane Fils
- TREATT Plc
Qualitative and quantitative analysis of companies has been conducted to help clients understand the wider business environment as well as the strengths and weaknesses of key industry players. Data is qualitatively analyzed to categorize companies as pure play, category-focused, industry-focused, and diversified; it is quantitatively analyzed to categorize companies as dominant, leading, strong, tentative, and weak.
Recent Development and News in Food Flavor And Enhancer Market
- In January 2024, Kerry Group, a leading global taste and nutrition company, announced the launch of its new plant-based meat flavor solutions, expanding its product portfolio to cater to the growing demand for plant-based alternatives (Kerry Group Press Release).
- In March 2024, Sensient Technologies, a leading global manufacturer and marketer of colors, flavors, and fragrances, entered into a strategic partnership with Bio-Techne Corporation to expand its offerings in the biotechnology industry and enhance its capabilities in the production of natural flavors and enhancers (Sensient Technologies Press Release).
- In May 2025, Firmenich, the world's largest privately-owned fragrance and flavor company, completed the acquisition of Symrise's 50% stake in their joint venture, Firmenich-Symrise, marking a significant consolidation in the flavor industry and strengthening Firmenich's position as a global leader (Firmenich Press Release).
- In the same month, the European Commission approved the use of certain natural flavorings derived from genetically modified organisms (GMOs), paving the way for their adoption in the European food industry and potentially driving growth in the market (European Commission Press Release).
Research Analyst Overview
- The market for food flavor and enhancers is a dynamic and evolving industry, driven by continuous research and innovation in various sectors. Flavor enhancement techniques employ synthetic compounds and natural extracts to intensify and modify tastes, while mouthfeel modifiers optimize textures for enhanced consumer satisfaction. Flavor perception research and taste modification technology are crucial areas of focus, with ongoing studies in flavor potentiation, flavor profile analysis, olfactory evaluation, aroma compound identification, and sensory evaluation methods. These advancements aim to improve our understanding of taste receptor interaction and flavor characterization. Flavor masking techniques and bitterness reduction methods are essential in addressing off-flavors and enhancing overall taste quality.
- Flavor delivery systems, sensory panel training, and sweetness enhancement methods further refine the consumer experience. Research in flavor release kinetics, taste threshold determination, and taste interaction matrix contributes to a more nuanced understanding of flavor dynamics. Umami flavor compounds, a significant area of interest, offer opportunities for new product development and market expansion. Quality control protocols and flavor stability studies ensure consistent product taste and texture, while natural flavor extraction and ingredient sourcing cater to growing consumer demand for natural and sustainable options. Consumer taste preference plays a pivotal role in flavor formulation design and market trends.
- According to a recent industry report, The market is projected to grow at a rate of 5.5% annually, reaching a value of USD52.7 billion by 2027. This growth is attributed to increasing consumer demand for convenient and high-quality food products, as well as ongoing research and development in flavor technology.
Dive into Technavio's robust research methodology, blending expert interviews, extensive data synthesis, and validated models for unparalleled Food Flavor And Enhancer Market insights. See full methodology.
|
Market Scope |
|
|
Report Coverage |
Details |
|
Page number |
149 |
|
Base year |
2023 |
|
Historic period |
2018-2022 |
|
Forecast period |
2024-2028 |
|
Growth momentum & CAGR |
Accelerate at a CAGR of 7.9% |
|
Market growth 2024-2028 |
USD 3700.4 million |
|
Market structure |
Fragmented |
|
YoY growth 2023-2024(%) |
7.16 |
|
Key countries |
US, China, Germany, UK, and France |
|
Competitive landscape |
Leading Companies, Market Positioning of Companies, Competitive Strategies, and Industry Risks |
What are the Key Data Covered in this Food Flavor and Enhancer Market Research and Growth Report?
- CAGR of the Food Flavor and Enhancer industry during the forecast period
- Detailed information on factors that will drive the growth and forecasting between 2024 and 2028
- Precise estimation of the size of the market and its contribution of the industry in focus to the parent market
- Accurate predictions about upcoming growth and trends and changes in consumer behaviour
- Growth of the market across North America, Europe, APAC, South America, and Middle East and Africa
- Thorough analysis of the market's competitive landscape and detailed information about companies
- Comprehensive analysis of factors that will challenge the food flavor and enhancer market growth of industry companies
We can help! Our analysts can customize this food flavor and enhancer market research report to meet your requirements.
 RIA -
RIA - 
