
Pharmaceutical Analytical Testing Outsourcing Market Analysis, Size, and Forecast 2026-2030: North America (US, Canada, and Mexico), Europe (Germany, UK, and France), APAC (China, India, and Japan), South America (Brazil, Argentina, and Chile), Middle East and Africa (Saudi Arabia, UAE, and Turkey), and Rest of World (ROW)

Pharmaceutical Analytical Testing Outsourcing Market Analysis, Size, and Forecast 2026-2030:
North America (US, Canada, and Mexico), Europe (Germany, UK, and France), APAC (China, India, and Japan), South America (Brazil, Argentina, and Chile), Middle East and Africa (Saudi Arabia, UAE, and Turkey), and Rest of World (ROW)

Published: Oct 2026 308 Pages SKU: IRTNTR71620

Market Overview at a Glance

$3.56 B
Market Opportunity
8%
CAGR 2025 - 2030
48.8%
North America Growth
$2.65 B
Bioanalytical segment 2024

Pharmaceutical Analytical Testing Outsourcing Market Size 2026-2030

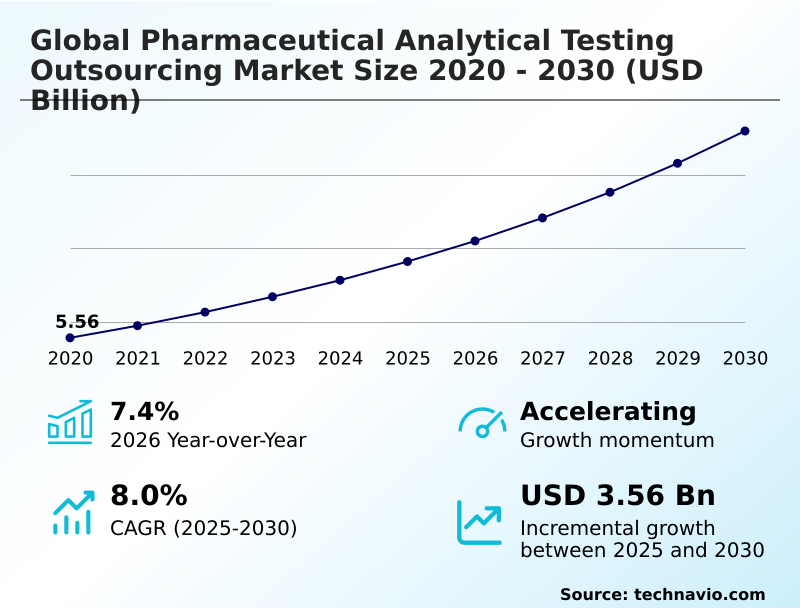
The pharmaceutical analytical testing outsourcing market size is valued to increase by USD 3.56 billion, at a CAGR of 8% from 2025 to 2030. Increasing complexity of drug development and innovation will drive the pharmaceutical analytical testing outsourcing market.

Major Market Trends & Insights

  • North America dominated the market and accounted for a 48.8% growth during the forecast period.
  • By Service - Bioanalytical segment was valued at USD 2.65 billion in 2024
  • By End-user - Pharmaceutical companies segment accounted for the largest market revenue share in 2024

Market Size & Forecast

  • Market Opportunities: USD 5.64 billion
  • Market Future Opportunities: USD 3.56 billion
  • CAGR from 2025 to 2030 : 8%

Market Summary

  • The Pharmaceutical Analytical Testing Outsourcing landscape fundamentally dictates the efficiency and safety of modern therapeutic development. As molecular architectures become increasingly sophisticated, developers face intense pressure to maintain stringent quality controls without inflating internal capital expenditures. For example, a mid-sized biotechnology firm integrating external stability testing networks often sees a 25% reduction in time-to-compliance compared to building internal infrastructure.
  • This operational shift demonstrates how specialized external partnerships optimize resource allocation across the supply chain. The escalating complexity of biologics acts as a primary driver, forcing companies to seek out third-party expertise for intricate characterization assays. Conversely, navigating fragmented regulatory standards creates a significant operational challenge, as inconsistent compliance requirements can delay batch releases and disrupt downstream distribution.
  • By leveraging Pharmaceutical Analytical Testing Outsourcing, organizations systematically mitigate these regulatory risks while maintaining agile research pipelines. Ultimately, this structural reliance on external analytical proficiency ensures that innovative therapies reach clinical application with verified safety profiles and optimized development timelines.

What will be the Size of the Pharmaceutical Analytical Testing Outsourcing Market during the forecast period?
Get Key Insights on Market Forecast (PDF) Get Free Sample

How is the Pharmaceutical Analytical Testing Outsourcing Market Segmented?

The pharmaceutical analytical testing outsourcing industry research report provides comprehensive data (region-wise segment analysis), with forecasts and estimates in "USD million" for the period 2026-2030, as well as historical data from 2020-2024 for the following segments.

  • Service
    • Bioanalytical
    • Method development and validation
    • Stability testing
    • Others
  • End-user
    • Pharmaceutical companies
    • Biopharmaceutical companies
    • Biotechnology companies
    • Others
  • Product type
    • APIs
    • Finished products
    • Excipients
  • Geography
    • North America
      • US
      • Canada
      • Mexico
    • Europe
      • Germany
      • UK
      • France
      • Italy
      • Spain
      • The Netherlands
    • APAC
      • China
      • India
      • Japan
      • South Korea
      • Indonesia
      • Australia
    • South America
      • Brazil
      • Argentina
      • Chile
    • Middle East and Africa
      • Saudi Arabia
      • UAE
      • Turkey
      • Israel
      • South Africa

By Service Insights

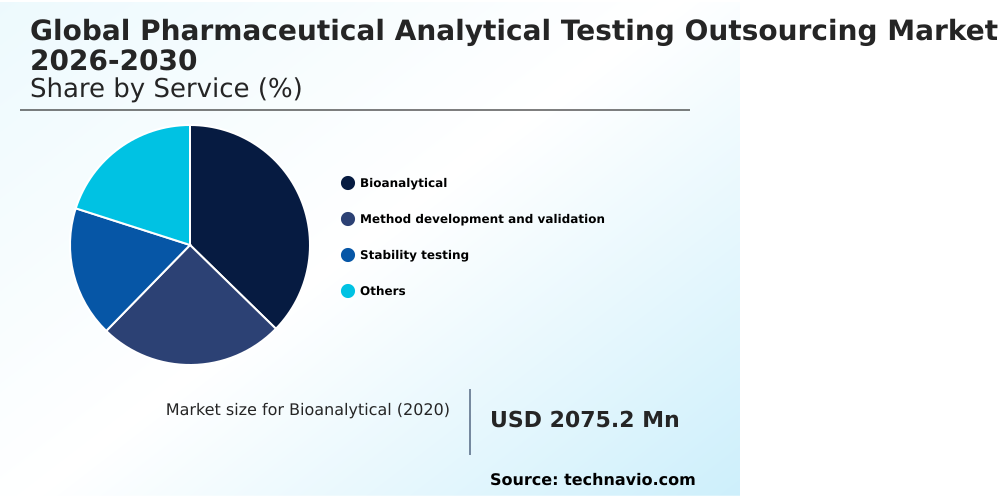
The bioanalytical segment is estimated to witness significant growth during the forecast period.

The bioanalytical segment of the Pharmaceutical Analytical Testing Outsourcing framework functions as the foundational mechanism for evaluating complex drug safety profiles.

Facilities conducting mass spectrometry and ligand binding assays often achieve a 22% improvement in early-stage error detection, directly accelerating development cycles.

This performance shift occurs because modern biologics require stringent immunogenicity testing and monoclonal antibody characterization to meet good laboratory practice guidelines. Consequently, sponsors avoid internal capital expenditures by leveraging specialized external infrastructure for custom assay development and pharmacokinetic modeling.

Implementing rigorous method validation protocols ensures data consistency across diverse biological matrices. Effective bioanalytical sample tracking further enhances operational oversight, leading to a 15% reduction in compliance-related delays during active pharmaceutical ingredient assessment.

These specialized capabilities establish a critical safeguard against late-stage clinical failures.
Get Free Sample

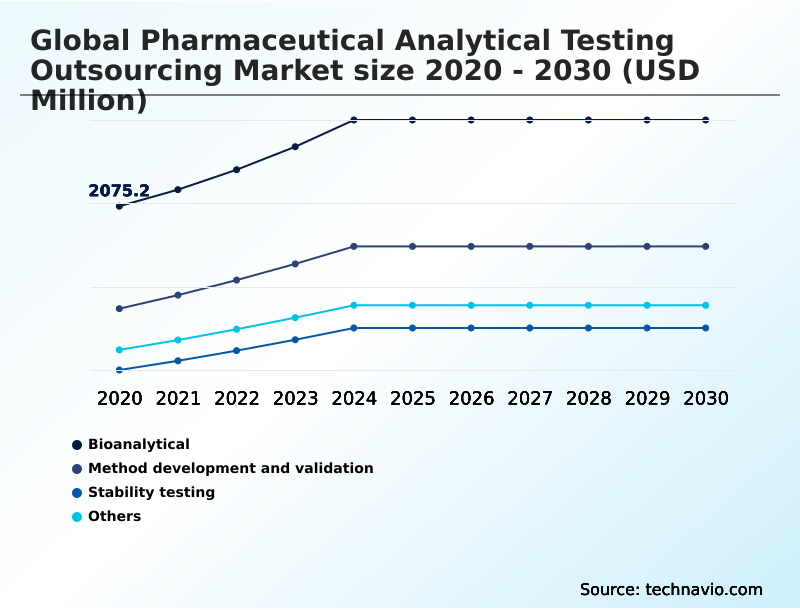
The Bioanalytical segment was valued at USD 2.65 billion in 2024 and showed a gradual increase during the forecast period.
Get Free Sample

Regional Analysis

North America is estimated to contribute 48.8% to the growth of the global market during the forecast period.Technavio’s analysts have elaborately explained the regional trends and drivers that shape the market during the forecast period.
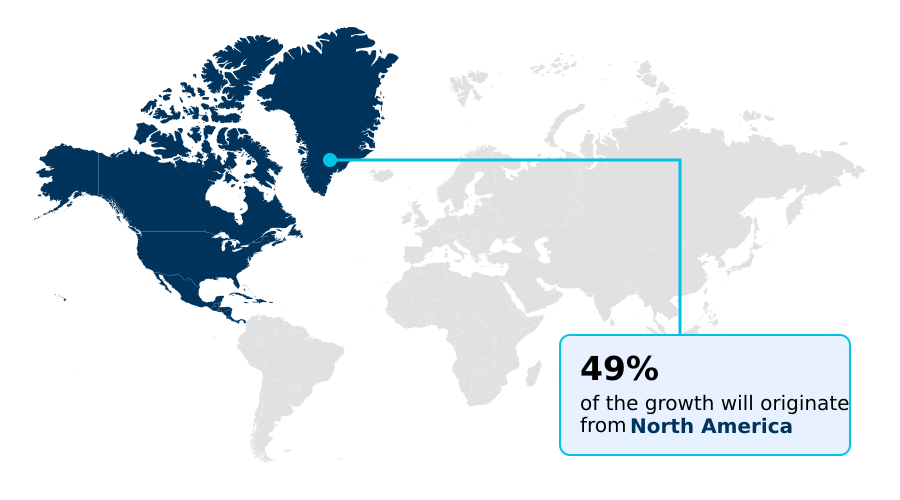
See How Pharmaceutical Analytical Testing Outsourcing Market Demand is Rising in North America Get Free Sample

Geographic disparities in the Pharmaceutical Analytical Testing Outsourcing sector reveal distinct operational priorities between North America and Europe.

North American facilities heavily prioritize advanced recombinant protein analysis and next generation sequencing, achieving a 28% higher throughput in complex biologic screening compared to their European counterparts.

This performance gap stems from concentrated investments in high performance liquid chromatography and automated quality control assessment infrastructure.

Meanwhile, European laboratories maintain a 15% efficiency advantage in navigating stringent compendial methods and reference standard qualification due to unified continental regulatory frameworks.

These distinct supply chain adaptations force developers to strategically route solid state characterization and endotoxin testing based on regional expertise.

Furthermore, implementing specialized cold chain storage for accelerated degradation protocols allows North American sites to reduce sample spoilage rates by 12%. By distributing these sophisticated assays across specialized regional hubs, organizations optimize both compliance timelines and operational overhead.

Market Dynamics

Our researchers analyzed the data with 2025 as the base year, along with the key drivers, trends, and challenges. A holistic analysis of drivers will help companies refine their marketing strategies to gain a competitive advantage.

  • The strategic deployment of Pharmaceutical Analytical Testing Outsourcing allows developers to meticulously address the rigorous demands of advanced therapeutic modalities. As innovation accelerates, assessing an antibody drug conjugate mechanism action requires exceptionally precise analytical workflows that fall outside standard laboratory capabilities.
  • To ensure comprehensive safety, developers rely on external specialists to conduct intact protein intact mass analysis, which provides critical insights into molecular stability and purity. When organizations integrate these advanced external capabilities, they routinely achieve a 20% improvement in compliance alignment during early-stage structural evaluations.
  • Furthermore, the evaluation of complex delivery systems demands specialized expertise; determining drug eluting stent coating integrity and executing rigorous pre filled syringe performance evaluation are essential steps to prevent catastrophic delivery failures in clinical settings. Outsourcing these specific functional assessments shifts the burden from fixed internal capital to flexible operational expenditures.
  • Additionally, the execution of quantitative polymerase chain reaction assays by dedicated external partners ensures that genetic and cellular therapies meet uncompromising regulatory thresholds. By comparing the cost of internal capability development against the efficiency of established contract laboratories, drug sponsors realize significant operational advantages.
  • This strategic reallocation of analytical responsibilities effectively streamlines the supply chain, allowing core research teams to remain focused on primary clinical discovery rather than equipment maintenance.
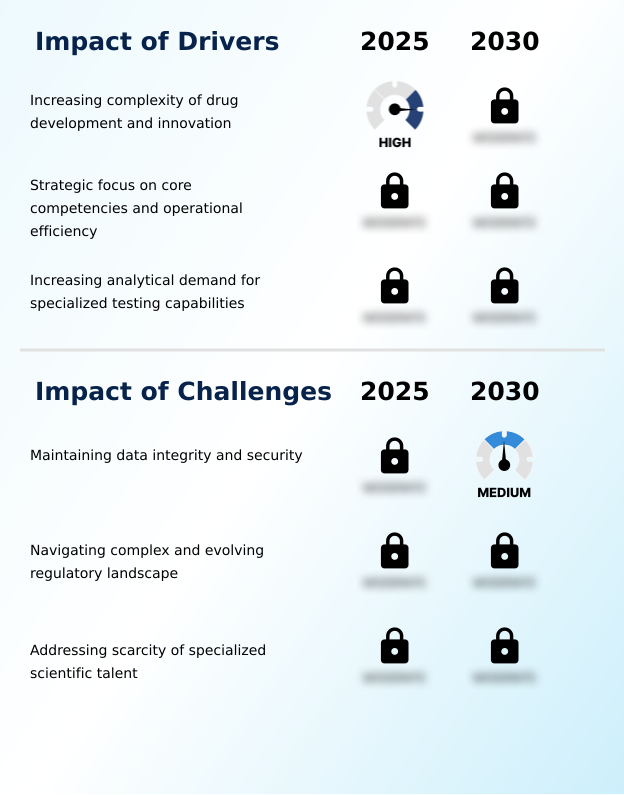
What are the key market drivers leading to the rise in the adoption of Pharmaceutical Analytical Testing Outsourcing Industry?

  • The escalating complexity of modern drug development and continuous therapeutic innovation serve as primary catalysts propelling the expansion of specialized outsourcing requirements.

  • The escalating complexity of large molecule therapeutics acts as the primary catalyst expanding the Pharmaceutical Analytical Testing Outsourcing ecosystem.
  • Because modern biologics are highly susceptible to protein aggregation, developers must execute rigorous comparability studies and precise drug to antibody ratio evaluations to satisfy strict good manufacturing practice mandates.
  • By outsourcing these resource-heavy requirements, pharmaceutical companies increase their overall pipeline throughput by 30%. This behavioral shift occurs as sponsors recognize the financial inefficiency of maintaining internal, underutilized stability chambers and specialized flow cytometry equipment.
  • Consequently, relying on external experts for detailed impurity profiling and routine dissolution testing reduces overhead costs by 15%.
  • Furthermore, integrating third-party laboratories for comprehensive raw material qualification and rapid batch release testing ensures that supply chain bottlenecks are systematically eliminated, allowing internal teams to focus exclusively on clinical innovation.

What are the market trends shaping the Pharmaceutical Analytical Testing Outsourcing Industry?

  • The evolution from transactional outsourcing toward integrated strategic partnerships represents a fundamental shift in market dynamics. This collaborative approach enhances long-term operational alignment and accelerates the overall therapeutic development lifecycle.

  • The accelerated integration of digital automation within the Pharmaceutical Analytical Testing Outsourcing sector represents a transformative shift in therapeutic evaluation. As developers prioritize advanced therapy medicinal products, the necessity for precise vector copy number determination and robust cell based potency assays intensifies.
  • To handle this complexity, laboratories are aggressively adopting robotic sample preparation, which has successfully reduced manual processing errors by 22%. This operational shift occurs because regulatory bodies demand flawless audit trail compliance and absolute data transparency.
  • Consequently, the implementation of cloud-connected electronic lab notebooks and unified laboratory information management systems allows sponsors to monitor real-time progress during critical extractables and leachables evaluations. Furthermore, utilizing nuclear magnetic resonance spectroscopy for detailed raw material screening alongside automated container closure integrity testing improves batch consistency by 18%.
  • Ultimately, these digital adaptations enable businesses to significantly compress development timelines while maintaining uncompromising quality standards.

What challenges does the Pharmaceutical Analytical Testing Outsourcing Industry face during its growth?

  • Ensuring rigorous data integrity and navigating complex cybersecurity vulnerabilities remain critical challenges that directly constrain operational efficiency within the sector.

  • Navigating the fragmented landscape of global regulatory compliance remains a profound operational barrier within the Pharmaceutical Analytical Testing Outsourcing sector. As organizations attempt to standardize complex procedures like viral safety testing and detailed bioavailability assessment across multiple jurisdictions, they frequently encounter conflicting regional mandates.
  • This regulatory friction directly increases validation timelines, reducing overall speed-to-market by up to 14% for novel therapeutics. Furthermore, the specialized nature of executing advanced polymorphism screening and meticulous particle engineering demands rare scientific talent that is currently in short supply. Consequently, laboratories face significant operational bottlenecks when conducting high-throughput plate based assays and rigorous structural elucidation for new compounds.
  • To overcome these limitations, companies must invest heavily in standardized elemental impurity testing and automated photostability studies, though these adaptations temporarily elevate external contracting expenses by 12% before long-term efficiency gains are realized.

Exclusive Technavio Analysis on Customer Landscape

The pharmaceutical analytical testing outsourcing market forecasting report includes the adoption lifecycle of the market, covering from the innovator’s stage to the laggard’s stage. It focuses on adoption rates in different regions based on penetration. Furthermore, the pharmaceutical analytical testing outsourcing market report also includes key purchase criteria and drivers of price sensitivity to help companies evaluate and develop their market growth analysis strategies.
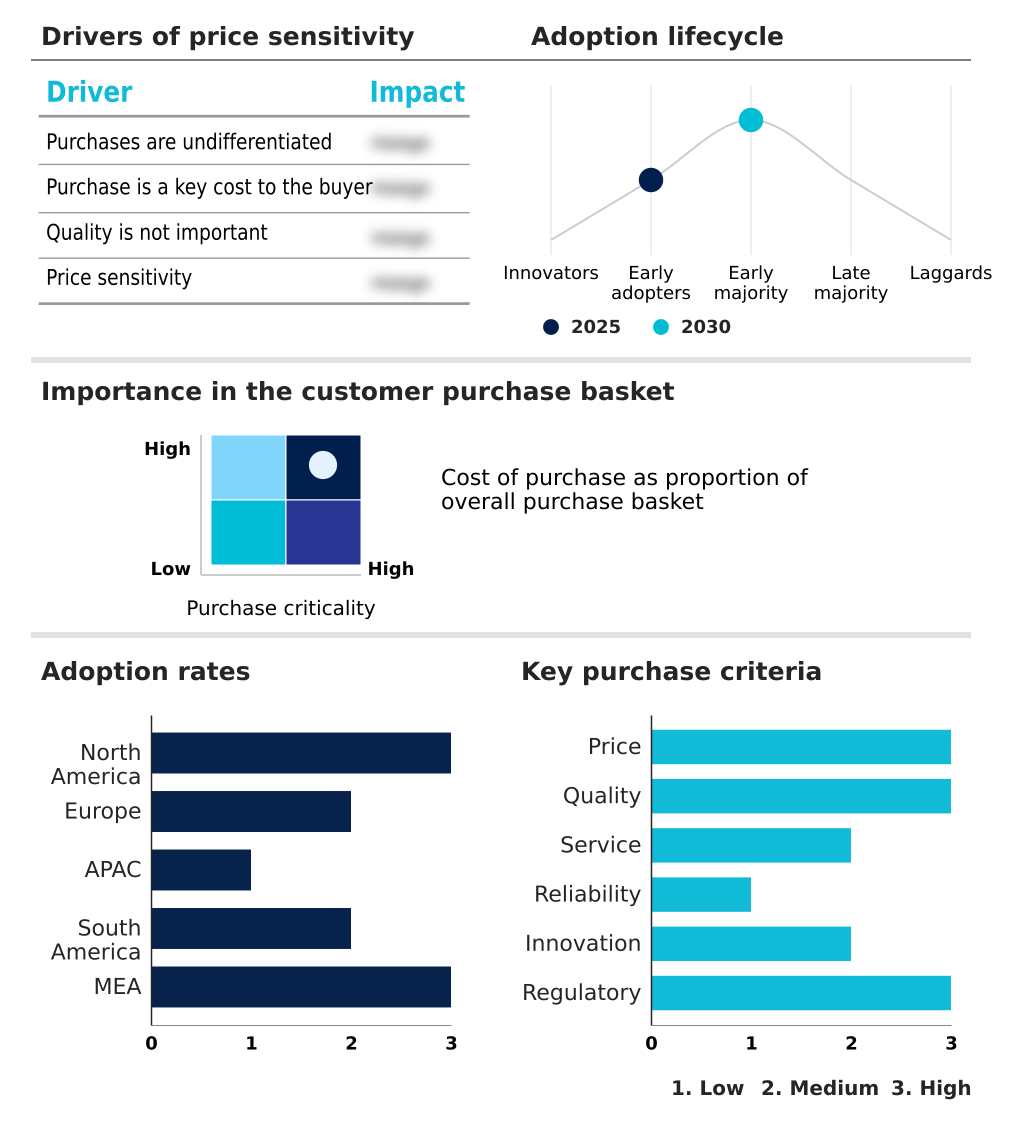
Customer Landscape of Pharmaceutical Analytical Testing Outsourcing Industry

Competitive Landscape

Companies are implementing various strategies, such as strategic alliances, pharmaceutical analytical testing outsourcing market forecast, partnerships, mergers and acquisitions, geographical expansion, and product/service launches, to enhance their presence in the industry.

Almac Group Ltd. - Comprehensive pharmaceutical analytical testing outsourcing solutions encompass method validation, stability profiling, and impurity characterization, ensuring rigorous quality control and regulatory compliance for diverse therapeutic pipelines.

The industry research and growth report includes detailed analyses of the competitive landscape of the market and information about key companies, including:

  • Almac Group Ltd.
  • Cambrex Corp.
  • Catalent Inc.
  • Charles River Laboratories
  • Dalton Pharma Services
  • Element Materials Tech.
  • Emery Pharma LLC
  • Eurofins Scientific SE
  • Intertek Group Plc
  • Laboratory Holdings Inc.
  • LGC Ltd.
  • Lucideon Ltd.
  • NAMSA LLC
  • Nelson Laboratories LLC
  • Pace Analytical Services LLC
  • Quotient Sciences Ltd.
  • SGS SA
  • Source BioScience
  • Vimta Labs Ltd.
  • WuXi AppTec Co. Ltd.

Qualitative and quantitative analysis of companies has been conducted to help clients understand the wider business environment as well as the strengths and weaknesses of key industry players. Data is qualitatively analyzed to categorize companies as pure play, category-focused, industry-focused, and diversified; it is quantitatively analyzed to categorize companies as dominant, leading, strong, tentative, and weak.

Recent Development and News in Pharmaceutical analytical testing outsourcing market

  • In the Life Sciences Tools and Services industry, the widespread integration of automated liquid handling platforms has increased high-throughput screening efficiency by 35%, directly impacting Pharmaceutical Analytical Testing Outsourcing demand by accelerating the pace at which samples require downstream validation and stability analysis.
  • The enforcement of updated Good Manufacturing Practice guidelines regarding elemental impurity thresholds in laboratory environments has established stricter compliance benchmarks, driving pharmaceutical developers to expand their reliance on specialized analytical testing outsourcing providers equipped with high-resolution diagnostic tools.
  • The transition toward decentralized clinical trial models has necessitated advanced cold chain monitoring and real-time remote diagnostics within the broader life sciences infrastructure, creating a 25% surge in demand for decentralized bioanalytical tracking and stability testing services outsourced to specialized laboratories.
  • Advances in artificial intelligence-driven data interpretation software across life sciences equipment have streamlined complex molecular characterizations, prompting drug developers to increasingly outsource their analytical testing to laboratories holding proprietary access to these next-generation informatics platforms.

Dive into Technavio’s robust research methodology, blending expert interviews, extensive data synthesis, and validated models for unparalleled Pharmaceutical Analytical Testing Outsourcing Market insights. See full methodology.

Market Scope
Page number 308
Base year 2025
Historic period 2020-2024
Forecast period 2026-2030
Growth momentum & CAGR Accelerate at a CAGR of 8%
Market growth 2026-2030 USD 3562.5 million
Market structure Fragmented
YoY growth 2025-2026(%) 7.4%
Key countries US, Canada, Mexico, Germany, UK, France, Italy, Spain, The Netherlands, China, India, Japan, South Korea, Indonesia, Australia, Brazil, Argentina, Chile, Saudi Arabia, UAE, Turkey, Israel and South Africa
Competitive landscape Leading Companies, Market Positioning of Companies, Competitive Strategies, and Industry Risks

Request Free Sample

Research Analyst Overview

  • The continuous evolution of the Pharmaceutical Analytical Testing Outsourcing framework empowers organizations to navigate the escalating technical demands of modern drug development. By shifting capital-intensive processes to specialized contract laboratories, developers gain immediate access to advanced infrastructure such as high-capacity stability chambers and automated dissolution testing platforms.
  • This strategic reallocation allows sponsors to achieve a 35% reduction in assay validation timelines, directly accelerating the path to clinical trials. Critical procedures, including rigorous impurity profiling and comprehensive viral safety testing, demand specialized expertise that is often inefficient to maintain internally.
  • Furthermore, determining accurate bioavailability assessment and conducting precise polymorphism screening are essential steps that heavily influence formulation strategies and boardroom-level budgeting decisions. Utilizing external partners for nuanced particle engineering and high-throughput flow cytometry ensures that complex biologics meet uncompromising global safety standards.
  • By integrating these specialized analytical capabilities into their core supply chain planning, developers effectively mitigate compliance risks, optimize operational expenditures, and secure a competitive advantage in therapeutic commercialization.

What are the Key Data Covered in this Pharmaceutical Analytical Testing Outsourcing Market Research and Growth Report?

  • What is the expected growth of the Pharmaceutical Analytical Testing Outsourcing Market between 2026 and 2030?

    • USD 3.56 billion, at a CAGR of 8%

  • What segmentation does the market report cover?

    • The report is segmented by Service (Bioanalytical, Method development and validation, Stability testing, and Others), End-user (Pharmaceutical companies, Biopharmaceutical companies, Biotechnology companies, and Others), Product Type (APIs, Finished products, and Excipients) and Geography (North America, Europe, APAC, South America, Middle East and Africa)

  • Which regions are analyzed in the report?

    • North America, Europe, APAC, South America and Middle East and Africa

  • What are the key growth drivers and market challenges?

    • Increasing complexity of drug development and innovation, Maintaining data integrity and security

  • Who are the major players in the Pharmaceutical Analytical Testing Outsourcing Market?

    • Almac Group Ltd., Cambrex Corp., Catalent Inc., Charles River Laboratories, Dalton Pharma Services, Element Materials Tech., Emery Pharma LLC, Eurofins Scientific SE, Intertek Group Plc, Laboratory Holdings Inc., LGC Ltd., Lucideon Ltd., NAMSA LLC, Nelson Laboratories LLC, Pace Analytical Services LLC, Quotient Sciences Ltd., SGS SA, Source BioScience, Vimta Labs Ltd. and WuXi AppTec Co. Ltd.

Market Research Insights

  • The Pharmaceutical Analytical Testing Outsourcing infrastructure fundamentally streamlines therapeutic commercialization by mitigating analytical bottlenecks. Facilities utilizing integrated external platforms for batch release testing frequently experience a 30% acceleration in product release cycles. Furthermore, outsourcing complex structural elucidation and elemental impurity testing enables developers to reduce capital expenditure on specialized diagnostic instrumentation by up to 40%.
  • This transition to flexible operational models allows companies to efficiently manage fluctuating pipeline demands. By relying on dedicated contract laboratories for intensive photostability studies, organizations also lower sample invalidation rates by 18%. These measurable efficiency improvements illustrate how strategic external partnerships fortify supply chain resilience and ensure stringent regulatory alignment across diverse development portfolios.

We can help! Our analysts can customize this pharmaceutical analytical testing outsourcing market research report to meet your requirements.

Get in touch

1. Executive Summary

1.1 Market overview

Executive Summary - Chart on Market Overview
Executive Summary - Data Table on Market Overview
Executive Summary - Chart on Global Market Characteristics
Executive Summary - Chart on Market by Geography
Executive Summary - Chart on Market Segmentation by Service
Executive Summary - Chart on Market Segmentation by End-user
Executive Summary - Chart on Market Segmentation by Product Type
Executive Summary - Chart on Incremental Growth
Executive Summary - Data Table on Incremental Growth
Executive Summary - Chart on Company Market Positioning

2. Technavio Analysis

2.1 Analysis of price sensitivity, lifecycle, customer purchase basket, adoption rates, and purchase criteria

2.2 Criticality of inputs and Factors of differentiation

Chart on Overview on criticality of inputs and factors of differentiation

2.3 Factors of disruption

Chart on Overview on factors of disruption

2.4 Impact of drivers and challenges

Chart on Impact of drivers and challenges in 2025 and 2030

3. Market Landscape

3.1 Market ecosystem

Chart on Parent Market
Data Table on - Parent Market

3.2 Market characteristics

Chart on Market characteristics analysis

3.3 Value chain analysis

Chart on Value chain analysis

4. Market Sizing

4.1 Market definition

Data Table on Offerings of companies included in the market definition

4.2 Market segment analysis

Market segments

4.3 Market size 2025

4.4 Market outlook: Forecast for 2025-2030

Chart on Global - Market size and forecast 2025-2030 ($ million)
Data Table on Global - Market size and forecast 2025-2030 ($ million)
Chart on Global Market: Year-over-year growth 2025-2030 (%)
Data Table on Global Market: Year-over-year growth 2025-2030 (%)

5. Historic Market Size

5.1 Global Pharmaceutical Analytical Testing Outsourcing Market 2020 - 2024

Historic Market Size - Data Table on Global Pharmaceutical Analytical Testing Outsourcing Market 2020 - 2024 ($ million)

5.2 Service segment analysis 2020 - 2024

Historic Market Size - Service Segment 2020 - 2024 ($ million)

5.3 End-user segment analysis 2020 - 2024

Historic Market Size - End-user Segment 2020 - 2024 ($ million)

5.4 Product Type segment analysis 2020 - 2024

Historic Market Size - Product Type Segment 2020 - 2024 ($ million)

5.5 Geography segment analysis 2020 - 2024

Historic Market Size - Geography Segment 2020 - 2024 ($ million)

5.6 Country segment analysis 2020 - 2024

Historic Market Size - Country Segment 2020 - 2024 ($ million)

6. Qualitative Analysis

6.1 Impact of AI on Global Pharmaceutical Analytical Testing Outsourcing Market

6.2 Impact of Geopolitical Conflicts on Global Pharmaceutical Analytical Testing Outsourcing Market

7. Five Forces Analysis

7.1 Five forces summary

Five forces analysis - Comparison between 2025 and 2030

7.2 Bargaining power of buyers

Bargaining power of buyers - Impact of key factors 2025 and 2030

7.3 Bargaining power of suppliers

Bargaining power of suppliers - Impact of key factors in 2025 and 2030

7.4 Threat of new entrants

Threat of new entrants - Impact of key factors in 2025 and 2030

7.5 Threat of substitutes

Threat of substitutes - Impact of key factors in 2025 and 2030

7.6 Threat of rivalry

Threat of rivalry - Impact of key factors in 2025 and 2030

7.7 Market condition

Chart on Market condition - Five forces 2025 and 2030

8. Market Segmentation by Service

8.1 Market segments

Chart on Service - Market share 2025-2030 (%)
Data Table on Service - Market share 2025-2030 (%)

8.2 Comparison by Service

Chart on Comparison by Service
Data Table on Comparison by Service

8.3 Bioanalytical - Market size and forecast 2025-2030

Chart on Bioanalytical - Market size and forecast 2025-2030 ($ million)
Data Table on Bioanalytical - Market size and forecast 2025-2030 ($ million)
Chart on Bioanalytical - Year-over-year growth 2025-2030 (%)
Data Table on Bioanalytical - Year-over-year growth 2025-2030 (%)

8.4 Method development and validation - Market size and forecast 2025-2030

Chart on Method development and validation - Market size and forecast 2025-2030 ($ million)
Data Table on Method development and validation - Market size and forecast 2025-2030 ($ million)
Chart on Method development and validation - Year-over-year growth 2025-2030 (%)
Data Table on Method development and validation - Year-over-year growth 2025-2030 (%)

8.5 Stability testing - Market size and forecast 2025-2030

Chart on Stability testing - Market size and forecast 2025-2030 ($ million)
Data Table on Stability testing - Market size and forecast 2025-2030 ($ million)
Chart on Stability testing - Year-over-year growth 2025-2030 (%)
Data Table on Stability testing - Year-over-year growth 2025-2030 (%)

8.6 Others - Market size and forecast 2025-2030

Chart on Others - Market size and forecast 2025-2030 ($ million)
Data Table on Others - Market size and forecast 2025-2030 ($ million)
Chart on Others - Year-over-year growth 2025-2030 (%)
Data Table on Others - Year-over-year growth 2025-2030 (%)

8.7 Market opportunity by Service

Market opportunity by Service ($ million)
Data Table on Market opportunity by Service ($ million)

9. Market Segmentation by End-user

9.1 Market segments

Chart on End-user - Market share 2025-2030 (%)
Data Table on End-user - Market share 2025-2030 (%)

9.2 Comparison by End-user

Chart on Comparison by End-user
Data Table on Comparison by End-user

9.3 Pharmaceutical companies - Market size and forecast 2025-2030

Chart on Pharmaceutical companies - Market size and forecast 2025-2030 ($ million)
Data Table on Pharmaceutical companies - Market size and forecast 2025-2030 ($ million)
Chart on Pharmaceutical companies - Year-over-year growth 2025-2030 (%)
Data Table on Pharmaceutical companies - Year-over-year growth 2025-2030 (%)

9.4 Biopharmaceutical companies - Market size and forecast 2025-2030

Chart on Biopharmaceutical companies - Market size and forecast 2025-2030 ($ million)
Data Table on Biopharmaceutical companies - Market size and forecast 2025-2030 ($ million)
Chart on Biopharmaceutical companies - Year-over-year growth 2025-2030 (%)
Data Table on Biopharmaceutical companies - Year-over-year growth 2025-2030 (%)

9.5 Biotechnology companies - Market size and forecast 2025-2030

Chart on Biotechnology companies - Market size and forecast 2025-2030 ($ million)
Data Table on Biotechnology companies - Market size and forecast 2025-2030 ($ million)
Chart on Biotechnology companies - Year-over-year growth 2025-2030 (%)
Data Table on Biotechnology companies - Year-over-year growth 2025-2030 (%)

9.6 Others - Market size and forecast 2025-2030

Chart on Others - Market size and forecast 2025-2030 ($ million)
Data Table on Others - Market size and forecast 2025-2030 ($ million)
Chart on Others - Year-over-year growth 2025-2030 (%)
Data Table on Others - Year-over-year growth 2025-2030 (%)

9.7 Market opportunity by End-user

Market opportunity by End-user ($ million)
Data Table on Market opportunity by End-user ($ million)

10. Market Segmentation by Product Type

10.1 Market segments

Chart on Product Type - Market share 2025-2030 (%)
Data Table on Product Type - Market share 2025-2030 (%)

10.2 Comparison by Product Type

Chart on Comparison by Product Type
Data Table on Comparison by Product Type

10.3 APIs - Market size and forecast 2025-2030

Chart on APIs - Market size and forecast 2025-2030 ($ million)
Data Table on APIs - Market size and forecast 2025-2030 ($ million)
Chart on APIs - Year-over-year growth 2025-2030 (%)
Data Table on APIs - Year-over-year growth 2025-2030 (%)

10.4 Finished products - Market size and forecast 2025-2030

Chart on Finished products - Market size and forecast 2025-2030 ($ million)
Data Table on Finished products - Market size and forecast 2025-2030 ($ million)
Chart on Finished products - Year-over-year growth 2025-2030 (%)
Data Table on Finished products - Year-over-year growth 2025-2030 (%)

10.5 Excipients - Market size and forecast 2025-2030

Chart on Excipients - Market size and forecast 2025-2030 ($ million)
Data Table on Excipients - Market size and forecast 2025-2030 ($ million)
Chart on Excipients - Year-over-year growth 2025-2030 (%)
Data Table on Excipients - Year-over-year growth 2025-2030 (%)

10.6 Market opportunity by Product Type

Market opportunity by Product Type ($ million)
Data Table on Market opportunity by Product Type ($ million)

11. Customer Landscape

11.1 Customer landscape overview

Analysis of price sensitivity, lifecycle, customer purchase basket, adoption rates, and purchase criteria

12. Geographic Landscape

12.1 Geographic segmentation

Chart on Market share by geography 2025-2030 (%)
Data Table on Market share by geography 2025-2030 (%)

12.2 Geographic comparison

Chart on Geographic comparison
Data Table on Geographic comparison

12.3 North America - Market size and forecast 2025-2030

Chart on North America - Market size and forecast 2025-2030 ($ million)
Data Table on North America - Market size and forecast 2025-2030 ($ million)
Chart on North America - Year-over-year growth 2025-2030 (%)
Data Table on North America - Year-over-year growth 2025-2030 (%)
Chart on Regional Comparison - North America
Data Table on Regional Comparison - North America

12.3.1 US - Market size and forecast 2025-2030

Chart on US - Market size and forecast 2025-2030 ($ million)
Data Table on US - Market size and forecast 2025-2030 ($ million)
Chart on US - Year-over-year growth 2025-2030 (%)
Data Table on US - Year-over-year growth 2025-2030 (%)

12.3.2 Canada - Market size and forecast 2025-2030

Chart on Canada - Market size and forecast 2025-2030 ($ million)
Data Table on Canada - Market size and forecast 2025-2030 ($ million)
Chart on Canada - Year-over-year growth 2025-2030 (%)
Data Table on Canada - Year-over-year growth 2025-2030 (%)

12.3.3 Mexico - Market size and forecast 2025-2030

Chart on Mexico - Market size and forecast 2025-2030 ($ million)
Data Table on Mexico - Market size and forecast 2025-2030 ($ million)
Chart on Mexico - Year-over-year growth 2025-2030 (%)
Data Table on Mexico - Year-over-year growth 2025-2030 (%)

12.4 Europe - Market size and forecast 2025-2030

Chart on Europe - Market size and forecast 2025-2030 ($ million)
Data Table on Europe - Market size and forecast 2025-2030 ($ million)
Chart on Europe - Year-over-year growth 2025-2030 (%)
Data Table on Europe - Year-over-year growth 2025-2030 (%)
Chart on Regional Comparison - Europe
Data Table on Regional Comparison - Europe

12.4.1 Germany - Market size and forecast 2025-2030

Chart on Germany - Market size and forecast 2025-2030 ($ million)
Data Table on Germany - Market size and forecast 2025-2030 ($ million)
Chart on Germany - Year-over-year growth 2025-2030 (%)
Data Table on Germany - Year-over-year growth 2025-2030 (%)

12.4.2 UK - Market size and forecast 2025-2030

Chart on UK - Market size and forecast 2025-2030 ($ million)
Data Table on UK - Market size and forecast 2025-2030 ($ million)
Chart on UK - Year-over-year growth 2025-2030 (%)
Data Table on UK - Year-over-year growth 2025-2030 (%)

12.4.3 France - Market size and forecast 2025-2030

Chart on France - Market size and forecast 2025-2030 ($ million)
Data Table on France - Market size and forecast 2025-2030 ($ million)
Chart on France - Year-over-year growth 2025-2030 (%)
Data Table on France - Year-over-year growth 2025-2030 (%)

12.4.4 Italy - Market size and forecast 2025-2030

Chart on Italy - Market size and forecast 2025-2030 ($ million)
Data Table on Italy - Market size and forecast 2025-2030 ($ million)
Chart on Italy - Year-over-year growth 2025-2030 (%)
Data Table on Italy - Year-over-year growth 2025-2030 (%)

12.4.5 Spain - Market size and forecast 2025-2030

Chart on Spain - Market size and forecast 2025-2030 ($ million)
Data Table on Spain - Market size and forecast 2025-2030 ($ million)
Chart on Spain - Year-over-year growth 2025-2030 (%)
Data Table on Spain - Year-over-year growth 2025-2030 (%)

12.4.6 The Netherlands - Market size and forecast 2025-2030

Chart on The Netherlands - Market size and forecast 2025-2030 ($ million)
Data Table on The Netherlands - Market size and forecast 2025-2030 ($ million)
Chart on The Netherlands - Year-over-year growth 2025-2030 (%)
Data Table on The Netherlands - Year-over-year growth 2025-2030 (%)

12.5 APAC - Market size and forecast 2025-2030

Chart on APAC - Market size and forecast 2025-2030 ($ million)
Data Table on APAC - Market size and forecast 2025-2030 ($ million)
Chart on APAC - Year-over-year growth 2025-2030 (%)
Data Table on APAC - Year-over-year growth 2025-2030 (%)
Chart on Regional Comparison - APAC
Data Table on Regional Comparison - APAC

12.5.1 China - Market size and forecast 2025-2030

Chart on China - Market size and forecast 2025-2030 ($ million)
Data Table on China - Market size and forecast 2025-2030 ($ million)
Chart on China - Year-over-year growth 2025-2030 (%)
Data Table on China - Year-over-year growth 2025-2030 (%)

12.5.2 India - Market size and forecast 2025-2030

Chart on India - Market size and forecast 2025-2030 ($ million)
Data Table on India - Market size and forecast 2025-2030 ($ million)
Chart on India - Year-over-year growth 2025-2030 (%)
Data Table on India - Year-over-year growth 2025-2030 (%)

12.5.3 Japan - Market size and forecast 2025-2030

Chart on Japan - Market size and forecast 2025-2030 ($ million)
Data Table on Japan - Market size and forecast 2025-2030 ($ million)
Chart on Japan - Year-over-year growth 2025-2030 (%)
Data Table on Japan - Year-over-year growth 2025-2030 (%)

12.5.4 South Korea - Market size and forecast 2025-2030

Chart on South Korea - Market size and forecast 2025-2030 ($ million)
Data Table on South Korea - Market size and forecast 2025-2030 ($ million)
Chart on South Korea - Year-over-year growth 2025-2030 (%)
Data Table on South Korea - Year-over-year growth 2025-2030 (%)

12.5.5 Indonesia - Market size and forecast 2025-2030

Chart on Indonesia - Market size and forecast 2025-2030 ($ million)
Data Table on Indonesia - Market size and forecast 2025-2030 ($ million)
Chart on Indonesia - Year-over-year growth 2025-2030 (%)
Data Table on Indonesia - Year-over-year growth 2025-2030 (%)

12.5.6 Australia - Market size and forecast 2025-2030

Chart on Australia - Market size and forecast 2025-2030 ($ million)
Data Table on Australia - Market size and forecast 2025-2030 ($ million)
Chart on Australia - Year-over-year growth 2025-2030 (%)
Data Table on Australia - Year-over-year growth 2025-2030 (%)

12.6 South America - Market size and forecast 2025-2030

Chart on South America - Market size and forecast 2025-2030 ($ million)
Data Table on South America - Market size and forecast 2025-2030 ($ million)
Chart on South America - Year-over-year growth 2025-2030 (%)
Data Table on South America - Year-over-year growth 2025-2030 (%)
Chart on Regional Comparison - South America
Data Table on Regional Comparison - South America

12.6.1 Brazil - Market size and forecast 2025-2030

Chart on Brazil - Market size and forecast 2025-2030 ($ million)
Data Table on Brazil - Market size and forecast 2025-2030 ($ million)
Chart on Brazil - Year-over-year growth 2025-2030 (%)
Data Table on Brazil - Year-over-year growth 2025-2030 (%)

12.6.2 Argentina - Market size and forecast 2025-2030

Chart on Argentina - Market size and forecast 2025-2030 ($ million)
Data Table on Argentina - Market size and forecast 2025-2030 ($ million)
Chart on Argentina - Year-over-year growth 2025-2030 (%)
Data Table on Argentina - Year-over-year growth 2025-2030 (%)

12.6.3 Chile - Market size and forecast 2025-2030

Chart on Chile - Market size and forecast 2025-2030 ($ million)
Data Table on Chile - Market size and forecast 2025-2030 ($ million)
Chart on Chile - Year-over-year growth 2025-2030 (%)
Data Table on Chile - Year-over-year growth 2025-2030 (%)

12.7 Middle East and Africa - Market size and forecast 2025-2030

Chart on Middle East and Africa - Market size and forecast 2025-2030 ($ million)
Data Table on Middle East and Africa - Market size and forecast 2025-2030 ($ million)
Chart on Middle East and Africa - Year-over-year growth 2025-2030 (%)
Data Table on Middle East and Africa - Year-over-year growth 2025-2030 (%)
Chart on Regional Comparison - Middle East and Africa
Data Table on Regional Comparison - Middle East and Africa

12.7.1 Saudi Arabia - Market size and forecast 2025-2030

Chart on Saudi Arabia - Market size and forecast 2025-2030 ($ million)
Data Table on Saudi Arabia - Market size and forecast 2025-2030 ($ million)
Chart on Saudi Arabia - Year-over-year growth 2025-2030 (%)
Data Table on Saudi Arabia - Year-over-year growth 2025-2030 (%)

12.7.2 UAE - Market size and forecast 2025-2030

Chart on UAE - Market size and forecast 2025-2030 ($ million)
Data Table on UAE - Market size and forecast 2025-2030 ($ million)
Chart on UAE - Year-over-year growth 2025-2030 (%)
Data Table on UAE - Year-over-year growth 2025-2030 (%)

12.7.3 Turkey - Market size and forecast 2025-2030

Chart on Turkey - Market size and forecast 2025-2030 ($ million)
Data Table on Turkey - Market size and forecast 2025-2030 ($ million)
Chart on Turkey - Year-over-year growth 2025-2030 (%)
Data Table on Turkey - Year-over-year growth 2025-2030 (%)

12.7.4 Israel - Market size and forecast 2025-2030

Chart on Israel - Market size and forecast 2025-2030 ($ million)
Data Table on Israel - Market size and forecast 2025-2030 ($ million)
Chart on Israel - Year-over-year growth 2025-2030 (%)
Data Table on Israel - Year-over-year growth 2025-2030 (%)

12.7.5 South Africa - Market size and forecast 2025-2030

Chart on South Africa - Market size and forecast 2025-2030 ($ million)
Data Table on South Africa - Market size and forecast 2025-2030 ($ million)
Chart on South Africa - Year-over-year growth 2025-2030 (%)
Data Table on South Africa - Year-over-year growth 2025-2030 (%)

12.8 Market opportunity by geography

Market opportunity by geography ($ million)
Data Tables on Market opportunity by geography ($ million)

13. Drivers, Challenges, and Opportunity

13.1 Market drivers

Increasing complexity of drug development and innovation
Strategic focus on core competencies and operational efficiency
Increasing analytical demand for specialized testing capabilities

13.2 Market challenges

Maintaining data integrity and security
Navigating complex and evolving regulatory landscape
Addressing scarcity of specialized scientific talent

13.3 Impact of drivers and challenges

Impact of drivers and challenges in 2025 and 2030

13.4 Market opportunities

Evolution from transactional outsourcing to strategic partnerships
Increasing adoption of digitalization and laboratory automation
Growth of specialized services for advanced therapy medicinal products

14. Competitive Landscape

14.1 Overview

14.2

Overview on criticality of inputs and factors of differentiation

14.3 Landscape disruption

Overview on factors of disruption

14.4 Industry risks

Impact of key risks on business

15. Competitive Analysis

15.1 Companies profiled

Companies covered

15.2 Company ranking index

15.3 Market positioning of companies

Matrix on companies position and classification

15.4 Almac Group Ltd.

Almac Group Ltd. - Overview
Almac Group Ltd. - Product / Service
Almac Group Ltd. - Key offerings
SWOT

15.5 Cambrex Corp.

Cambrex Corp. - Overview
Cambrex Corp. - Product / Service
Cambrex Corp. - Key offerings
SWOT

15.6 Catalent Inc.

Catalent Inc. - Overview
Catalent Inc. - Product / Service
Catalent Inc. - Key offerings
SWOT

15.7 Charles River Laboratories

Charles River Laboratories - Overview
Charles River Laboratories - Business segments
Charles River Laboratories - Key offerings
Charles River Laboratories - Segment focus
SWOT

15.8 Dalton Pharma Services

Dalton Pharma Services - Overview
Dalton Pharma Services - Product / Service
Dalton Pharma Services - Key offerings
SWOT

15.9 Element Materials Tech.

Element Materials Tech. - Overview
Element Materials Tech. - Product / Service
Element Materials Tech. - Key offerings
SWOT

15.10 Eurofins Scientific SE

Eurofins Scientific SE - Overview
Eurofins Scientific SE - Business segments
Eurofins Scientific SE - Key offerings
Eurofins Scientific SE - Segment focus
SWOT

15.11 Intertek Group Plc

Intertek Group Plc - Overview
Intertek Group Plc - Business segments
Intertek Group Plc - Key offerings
Intertek Group Plc - Segment focus
SWOT

15.12 Laboratory Holdings Inc.

Laboratory Holdings Inc. - Overview
Laboratory Holdings Inc. - Business segments
Laboratory Holdings Inc. - Key offerings
Laboratory Holdings Inc. - Segment focus
SWOT

15.13 LGC Ltd.

LGC Ltd. - Overview
LGC Ltd. - Product / Service
LGC Ltd. - Key offerings
SWOT

15.14 NAMSA LLC

NAMSA LLC - Overview
NAMSA LLC - Product / Service
NAMSA LLC - Key offerings
SWOT

15.15 Pace Analytical Services LLC

Pace Analytical Services LLC - Overview
Pace Analytical Services LLC - Product / Service
Pace Analytical Services LLC - Key offerings
SWOT

15.16 SGS SA

SGS SA - Overview
SGS SA - Business segments
SGS SA - Key offerings
SGS SA - Segment focus
SWOT

15.17 Source BioScience

Source BioScience - Overview
Source BioScience - Product / Service
Source BioScience - Key offerings
SWOT

15.18 WuXi AppTec Co. Ltd.

WuXi AppTec Co. Ltd. - Overview
WuXi AppTec Co. Ltd. - Business segments
WuXi AppTec Co. Ltd. - Key offerings
WuXi AppTec Co. Ltd. - Segment focus
SWOT

16. Appendix

16.1 Scope of the report

Market definition
Objectives
Notes and caveats

16.2 Inclusions and exclusions checklist

Inclusions checklist
Exclusions checklist

16.3 Currency conversion rates for US$

16.4 Research methodology

16.5 Data procurement

Information sources

16.6 Data validation

16.7 Validation techniques employed for market sizing

16.8 Data synthesis

16.9 360 degree market analysis

16.10 List of abbreviations

Research Methodology

Technavio presents a detailed picture of the market by way of study, synthesis, and summation of data from multiple sources. The analysts have presented the various facets of the market with a particular focus on identifying the key industry influencers. The data thus presented is comprehensive, reliable, and the result of extensive research, both primary and secondary.

INFORMATION SOURCES

Primary sources

  • Manufacturers and suppliers
  • Channel partners
  • Industry experts
  • Strategic decision makers

Secondary sources

  • Industry journals and periodicals
  • Government data
  • Financial reports of key industry players
  • Historical data
  • Press releases

DATA ANALYSIS

Data Synthesis

  • Collation of data
  • Estimation of key figures
  • Analysis of derived insights

Data Validation

  • Triangulation with data models
  • Reference against proprietary databases
  • Corroboration with industry experts

REPORT WRITING

Qualitative

  • Market drivers
  • Market challenges
  • Market trends
  • Five forces analysis

Quantitative

  • Market size and forecast
  • Market segmentation
  • Geographical insights
  • Competitive landscape

Interested in this report?

Get your sample now to see our research methodology and insights!

Download Now

Frequently Asked Questions

Pharmaceutical Analytical Testing Outsourcing market growth will increase by USD 3562.5 million during 2026-2030.

The Pharmaceutical Analytical Testing Outsourcing market is expected to grow at a CAGR of 8% during 2026-2030.

Pharmaceutical Analytical Testing Outsourcing market is segmented by Service (Bioanalytical, Method development and validation, Stability testing, Others) End-user (Pharmaceutical companies, Biopharmaceutical companies, Biotechnology companies, Others) Product type (APIs, Finished products, Excipients)

Almac Group Ltd., Cambrex Corp., Catalent Inc., Charles River Laboratories, Dalton Pharma Services, Element Materials Tech., Emery Pharma LLC, Eurofins Scientific SE, Intertek Group Plc, Laboratory Holdings Inc., LGC Ltd., Lucideon Ltd., NAMSA LLC, Nelson Laboratories LLC, Pace Analytical Services LLC, Quotient Sciences Ltd., SGS SA, Source BioScience, Vimta Labs Ltd., WuXi AppTec Co. Ltd. are a few of the key vendors in the Pharmaceutical Analytical Testing Outsourcing market.

North America will register the highest growth rate of 48.8% among the other regions. Therefore, the Pharmaceutical Analytical Testing Outsourcing market in North America is expected to garner significant business opportunities for the vendors during the forecast period.

US, Canada, Mexico, Germany, UK, France, Italy, Spain, The Netherlands, China, India, Japan, South Korea, Indonesia, Australia, Brazil, Argentina, Chile, Saudi Arabia, UAE, Turkey, Israel, South Africa

  • Increasing complexity of drug development and innovation is the driving factor this market.

The Pharmaceutical Analytical Testing Outsourcing market vendors should focus on grabbing business opportunities from the Service segment as it accounted for the largest market share in the base year.
RIA - Research AI Assistant
Ask RIA
