Racing Apparel Market Size 2025-2029
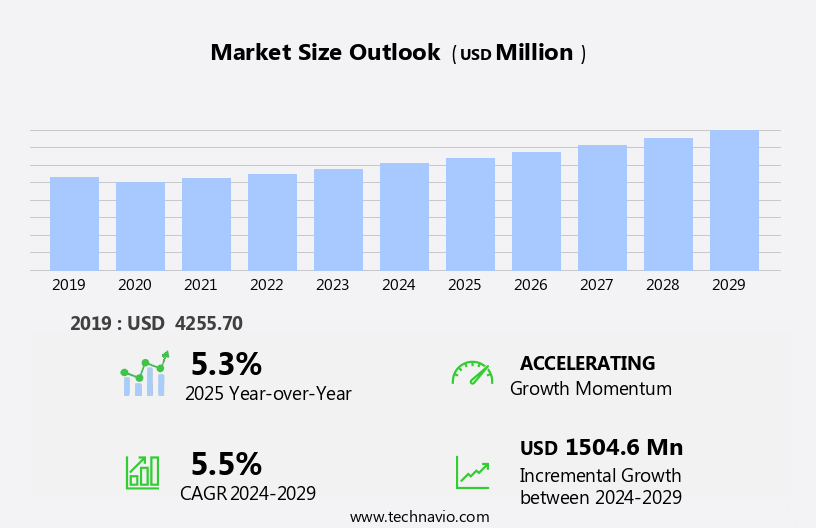
The racing apparel market size is forecast to increase by USD 1.5 billion at a CAGR of 5.5% between 2024 and 2029.
- The market is driven by continuous product innovation and portfolio extension, leading to product premiumization. This trend reflects the industry's focus on catering to the evolving needs and preferences of racing enthusiasts. Another significant factor fueling market growth is the increased participation of women in racing sports. Contact points require special attention, as do helmets with protective shields, sensors, and potential integration with GPS-connected devices and intelligent sensor helmets. This demographic shift presents a substantial opportunity for companies to expand their customer base and tap into new revenue streams. However, the market landscape is fraught with challenges. Intense competition among companies has led to a price war, putting pressure on profit margins.
- To navigate this obstacle, companies must differentiate themselves through product quality, unique features, and effective marketing strategies. Additionally, staying abreast of consumer trends and preferences, as well as adhering to regulatory requirements, is crucial for maintaining a competitive edge in the market. Key product categories include pants, jackets, boots, gloves, and helmets, all engineered to provide superior protection against impact, contact points, and debris.
What will be the Size of the Racing Apparel Market during the forecast period?
Explore in-depth regional segment analysis with market size data - historical 2019-2023 and forecasts 2025-2029 - in the full report.
Request Free Sample
- In the dynamic market, sustainability is a key trend driving innovation. Brands are focusing on reducing carbon footprints through methods like sustainable production, using bio-based materials and recycled polyester. Training programs and data analytics help athletes optimize performance, while ergonomic design ensures comfort during intense workouts. Athlete data is increasingly important, with triathlon suits and aero skinsuits incorporating performance monitoring and biometric monitoring. Smart fabrics and wearable technology enable personalized apparel and mass customization, catering to individual needs. Mountain biking apparel and road cycling apparel continue to evolve, with thermal jackets, arm warmers, leg warmers, and aero skinsuits enhancing protection and efficiency.
- Circular economy principles are gaining traction, with brands embracing 3D printing apparel and promoting the reuse of materials. Bike storage solutions and sports nutrition complement the market, ensuring optimal preparation and recovery. Hydration packs and performance tracking tools enable athletes to stay focused during long races. Overall, the market is a vibrant space, with continuous innovation and a strong focus on enhancing athlete performance and reducing environmental impact.
How is this Racing Apparel Industry segmented?
The racing apparel industry research report provides comprehensive data (region-wise segment analysis), with forecasts and estimates in "USD million" for the period 2025-2029, as well as historical data from 2019-2023 for the following segments.
- Distribution Channel
- Offline
- Online
- End-user
- Male
- Female
- Product
- Protection Gear
- Racing Suits
- Footwear
- Accessories
- Geography
- North America
- US
- Canada
- Europe
- France
- Germany
- Italy
- UK
- APAC
- China
- India
- Japan
- South Korea
- Rest of World (ROW)
- North America
By Distribution Channel Insights
The offline segment is estimated to witness significant growth during the forecast period. The market encompasses a range of products, including compression garments, base layers, bike shorts, cycling jerseys, race suits, and more. Manufacturers prioritize lightweight materials, quality control, and innovative fabric compositions for enhanced performance. Printing techniques, such as sublimation, digital, and screen printing, add visual appeal and personalization. E-commerce platforms facilitate direct-to-consumer sales, while ethical sourcing and supply chain transparency are essential for brand awareness. Safety features, like reflective elements and wind resistance, are crucial for racers. Pricing strategies vary, with performance marketing and team kits catering to professional athletes, while custom designs and body mapping cater to individual preferences. Thermal regulation, moisture-wicking fabrics, and ventilation systems ensure comfort and endurance.
Recycled materials and anti-microbial treatment contribute to sustainability and hygiene. Performance enhancement through UV protection and padded shorts is a growing trend. Racing regulations influence pocket configuration, testing standards, and zipper placement. Manufacturers collaborate with influencers and retailers for marketing, while wholesale partnerships expand reach. Ventilation systems, mesh panels, and breathable materials ensure optimal comfort and breathability. The market's dynamics reflect the evolving needs of racers and consumers, with a focus on innovation, performance, and sustainability. Riders seek apparel that provides warmth and coolness in varying weather conditions, with sun and rain protection also essential.
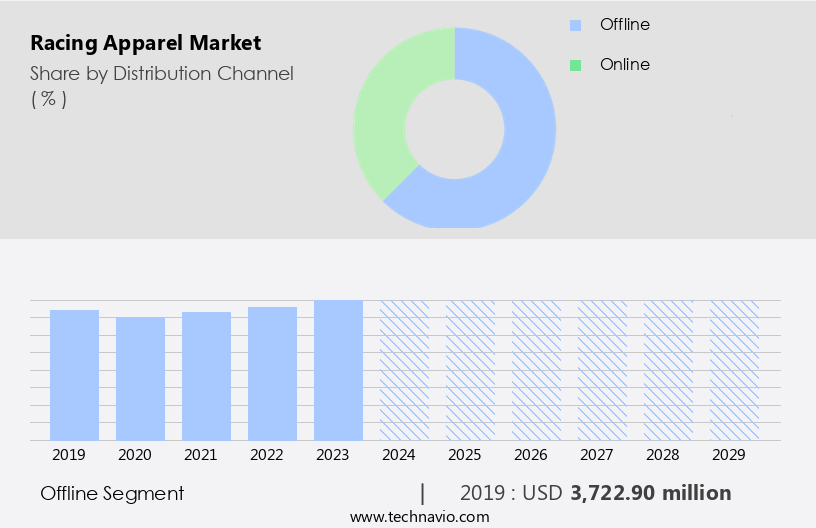
The Offline segment was valued at USD 3.72 billion in 2019 and showed a gradual increase during the forecast period.
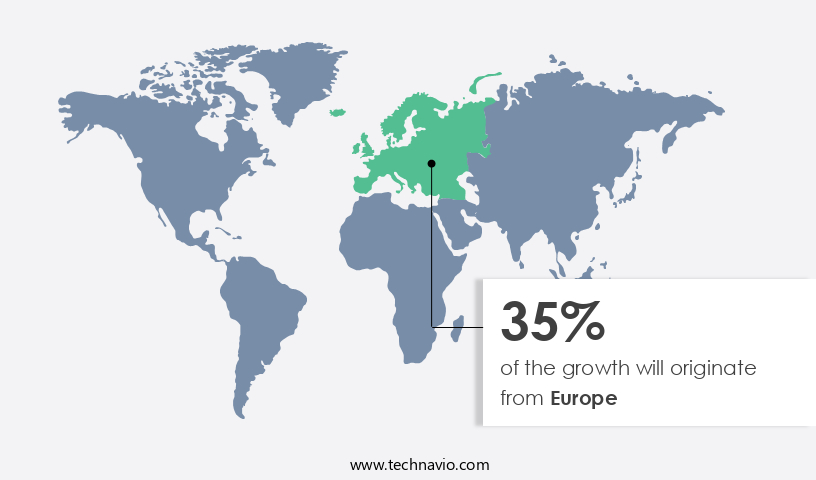
Regional Analysis
Europe is estimated to contribute 35% to the growth of the global market during the forecast period. Technavio's analysts have elaborately explained the regional trends and drivers that shape the market during the forecast period.
The market is experiencing significant growth, driven by the demand for compression garments, lightweight materials, and advanced fabric technologies. Quality control and ethical sourcing are essential considerations for manufacturers, ensuring the production of high-performance apparel. Printing techniques, such as sublimation and digital printing, offer custom designs and product differentiation. E-commerce platforms facilitate direct-to-consumer sales, enabling brands to reach a wider audience. Recycled materials and safety features, including UV protection, anti-microbial treatment, and performance enhancement, cater to environmentally-conscious consumers and athletes. Aerodynamic designs, ventilation systems, and wind resistance contribute to improved performance. Pricing strategies, such as value proposition and brand awareness, influence consumer decisions.
Team kits, social media marketing, and retail distribution expand market reach. Race regulations, pocket configuration, testing standards, and moisture-wicking fabrics ensure product functionality and compliance. Wholesale partnerships and custom designs, including body mapping and thermal regulation, cater to various market segments. Influencer marketing and zipper placement add to the overall appeal of racing apparel. The market is expected to continue evolving, with innovations in performance fabrics, breathable materials, and performance marketing. The market is expected to grow steadily due to increasing motorcycle sales, technological advancements, and the popularity of motorsport culture.
Market Dynamics
Our researchers analyzed the data with 2024 as the base year, along with the key drivers, trends, and challenges. A holistic analysis of drivers will help companies refine their marketing strategies to gain a competitive advantage.
What are the Racing Apparel market drivers leading to the rise in the adoption of Industry?
- Product innovation and portfolio expansion in the market, through the introduction of premium items, are the primary factors fueling market growth. The market has experienced significant competition and innovation in recent years. Consumers' evolving preferences and demands have driven companies to invest in research and development to stay competitive. Product offerings have expanded to include advanced designs, technologies, and features, such as UV protection, anti-microbial treatment, thermal regulation, and ventilation systems. Reflective elements and custom designs with body mapping have also gained popularity.
- Companies prioritize safety, ensuring their products meet high safety standards. This continuous innovation and product development have led to a diverse and competitive market, with a focus on delivering efficient, high-performing, and safe racing apparel for customers. Performance enhancement is a key focus, with companies emphasizing product differentiation through unique features and technologies. Direct-to-consumer sales have become increasingly common, allowing for greater customization and personalization. Moreover, the importance of protective shields extends to helmets, which often incorporate advanced technologies like airbags, sensors, and artificial intelligence to enhance safety.
What are the Racing Apparel market trends shaping the Industry?
- The growing trend in racing sports is characterized by an increased presence of women participants. This development reflects a significant shift in the industry, underscoring its progressive evolution. The market caters to the demand for wind resistance, breathable, and moisture-wicking fabrics for athletes participating in various racing sports. Team kits, featuring mesh panels for improved breathability, are a significant market trend. Performance marketing and social media campaigns play a crucial role in customer acquisition.
- The market's growth is driven by the increasing popularity of racing sports, with a focus on improving athlete performance and comfort. Racing apparel manufacturers prioritize research and development to create innovative, high-quality products that meet the evolving needs of racers and fans alike. Retail distribution channels and race regulations influence pocket configuration and testing standards. Shoe covers are essential accessories for racers to enhance grip and protect against the elements.
How does Racing Apparel market face challenges during its growth?
- The intense competition among companies, resulting in price wars, poses a significant challenge to the industry's growth trajectory. The market showcases a high level of competition among various international, regional, and local players. Leading companies prioritize research and development to introduce advanced protective apparel for diverse racing events and demographics. These advanced offerings include performance fabrics with features such as water resistance, padded shorts, and zipper placement for enhanced comfort and functionality. Local and regional companies also participate in this market, offering cost-effective solutions. Their low operational costs are attributed to minimal transportation expenses due to small geographical operations, limited product lines, reduced employee costs, and minimal marketing and promotional expenditures.
- Brand awareness is crucial in the market, and companies employ various marketing strategies, including influencer marketing, digital printing, screen printing, and sublimation printing. These techniques enable companies to cater to the unique requirements of racing enthusiasts while maintaining the durability and quality of the fabrics. Transparency in the supply chain is another essential factor for companies, ensuring ethical sourcing and production processes. By focusing on these aspects, market players aim to cater to the increasing demand for high-performance racing apparel while maintaining a competitive edge.
Exclusive Customer Landscape
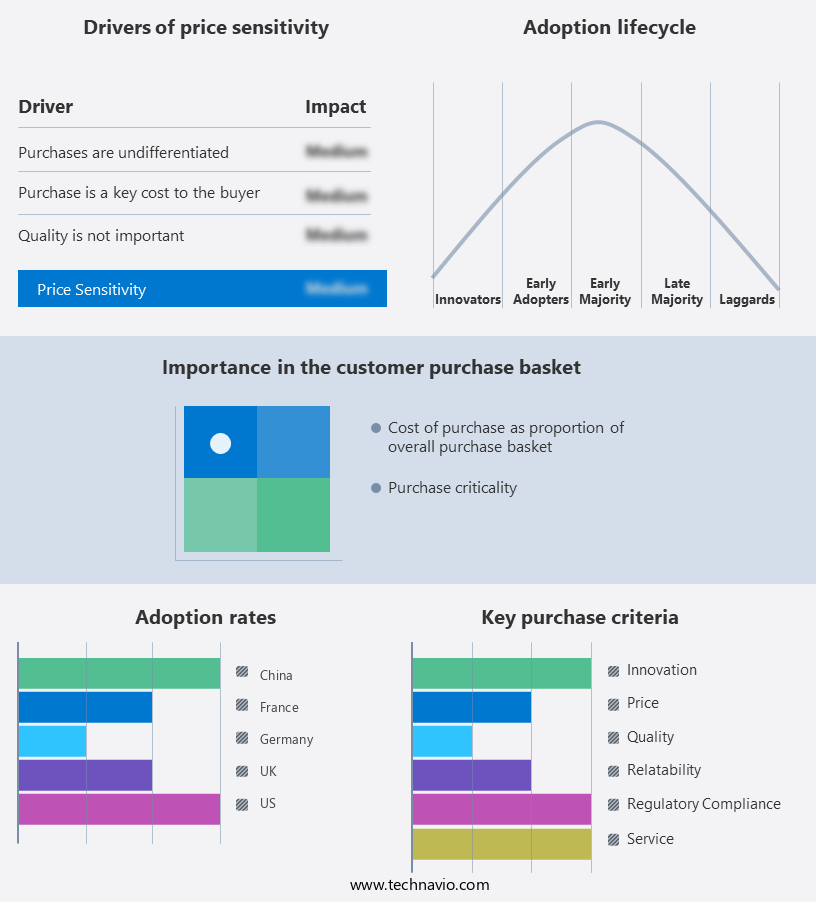
The racing apparel market forecasting report includes the adoption lifecycle of the market, covering from the innovator's stage to the laggard's stage. It focuses on adoption rates in different regions based on penetration. Furthermore, the racing apparel market report also includes key purchase criteria and drivers of price sensitivity to help companies evaluate and develop their market growth analysis strategies.
Customer Landscape
Key Companies & Market Insights
Companies are implementing various strategies, such as strategic alliances, racing apparel market forecast, partnerships, mergers and acquisitions, geographical expansion, and product/service launches, to enhance their presence in the industry.
Adidas AG - This company specializes in the production and distribution of high-performance racing apparel.
The industry research and growth report includes detailed analyses of the competitive landscape of the market and information about key companies, including:
- Adidas AG
- AGV Sports Group Inc.
- Alpinestars USA Inc.
- BMW AG
- Dainese Spa
- Eicher Motors Ltd.
- FOX Head Inc.
- Gerbing Heated Gear LLC
- HJC Helmets
- OMP Racing SPA
- Polaris Inc.
- REVIT Sport International BV
- RYNOX GEARS
- SCOTT Sports SA
- Sidi Sport S.r.l.
- Triumph Motorcycles Ltd.
- TVS Motor Co.
- VF Corp.
- Wolverine World Wide Inc.
- Yamaha Motor Co. Ltd.
Qualitative and quantitative analysis of companies has been conducted to help clients understand the wider business environment as well as the strengths and weaknesses of key industry players. Data is qualitatively analyzed to categorize companies as pure play, category-focused, industry-focused, and diversified; it is quantitatively analyzed to categorize companies as dominant, leading, strong, tentative, and weak.
Recent Development and News in Racing Apparel Market
- In February 2023, Adidas unveiled its new high-performance racing apparel line, "Adidas Running Supernova," featuring advanced materials and technologies to enhance athletes' comfort and speed (Adidas press release).
- In May 2024, Puma and Formula 1 racing team Red Bull Racing announced a multi-year partnership, making Puma the official apparel supplier for the team, expanding its presence in the motorsport industry (Red Bull Racing press release).
- In August 2024, Under Armour raised USD 500 million through a senior secured notes offering, enabling the company to invest further in research and development and expand its product offerings in the market (Under Armour SEC filing).
Research Analyst Overview
The market continues to evolve, driven by advancements in technology and consumer preferences. Wind resistance and breathability are key considerations, with manufacturers integrating mesh panels and moisture-wicking fabrics to enhance performance. Performance marketing and team kits are prominent, with social media platforms and retail distribution channels utilized to expand reach. Race regulations shape product design, influencing pocket configuration, testing standards, and safety features. Brands differentiate through custom designs, body mapping, and value proposition, while ethical sourcing and recycled materials gain traction. Pricing strategies vary, with direct-to-consumer sales and wholesale partnerships shaping the competitive landscape. Aerodynamic design, thermal regulation, and UV protection are essential for cycling jerseys and bike shorts.
Performance enhancement is a priority, with ventilation systems, padded shorts, and base layers catering to diverse athlete needs. Brand awareness is bolstered through content marketing, influencer collaborations, and digital printing techniques. Quality control and fabric composition are crucial, with suppliers adhering to stringent testing standards and fabric weight specifications. The market's continuous dynamism underscores the importance of adaptability and innovation. T-shirts, pants, and jackets are engineered to regulate body temperature, while goggles and helmets ensure adequate vision in various lighting conditions.
Dive into Technavio's robust research methodology, blending expert interviews, extensive data synthesis, and validated models for unparalleled Racing Apparel Market insights. See full methodology.
|
Market Scope |
|
|
Report Coverage |
Details |
|
Page number |
218 |
|
Base year |
2024 |
|
Historic period |
2019-2023 |
|
Forecast period |
2025-2029 |
|
Growth momentum & CAGR |
Accelerate at a CAGR of 5.5% |
|
Market growth 2025-2029 |
USD 1.5 billion |
|
Market structure |
Fragmented |
|
YoY growth 2024-2025(%) |
5.3 |
|
Key countries |
US, China, Germany, UK, Japan, France, Canada, South Korea, Italy, and India |
|
Competitive landscape |
Leading Companies, Market Positioning of Companies, Competitive Strategies, and Industry Risks |
What are the Key Data Covered in this Racing Apparel Market Research and Growth Report?
- CAGR of the Racing Apparel industry during the forecast period
- Detailed information on factors that will drive the growth and forecasting between 2025 and 2029
- Precise estimation of the size of the market and its contribution of the industry in focus to the parent market
- Accurate predictions about upcoming growth and trends and changes in consumer behaviour
- Growth of the market across Europe, North America, APAC, Middle East and Africa, and South America
- Thorough analysis of the market's competitive landscape and detailed information about companies
- Comprehensive analysis of factors that will challenge the racing apparel market growth of industry companies
We can help! Our analysts can customize this racing apparel market research report to meet your requirements.
 RIA -
RIA - 
