Solvents Market Size 2024-2028
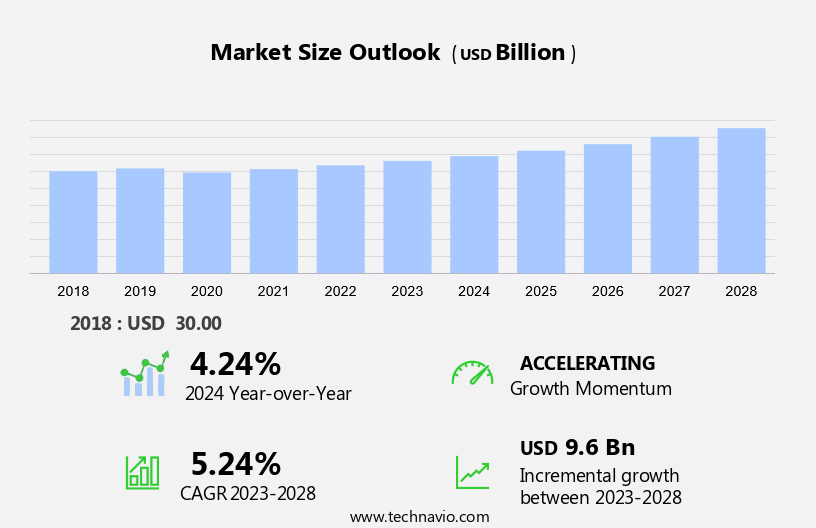
The solvents market size is forecast to increase by USD 9.6 billion at a CAGR of 5.24% between 2023 and 2028. The market in the beauty industry is experiencing significant growth, driven by technological advancements in the recovery and recycling processes of solvents. These innovations enable the efficient use of solvents, reducing waste and lowering production costs. Additionally, the adoption of IoT technology in oil and gas extraction processes is increasing the demand for solvents, particularly ketones, ester solvents, glycol ether esters, alcohols such as methanol and ethanol. However, the market is also facing challenges due to the fluctuation in crude oil prices, which can impact the cost of raw materials and, consequently, the price of finished solvent products. To remain competitive, market players are focusing on improving production efficiency and reducing costs through process optimization and the adoption of sustainable manufacturing practices.
What will the size of the market be during the forecast period?
The market encompasses a wide range of chemicals used as carriers for various applications. These include paints, coatings, adhesives, nail polish removers, printing inks, varnishes, fragrances, detergent, and spot removers, among others. The market is significantly influenced by the petrochemical output and the demand from industries such as Construction, Shipbuilding, and Aircraft manufacturing. Paints and coatings are major consumers of solvents, with Carbon tetrachloride and Methyl chloride being commonly used. However, due to environmental concerns, there is a shift towards the use of less harmful solvents such as alcohols, hydrocarbons, ketones, and Perchloroethylene (PERC). The personal care industry also contributes significantly to the market, with alcohols, ethanol, and Methyl isobutyl ketone being commonly used in cosmetics and nail polish removers. The market is subject to regulations such as the Solvents Emission Directive, which aims to reduce the environmental impact of solvent usage. In addition to these industries, the market also caters to the needs of various end-users such as the printing industry, where acetone is commonly used as a solvent for printing inks. Overall, the market is expected to grow due to the increasing demand for various end-use applications and the ongoing shift towards the use of less harmful solvents.
Market Segmentation
The market research report provides comprehensive data (region-wise segment analysis), with forecasts and estimates in "USD billion" for the period 2024-2028, as well as historical data from 2018-2022 for the following segments.
- Type
- Alcohols
- Hydrocarbons
- Ketones
- Esters
- Others
- End-user
- Paints and Coatings
- Pharmaceuticals
- Adhesives
- Printing Inks
- Others
- Geography
- APAC
- China
- India
- Japan
- North America
- US
- Europe
- Germany
- UK
- South America
- Middle East and Africa
- APAC
By Type Insights
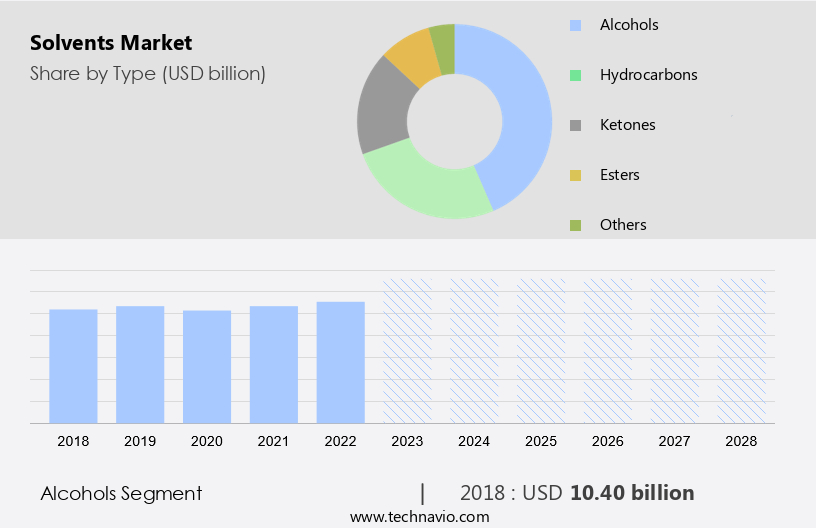
The alcohols segment is estimated to witness significant growth during the forecast period. Alcohol solvents, such as n-butanol and isopropanol, hold significant importance in various industries due to their versatile applications. In surface coatings, they serve as crucial intermediates, enhancing the quality and durability of coatings used on glass and metals. The demand for these solvents is driven by the increasing use of advanced coatings in the automotive, aerospace, and construction industries. Moreover, in the chemical industry, alcohol solvents are extensively used as intermediates in the production of plastics and composites. Their ability to dissolve a wide range of polymers makes them indispensable in this sector. In pharmaceuticals, these solvents are utilized for drug formulation, extraction, and purification processes, underlining their significance in the healthcare sector.
In the cosmetics and personal care industry, alcohol solvents are employed for their excellent solubility and efficacy in formulations. They help in extracting fragrances and flavors, contributing to the production of high-quality consumer products. Furthermore, in the electronics industry, these solvents are utilized for cleaning and maintaining electronic components and devices, ensuring optimal performance and reliability. Overall, the demand for high-quality alcohol solvents continues to grow, driven by their extensive applications across various industries.
Get a glance at the market share of various segments Request Free Sample
The alcohols segment accounted for USD 10.40 billion in 2018 and showed a gradual increase during the forecast period.
Regional Insights
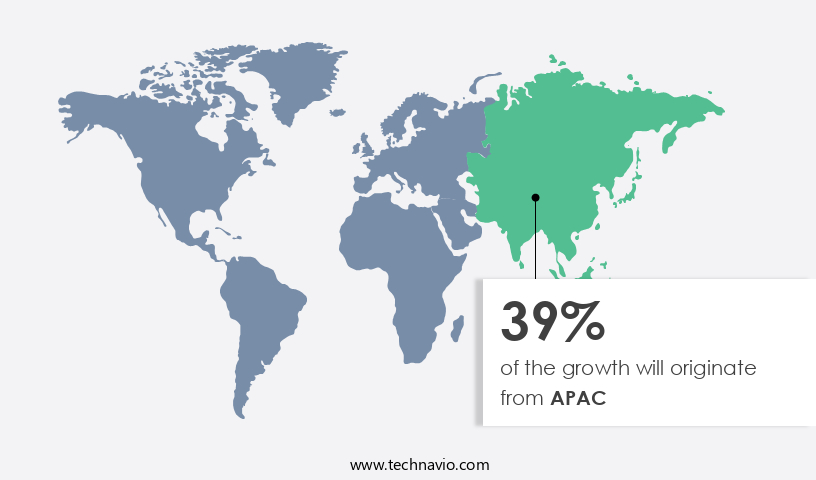
APAC is estimated to contribute 39% to the growth of the global market during the forecast period. Technavio's analysts have elaborately explained the regional trends and drivers that shape the market during the forecast period.
For more insights on the market share of various regions Request Free Sample
In various industries across Asia Pacific (APAC), there is a notable expansion, with sectors such as manufacturing, automotive, and electronics driving this growth. This industrial advancement leads to an increased demand for solvents, which are essential in processes like cleaning, degreasing, and chemical synthesis. The region's rapid urbanization and infrastructure development further fuel the need for solvents, particularly in industries like construction, paints and coatings, and printing inks. In the automotive sector, APAC is witnessing a boom, resulting in heightened demand for solvents used in paint formulations, cleaning, and maintenance. Moreover, the burgeoning pharmaceutical and personal care industries in APAC utilize solvents for drug formulation, extraction, and as ingredients in their products, contributing significantly to the regional market growth.
Solvents play a crucial role in various applications, from paints and coatings to adhesives, printing inks, varnishes, and nail polish removers. In the paints and coatings industry, solvents are integral to the production process, ensuring the desired consistency and performance. Similarly, in the adhesives sector, solvents help in the solubilization of resins and polymers, enhancing their bonding capabilities. In the printing inks industry, solvents act as carriers, enabling the even distribution of pigments and dyes. Varnishes and nail polish removers also rely on solvents for their application and removal properties. The APAC region's growing industrial sector, coupled with the expanding construction, automotive, pharmaceutical, and personal care industries, presents a substantial opportunity for solvent manufacturers.
As the demand for solvents continues to rise, market players are focusing on innovations to cater to the evolving needs of their customers. By offering eco-friendly and high-performance solvents, these companies aim to meet the growing demand while addressing environmental concerns. In conclusion, the APAC region's industrial growth and expanding industries like manufacturing, automotive, electronics, construction, and pharmaceuticals and personal care are fueling the demand for solvents. These solvents are indispensable in various applications, including paints and coatings, adhesives, printing inks, varnishes, and nail polish removers. Market players are focusing on innovation to cater to the evolving needs of their customers, offering eco-friendly and high-performance solvents to meet the growing demand while addressing environmental concerns.
Our researchers analyzed the data with 2023 as the base year, along with the key drivers, trends, and challenges. A holistic analysis of drivers will help companies refine their marketing strategies to gain a competitive advantage.
Market Driver
Technological advancements in recovery and recycling processes of solvents is notably driving market growth. Solvents are essential components in various industries, including paints, coatings, adhesives, and sealants. They are used as carriers for pigments, resins, and other additives in paints and coatings. In addition, they are integral to the formulation of printing inks, varnishes, and nail polish removers.
Moreover, solvents find extensive applications in the fragrance industry, detergents, and spot removers. Pharmaceuticals, vehicles, and pesticide formulations also rely on solvents for their production. Eco-friendly and organic solvents have gained popularity in recent years, leading to the increasing use of solvents derived from renewable sources. Thus, such factors are driving the growth of the market during the forecast period.
Market Trends
Adoption of IoT technology for oil and gas extraction is the key trend in the market. Solvents are essential components in various industries, including paints, coatings, adhesives, nail polish removers, printing inks, varnishes, fragrances, detergents, spot removers, pharmaceuticals, vehicles, pesticide formulations, and chemical production processes.
Moreover, ketones, ester solvents, glycol ether esters, alcohols such as methanol, ethanol, n-butanol, and isopropanol are commonly used solvents. They play a vital role in surface coatings, chemical intermediates, composites, glass, metals, plastic, construction, shipbuilding, aircraft manufacturing, and the beauty industry. Eco-friendly and organic goods have gained popularity, leading some biotechnology firms to explore solvent alternatives. Thus, such trends will shape the growth of the market during the forecast period.
Market Challenge
Fluctuation in crude oil price is the major challenge that affects the growth of the market. Solvents are essential components in various industries, including paints, coatings, adhesives, nail polish removers, printing inks, varnishes, fragrances, detergents, and spot removers. They play a crucial role in chemical production processes, serving as carriers for active ingredients and facilitating their application.
Moreover, in the pharmaceutical sector, solvents are used in formulating drugs and extracting compounds. In the transportation industry, they are utilized in deicers, cooling circuits, and dry cleaning. Ketones, ester solvents, glycol ether esters, alcohols such as methanol, ethanol, n-butanol, and isopropanol, are commonly used solvents. Hence, the above factors will impede the growth of the market during the forecast period.
Exclusive Customer Landscape
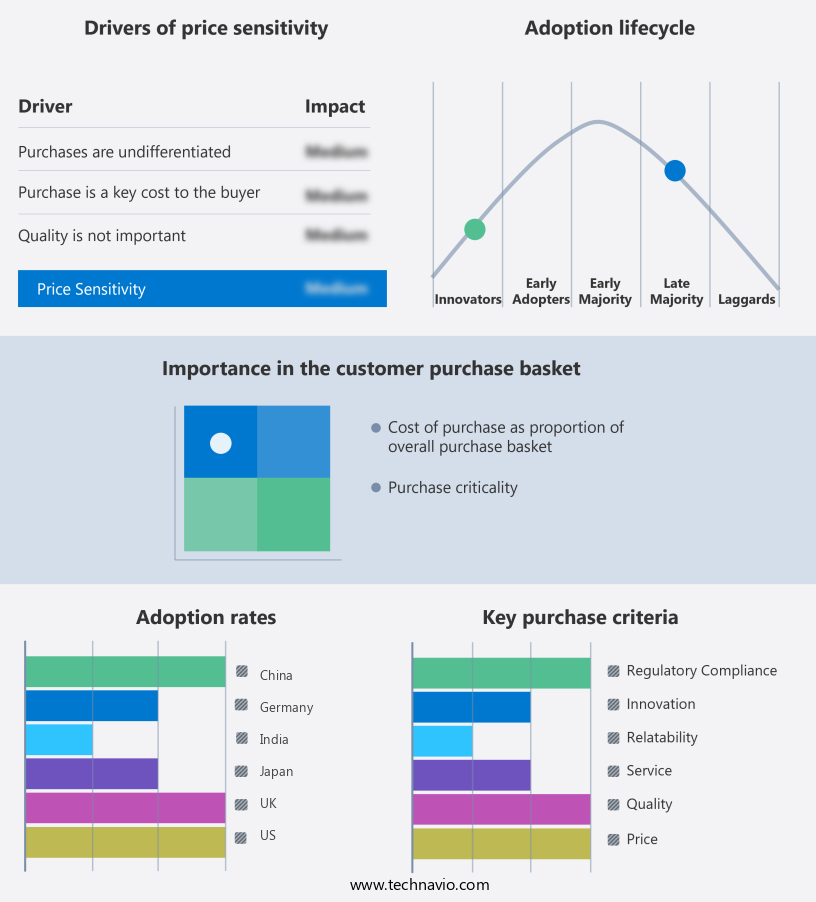
The market forecasting report includes the adoption lifecycle of the market, covering from the innovator's stage to the laggard's stage. It focuses on adoption rates in different regions based on penetration. Furthermore, the report also includes key purchase criteria and drivers of price sensitivity to help companies evaluate and develop their market growth analysis strategies.
Customer Landscape
Key Companies & Market Insights
Companies are implementing various strategies, such as strategic alliances, partnerships, mergers and acquisitions, geographical expansion, and product/service launches, to enhance their presence in the market.
Akzo Nobel NV: The company offers solvents such as Solvent Cleaning C 28 15, a cleaning solvent for metal degreasing, removal of paint remover residues, and final cleaning prior to paint application.
The market research and growth report includes detailed analyses of the competitive landscape of the market and information about key companies, including:
- BASF SE
- Chevron Phillips Chemical Co. LLC
- Clariant AG
- Dow Inc.
- Eastman Chemical Co.
- Exxon Mobil Corp.
- Huntsman Corp.
- INEOS Group
- LG Chem Ltd.
- LyondellBasell Industries N.V.
- Merck KGaA
- Mitsui and Co. Ltd.
- PPG Industries Inc.
- Saudi Basic Industries Corp.
- Shell plc
- Solvay SA
- SolvChem Inc.
- Stepan Co.
- Vertec Biosolvents Inc.
Qualitative and quantitative analysis of companies has been conducted to help clients understand the wider business environment as well as the strengths and weaknesses of key market players. Data is qualitatively analyzed to categorize companies as pure play, category-focused, industry-focused, and diversified; it is quantitatively analyzed to categorize companies as dominant, leading, strong, tentative, and weak.
Research Analyst Overview
The market is witnessing significant growth due to the increasing demand from various industries such as paints and coatings, printing inks, adhesives, and cosmetics. Solvents are essential components used in the production of these products, and their demand is driven by the growing construction, shipbuilding, aircraft manufacturing, and automotive industries. Solvents find extensive applications in surface coatings, chemical intermediates, composites, glass, metals, plastics, and pharmaceuticals. The market is segmented into hydrocarbon solvents, esters, ketones, alcohols, glycol ether esters, and halogenated solvents. Esters, including methyl acetate, ethyl acetate, and butyl acetate, are widely used as solvents in various applications due to their excellent solvency properties.
Further, ketones, such as methanol, ethanol, isopropanol, and n-butanol, are used as solvents and chemical intermediates in various industries. Glycol ether esters and alcohols are used in the production of eco-friendly and organic goods, including detergents, skin care products, and fragrances. The demand for these solvents is increasing due to the growing awareness of environmental concerns and the shift towards sustainable products. The market is also witnessing significant growth in the pharmaceutical industry due to the increasing demand for solvents as chemical intermediates and in the production of pesticide formulations. The market is expected to continue its growth trajectory in the coming years due to the increasing demand from various end-use industries and the development of new applications.
|
Market Scope |
|
|
Report Coverage |
Details |
|
Page number |
222 |
|
Base year |
2023 |
|
Historic period |
2018-2022 |
|
Forecast period |
2024-2028 |
|
Growth momentum & CAGR |
Accelerate at a CAGR of 5.24% |
|
Market growth 2024-2028 |
USD 9.6 billion |
|
Market structure |
Fragmented |
|
YoY growth 2023-2024(%) |
4.24 |
|
Regional analysis |
APAC, North America, Europe, South America, and Middle East and Africa |
|
Performing market contribution |
APAC at 39% |
|
Key countries |
China, US, Germany, India, UK, and Japan |
|
Competitive landscape |
Leading Companies, Market Positioning of Companies, Competitive Strategies, and Industry Risks |
|
Key companies profiled |
Akzo Nobel NV, BASF SE, Chevron Phillips Chemical Co. LLC, Clariant AG, Dow Inc., Eastman Chemical Co., Exxon Mobil Corp., Huntsman Corp., INEOS Group, LG Chem Ltd., LyondellBasell Industries N.V., Merck KGaA, Mitsui and Co. Ltd., PPG Industries Inc., Saudi Basic Industries Corp., Shell plc, Solvay SA, SolvChem Inc., Stepan Co., and Vertec Biosolvents Inc. |
|
Market dynamics |
Parent market analysis, market growth inducers and obstacles, market forecast, fast-growing and slow-growing segment analysis, COVID-19 impact and recovery analysis and future consumer dynamics, market condition analysis for the forecast period |
|
Customization purview |
If our market report has not included the data that you are looking for, you can reach out to our analysts and get segments customized. |
What are the Key Data Covered in this Market Research and Growth Report?
- CAGR of the market during the forecast period
- Detailed information on factors that will drive the market growth and forecasting between 2024 and 2028
- Precise estimation of the size of the market and its contribution of the market in focus to the parent market
- Accurate predictions about upcoming market growth and trends and changes in consumer behaviour
- Growth of the market across APAC, North America, Europe, South America, and Middle East and Africa
- Thorough analysis of the market's competitive landscape and detailed information about companies
- Comprehensive analysis of factors that will challenge the growth of market companies
We can help! Our analysts can customize this market research report to meet your requirements. Get in touch
 RIA -
RIA - 
