
Space Habitat Market Size 2026-2030
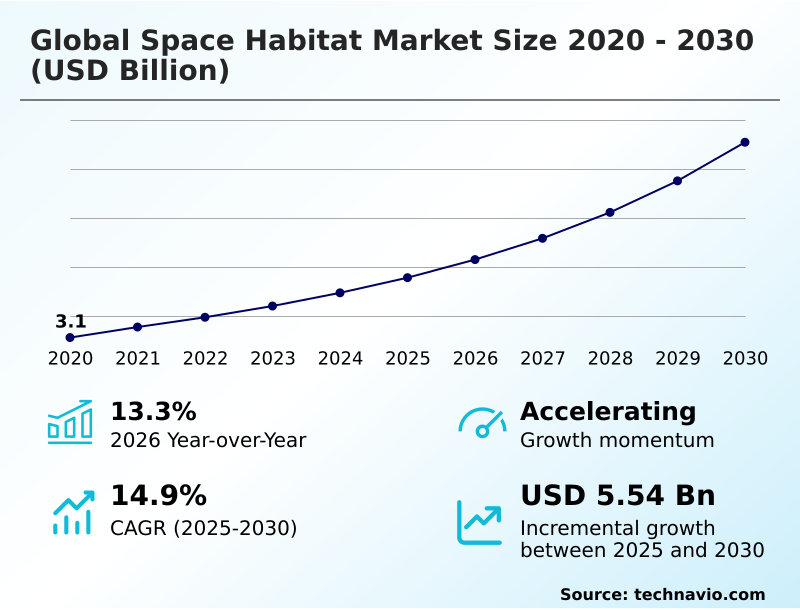
The space habitat market size is valued to increase by USD 5.54 billion, at a CAGR of 14.9% from 2025 to 2030. Transition toward commercial low earth orbit destinations and international space station retirement will drive the space habitat market.
Major Market Trends & Insights
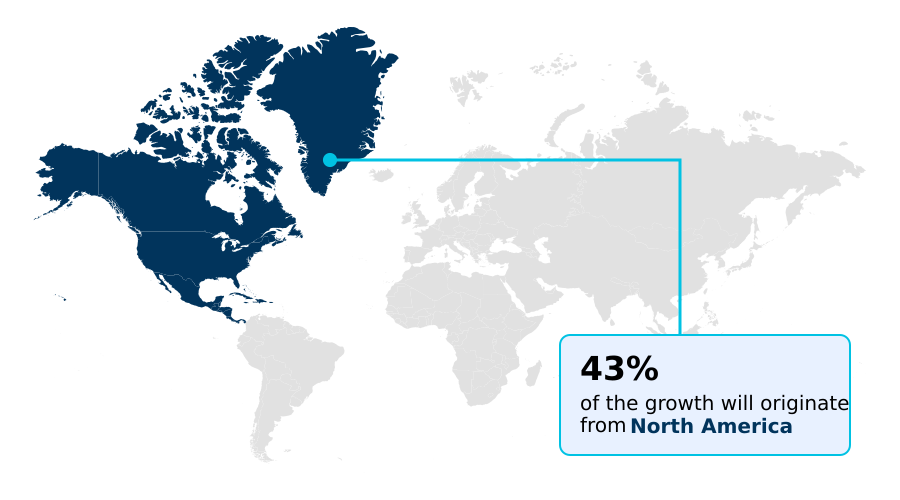
- North America dominated the market and accounted for a 42.6% growth during the forecast period.
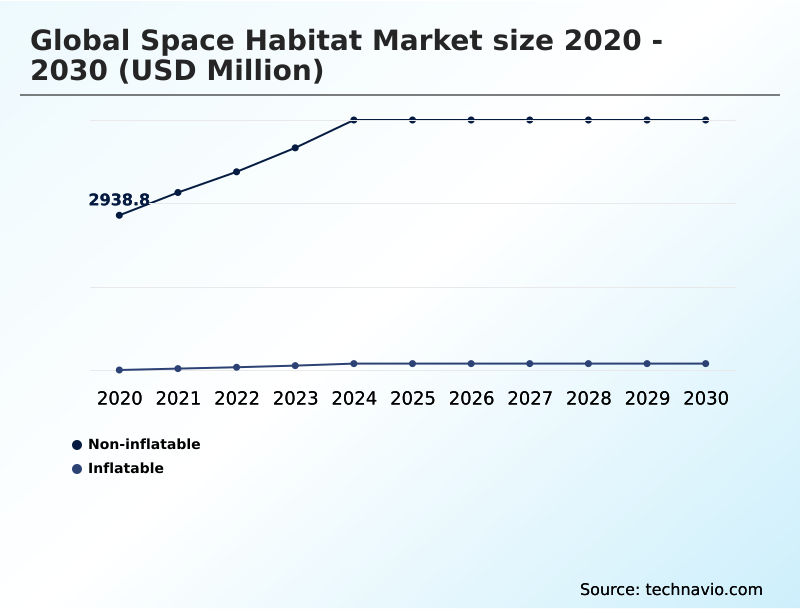
- By Service - Non-inflatable segment was valued at USD 4.65 billion in 2024
- By End-user - Government segment accounted for the largest market revenue share in 2024
Market Size & Forecast
- Market Opportunities: USD 7.99 billion
- Market Future Opportunities: USD 5.54 billion
- CAGR from 2025 to 2030 : 14.9%
Market Summary
- The Space Habitat Market is undergoing a pivotal transformation, moving from government-led exploration to a burgeoning commercial ecosystem. This shift is catalyzed by the impending retirement of cornerstone orbital assets, creating a pressing need for privately operated platforms.
- Key developments focus on creating modular, scalable environments capable of supporting a diverse range of activities, including advanced materials science, pharmaceutical research, and high-end tourism. Inflatable and expandable structures are gaining prominence, offering greater volume-to-mass ratios, which is crucial for reducing launch costs.
- Concurrently, the industry is tackling significant hurdles, such as developing fully regenerative life support systems and providing adequate radiation shielding for missions beyond Earth's protective magnetosphere. For instance, a private consortium planning an orbital manufacturing facility must balance the high initial capital investment against the potential long-term revenue from producing flawless fiber optics in microgravity.
- The successful integration of artificial intelligence for autonomous station management and predictive maintenance is becoming a key differentiator, ensuring the operational longevity and economic viability of these new orbital outposts.
What will be the Size of the Space Habitat Market during the forecast period?
Get Key Insights on Market Forecast (PDF) Get Free Sample
How is the Space Habitat Market Segmented?
The space habitat industry research report provides comprehensive data (region-wise segment analysis), with forecasts and estimates in "USD million" for the period 2026-2030, as well as historical data from 2020-2024 for the following segments.
- Service
- Non-inflatable
- Inflatable
- End-user
- Government
- Private
- Type
- Scientific research
- Long-term space missions
- Manufacturing and production
- Space tourism
- Sector
- Chemical propulsion
- Electric propulsion
- Others
- Geography
- North America
- US
- Canada
- Mexico
- Europe
- Germany
- UK
- France
- APAC
- China
- Japan
- India
- South America
- Brazil
- Argentina
- Middle East and Africa
- Saudi Arabia
- UAE
- South Africa
- Rest of World (ROW)
- North America
By Service Insights
The non-inflatable segment is estimated to witness significant growth during the forecast period.
The non-inflatable segment remains foundational to orbital infrastructure, where rigid metallic modules are prized for proven reliability. These habitats, manufactured from high-strength alloys, are launched with pre-integrated subsystems, facilitating immediate human-rated astronaut operations.
This design methodology is critical for missions requiring robust micrometeoroid protection and predictable thermal management. While advancements in inflatable structural integrity are noteworthy, the demand for rigid structures for lunar surface outposts and deep-space transit modules persists.
These platforms serve as crucial orbital real estate, where autonomous assembly technologies can be leveraged for expansion.
The focus on hardened structures provides up to 25% better shielding against specific high-energy cosmic radiation, a key performance indicator for long-duration missions beyond low Earth orbit.
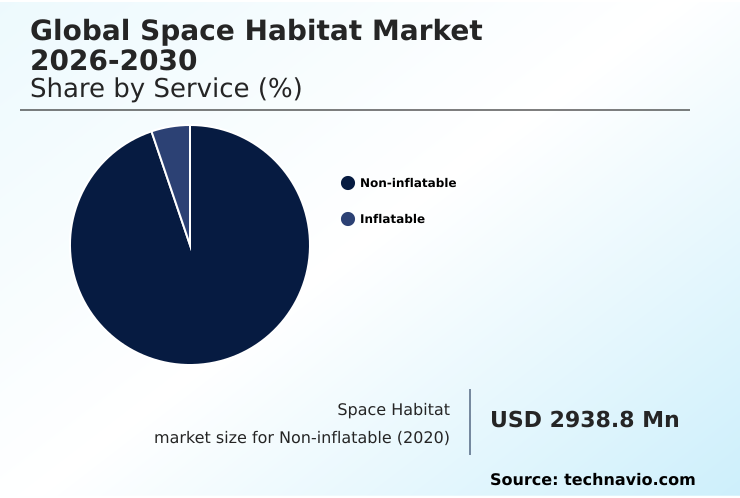
The Non-inflatable segment was valued at USD 4.65 billion in 2024 and showed a gradual increase during the forecast period.
Regional Analysis
North America is estimated to contribute 42.6% to the growth of the global market during the forecast period.Technavio’s analysts have elaborately explained the regional trends and drivers that shape the market during the forecast period.
See How Space Habitat Market Demand is Rising in North America Get Free Sample
The geographic landscape of the space habitat market is diversifying, though North America continues to lead, accounting for 42.6% of the market's incremental growth, driven by robust private and public investment in expandable space station modules and orbital transportation systems.
Europe remains a critical partner in collaboration, focusing on specialized hardware like regenerative life support systems for interplanetary transit vehicles.
Meanwhile, the APAC region is rapidly emerging as a primary hub for sovereign space initiatives, with nations investing heavily in independent orbital capabilities.
Activity is also increasing in other regions, with a focus on terrestrial analog missions to address psychological health considerations and test bioregenerative life support systems.
This global expansion is creating new opportunities for providers of suborbital spaceflight services and technologies related to orbital station-keeping.
Market Dynamics
Our researchers analyzed the data with 2025 as the base year, along with the key drivers, trends, and challenges. A holistic analysis of drivers will help companies refine their marketing strategies to gain a competitive advantage.
- The strategic planning for the Global Space Habitat Market 2026-2030 is increasingly dominated by long-term economic considerations, moving beyond pure technical feasibility. The analysis of the cost per cubic meter of usable space has become a primary metric, compelling a deeper look into softgoods engineering for expandable structures versus traditional rigid designs.
- For long-duration deep space mission habitability, the focus shifts to the environmental control and life support system reliability and the effectiveness of radiation shielding in deep space. Business models prioritizing in-space manufacturing business case viability over tourism show a 30% higher projected long-term return on investment due to lower operational churn.
- This influences decisions on modular architecture for commercial orbital destinations, where flexibility is key. Furthermore, the high capital intensity of commercial space operations necessitates a clear strategy for achieving economic sustainability, which is often challenged by geopolitical impact on orbital governance and regulatory uncertainty in low Earth orbit.
- The integration of AI for predictive maintenance in space habitats and robotics integration for habitat assembly are seen as essential for managing these risks and ensuring the viability of private space stations.
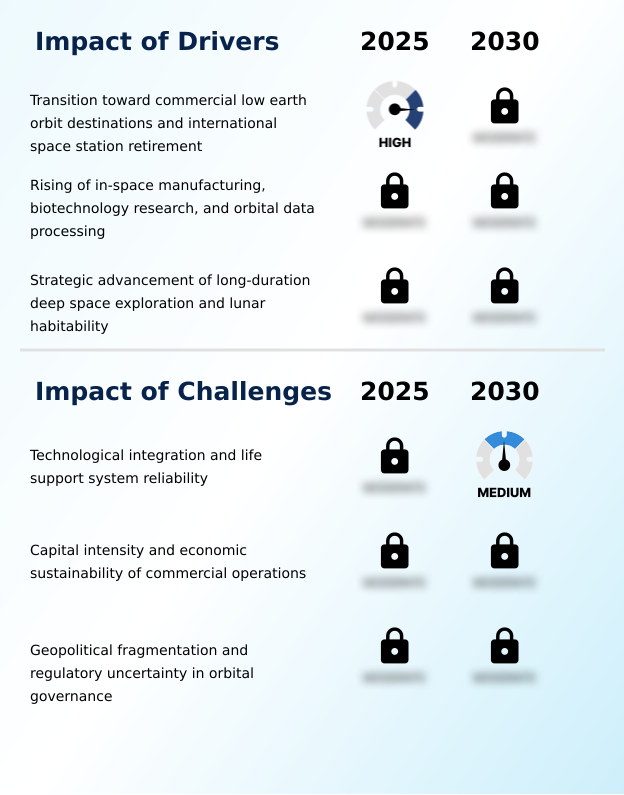
What are the key market drivers leading to the rise in the adoption of Space Habitat Industry?
- Market expansion is primarily driven by the planned retirement of the International Space Station, which is accelerating the transition toward commercial low-Earth-orbit destinations.
- Market growth is propelled by the strategic pivot to commercial low Earth orbit destinations (CLDs) as government agencies transition into roles as anchor tenants.
- This shift is unlocking new opportunities for in-space manufacturing and microgravity research facilities, with private investment now outpacing public funding by a 2-to-1 ratio.
- The promise of producing unique materials and pharmaceuticals in orbit is a powerful lure for non-aerospace industries, fostering a robust commercial space economy.
- Furthermore, ambitious long-duration deep space exploration goals, including lunar gateway modules and missions to Mars, are driving innovation in habitat technology.
- These drivers are supported by the development of orbital data centers, enabling real-time processing and analysis for sovereign astronaut programs and commercial clients, reducing data latency by more than 50%.
What are the market trends shaping the Space Habitat Industry?
- The market is defined by a strategic transition toward modular commercial orbital destinations. This evolution includes the development of multi-functional, mixed-use business parks in orbit.
- Key trends are reshaping the development of orbital infrastructure, with a strong emphasis on modular habitat architecture and the creation of versatile orbital business parks. This shift away from monolithic structures is enabled by advancements in inflatable habitat technology, where softgoods engineering is delivering larger living spaces with lower launch mass, reducing deployment costs by up to 35%.
- Concurrently, autonomous habitat management, powered by predictive maintenance algorithms and robotic maintenance systems, is becoming standard. These AI-driven systems improve fault detection accuracy by over 90%, ensuring the long-term viability of commercial orbital platforms and allowing for uncrewed operational periods. The adoption of standardized docking adapters further enhances this modular approach, facilitating seamless integration and future expansion.
What challenges does the Space Habitat Industry face during its growth?
- A primary challenge affecting industry growth is ensuring the seamless technological integration and absolute reliability of complex, long-duration life support systems.
- The market faces significant technical and economic challenges that temper its growth trajectory. The primary hurdle remains the development of a fully closed-loop life support system with a demonstrated reliability of over 99.9% for multi-year missions, a goal that requires unprecedented engineering and integration.
- Furthermore, ensuring human-rated astronaut operations involves complex structural health monitoring and robust micrometeoroid protection, where development costs can exceed initial budgets by up to 35% due to stringent testing protocols. The high pressurized volume efficiency of new designs is often offset by the technical challenge of integrating effective radiation shielding technology.
- On a macro level, geopolitical fragmentation in space creates regulatory uncertainty, complicating efforts to establish a unified operational framework and secure sovereign control over data across international partnerships.
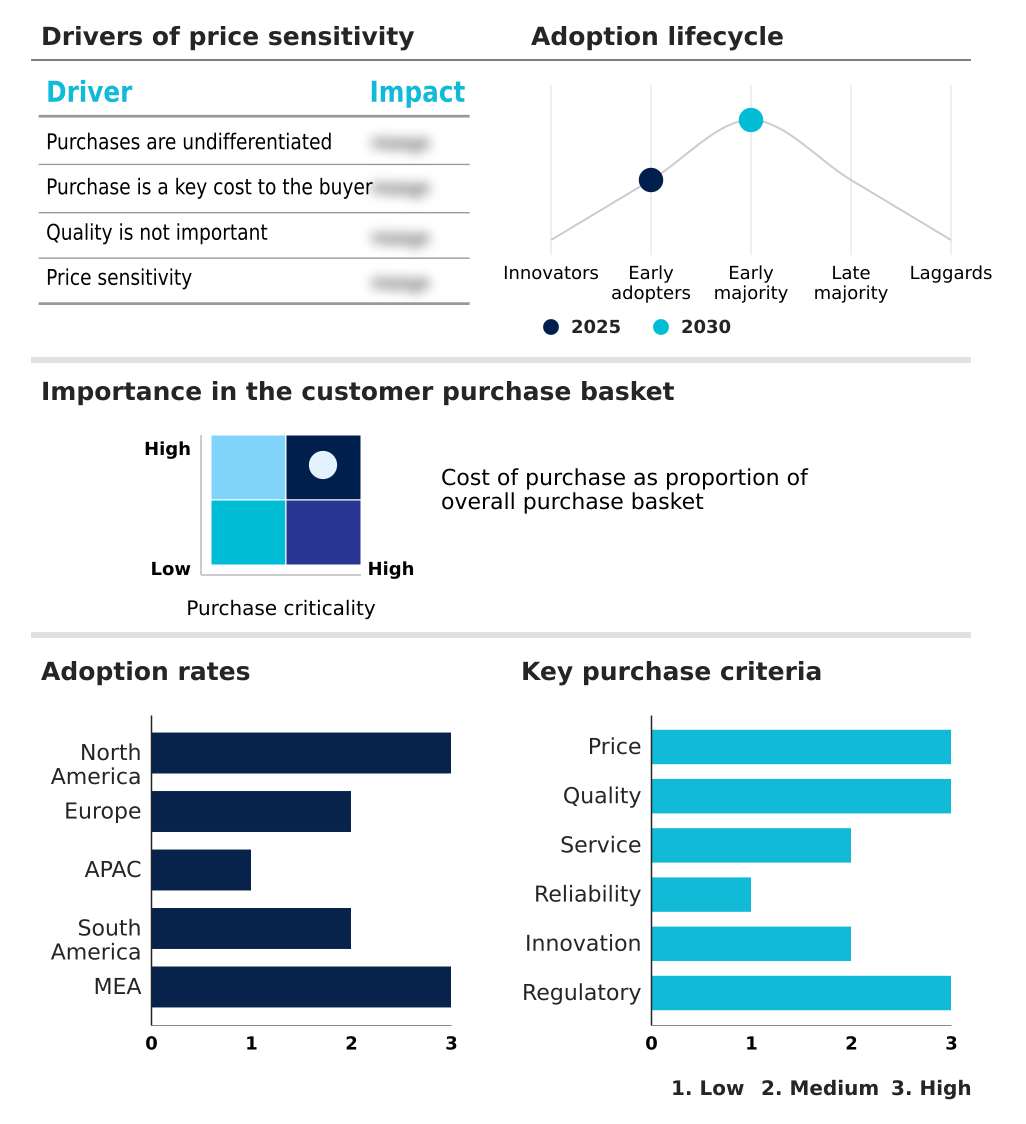
Exclusive Technavio Analysis on Customer Landscape
The space habitat market forecasting report includes the adoption lifecycle of the market, covering from the innovator’s stage to the laggard’s stage. It focuses on adoption rates in different regions based on penetration. Furthermore, the space habitat market report also includes key purchase criteria and drivers of price sensitivity to help companies evaluate and develop their market growth analysis strategies.
Customer Landscape of Space Habitat Industry
Competitive Landscape
Companies are implementing various strategies, such as strategic alliances, space habitat market forecast, partnerships, mergers and acquisitions, geographical expansion, and product/service launches, to enhance their presence in the industry.
Airbus SE - Delivering advanced orbital infrastructure and space station technologies for next-generation extraterrestrial habitation, research, and commercial applications.
The industry research and growth report includes detailed analyses of the competitive landscape of the market and information about key companies, including:
- Airbus SE
- Astroscale Holdings Inc
- Axiom Space Inc.
- Bigelow Aerospace LLC
- Blue Origin Enterprises LP
- Lockheed Martin Corp.
- Mitsubishi Heavy Industries
- Nanoracks LLC
- Northrop Grumman Corp.
- OHB SE
- Orbital Assembly Corp.
- Redwire Corp.
- Relativity Space Inc.
- Rocket Lab USA Inc.
- Sierra Space Corp.
- Space Exploration Tech. Corp.
- Starlab Space LLC
- Thales Alenia Space
- The Boeing Co.
- Virgin Galactic Holdings Inc.
Qualitative and quantitative analysis of companies has been conducted to help clients understand the wider business environment as well as the strengths and weaknesses of key industry players. Data is qualitatively analyzed to categorize companies as pure play, category-focused, industry-focused, and diversified; it is quantitatively analyzed to categorize companies as dominant, leading, strong, tentative, and weak.
Recent Development and News in Space habitat market
- In March 2025, Starlab Space LLC announced the successful completion of its Preliminary Design Review in collaboration with NASA, advancing its commercial space station into the full-scale production phase.
- In February 2025, Sierra Space Corp. reported the successful completion of a full-scale, high-fidelity pressure test for its LIFE inflatable habitat, demonstrating structural integrity for the future Orbital Reef station.
- In November 2024, Axiom Space Inc. secured a significant round of private funding aimed at accelerating the final assembly and integration of its first commercial habitat module, scheduled for launch to the ISS.
- In April 2025, Blue Origin Enterprises LP formed a strategic partnership with a leading European life support systems provider to finalize the environmental control architecture for the Orbital Reef commercial space station.
Dive into Technavio’s robust research methodology, blending expert interviews, extensive data synthesis, and validated models for unparalleled Space Habitat Market insights. See full methodology.
| Market Scope | |
|---|---|
| Page number | 317 |
| Base year | 2025 |
| Historic period | 2020-2024 |
| Forecast period | 2026-2030 |
| Growth momentum & CAGR | Accelerate at a CAGR of 14.9% |
| Market growth 2026-2030 | USD 5543.9 million |
| Market structure | Fragmented |
| YoY growth 2025-2026(%) | 13.3% |
| Key countries | US, Canada, Mexico, Germany, UK, France, Italy, Spain, The Netherlands, China, Japan, India, South Korea, Australia, Indonesia, Brazil, Argentina, Chile, Saudi Arabia, UAE, South Africa, Israel and Turkey |
| Competitive landscape | Leading Companies, Market Positioning of Companies, Competitive Strategies, and Industry Risks |
Research Analyst Overview
- The Space Habitat Market is pivoting toward commercialization, driven by the need for successors to legacy government-funded platforms. This transition mandates a focus on economic viability, pushing companies to perfect technologies like regenerative life support systems and in-situ resource utilization (ISRU) to reduce long-term operational costs.
- Boardroom-level strategy now revolves around building a defensible business case for orbital business parks and microgravity research facilities. Success is no longer measured by launch capability alone but by the efficiency of modular habitat architecture and the ability to support sovereign astronaut programs.
- For example, next-generation Environmental Control and Life Support Systems (ECLSS) are achieving over 98% water reclamation rates, a key performance metric for mission viability and a crucial factor in securing long-term contracts.
- The development of deep-space transit modules and lunar surface outposts relies on these foundational advancements, with autonomous assembly technologies and expandable space station modules shaping the next wave of infrastructure.
What are the Key Data Covered in this Space Habitat Market Research and Growth Report?
-
What is the expected growth of the Space Habitat Market between 2026 and 2030?
-
USD 5.54 billion, at a CAGR of 14.9%
-
-
What segmentation does the market report cover?
-
The report is segmented by Service (Non-inflatable, and Inflatable), End-user (Government, and Private), Type (Scientific research, Long-term space missions, Manufacturing and production, and Space tourism), Sector (Chemical propulsion, Electric propulsion, and Others) and Geography (North America, Europe, APAC, South America, Middle East and Africa)
-
-
Which regions are analyzed in the report?
-
North America, Europe, APAC, South America and Middle East and Africa
-
-
What are the key growth drivers and market challenges?
-
Transition toward commercial low earth orbit destinations and international space station retirement, Technological integration and life support system reliability
-
-
Who are the major players in the Space Habitat Market?
-
Airbus SE, Astroscale Holdings Inc, Axiom Space Inc., Bigelow Aerospace LLC, Blue Origin Enterprises LP, Lockheed Martin Corp., Mitsubishi Heavy Industries, Nanoracks LLC, Northrop Grumman Corp., OHB SE, Orbital Assembly Corp., Redwire Corp., Relativity Space Inc., Rocket Lab USA Inc., Sierra Space Corp., Space Exploration Tech. Corp., Starlab Space LLC, Thales Alenia Space, The Boeing Co. and Virgin Galactic Holdings Inc.
-
Market Research Insights
- The market's dynamics are increasingly shaped by the push for operational efficiency and economic sustainability in the commercial space economy. The adoption of standardized docking adapters has reduced integration costs for new modules by an estimated 20%, fostering a more flexible orbital logistics framework.
- Furthermore, the implementation of predictive maintenance algorithms in environmental control systems has enhanced reliability, identifying potential failures with 75% greater accuracy than legacy monitoring. This shift enables the development of sophisticated commercial orbital platforms and orbital data centers.
- Companies are leveraging human-machine interfaces that allow for more intuitive control over complex systems, which is critical for the success of both professional and private astronaut missions. As competition intensifies, the ability to provide a secure environment with sovereign control over data is becoming a key value proposition for attracting government and corporate clients to these advanced orbital destinations.
We can help! Our analysts can customize this space habitat market research report to meet your requirements.
 RIA -
RIA - 
