Wireless Access Point Market Analysis, Size, and Forecast 2026-2030: North America (US, Canada, and Mexico), APAC (China, India, and Japan), Europe (Germany, UK, and France), South America (Brazil and Argentina), Middle East and Africa (Saudi Arabia, UAE, and South Africa), and Rest of World (ROW)

Wireless Access Point Market Analysis, Size, and Forecast 2026-2030:
North America (US, Canada, and Mexico), APAC (China, India, and Japan), Europe (Germany, UK, and France), South America (Brazil and Argentina), Middle East and Africa (Saudi Arabia, UAE, and South Africa), and Rest of World (ROW)

Published: Mar 2026 299 Pages SKU: IRTNTR74898

Market Overview at a Glance

$8.72 B
Market Opportunity
6.1%
CAGR 2025 - 2030
38%
North America Growth
$12.51 B
Enterprises segment 2024

Wireless Access Point Market Size 2026-2030

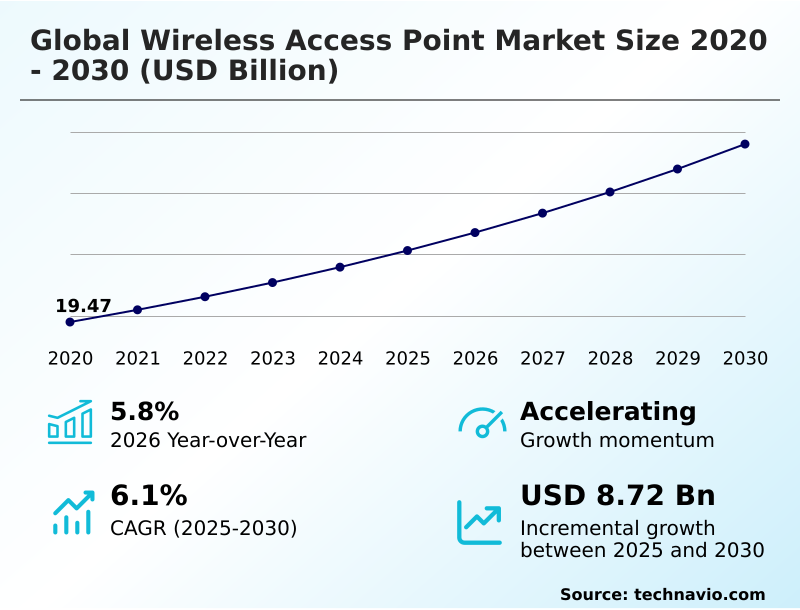
The wireless access point market size is valued to increase by USD 8.72 billion, at a CAGR of 6.1% from 2025 to 2030. Exponential growth of connected devices and high density environments will drive the wireless access point market.

Major Market Trends & Insights

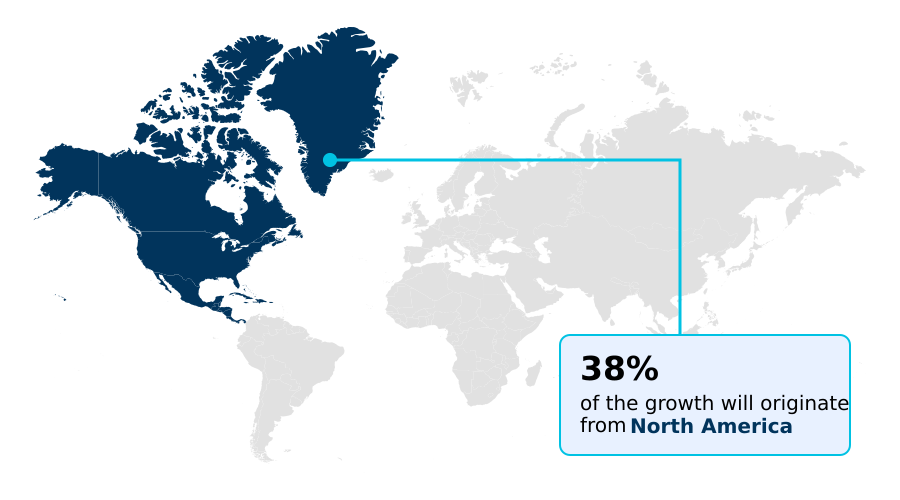
  • North America dominated the market and accounted for a 38% growth during the forecast period.
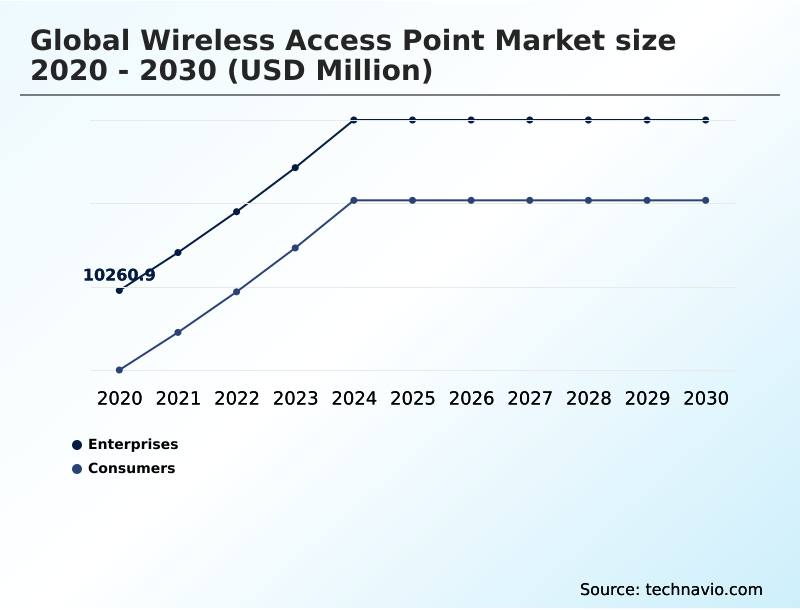
  • By End-user - Enterprises segment was valued at USD 12.51 billion in 2024
  • By Product - Gateways or routers segment accounted for the largest market revenue share in 2024

Market Size & Forecast

  • Market Opportunities: USD 14.56 billion
  • Market Future Opportunities: USD 8.72 billion
  • CAGR from 2025 to 2030 : 6.1%

Market Summary

  • The wireless access point market is undergoing a significant transformation, driven by the relentless demand for ubiquitous, high-capacity connectivity. Digital transformation initiatives compel organizations to modernize their networks to support an explosion of connected devices, from employee smartphones to thousands of IoT sensors on a factory floor.
  • In logistics, for example, a robust wireless infrastructure is no longer a convenience but a necessity for real-time inventory tracking, automated warehouse operations, and supply chain visibility, where network downtime can halt operations entirely. Key trends include the integration of artificial intelligence for network optimization and the shift towards cloud-managed platforms, which simplify deployment and maintenance.
  • The evolution of Wi-Fi standards, such as Wi-Fi 6E and Wi-Fi 7, provides the multi-gigabit speeds and low latency required for emerging applications like augmented reality and industrial automation.
  • However, this progress is met with challenges related to escalating security threats and the high total cost of ownership, including necessary upgrades to the underlying wired infrastructure to support the full potential of modern access points. The market is defined by this interplay between technological advancement, operational demands, and financial realities.

What will be the Size of the Wireless Access Point Market during the forecast period?

Get Key Insights on Market Forecast (PDF) Request Free Sample

How is the Wireless Access Point Market Segmented?

The wireless access point industry research report provides comprehensive data (region-wise segment analysis), with forecasts and estimates in "USD million" for the period 2026-2030, as well as historical data from 2020-2024 for the following segments.

  • End-user
    • Enterprises
    • Consumers
  • Product
    • Gateways or routers
    • Dependent AP
    • Independent AP
  • Type
    • Indoor
    • Outdoor
  • Geography
    • North America
      • US
      • Canada
      • Mexico
    • APAC
      • China
      • India
      • Japan
    • Europe
      • Germany
      • UK
      • France
    • South America
      • Brazil
      • Argentina
    • Middle East and Africa
      • Saudi Arabia
      • UAE
      • South Africa
    • Rest of World (ROW)

By End-user Insights

The enterprises segment is estimated to witness significant growth during the forecast period.

The enterprise segment is driven by a focus on performance, security, and total cost of ownership reduction over initial hardware costs.

Organizations prioritize solutions that deliver reliable, high-throughput data transfer and low-latency wireless communication to support business-critical applications and cloud services. Key requirements include dynamic radio resource management and BSS coloring interference mitigation for high-density environments.

The adoption of platforms with integrated network access control and support for SASE frameworks reflects the demand for enterprise-grade wireless security. For example, implementing advanced quality of service policies for video conferencing can improve performance by over 30%.

Centralized management via a wireless LAN controller or cloud dashboard is essential for operational efficiency, enabling consistent application of granular policy enforcement and network traffic segmentation across the infrastructure, ensuring network service level agreement compliance.

Request Free Sample

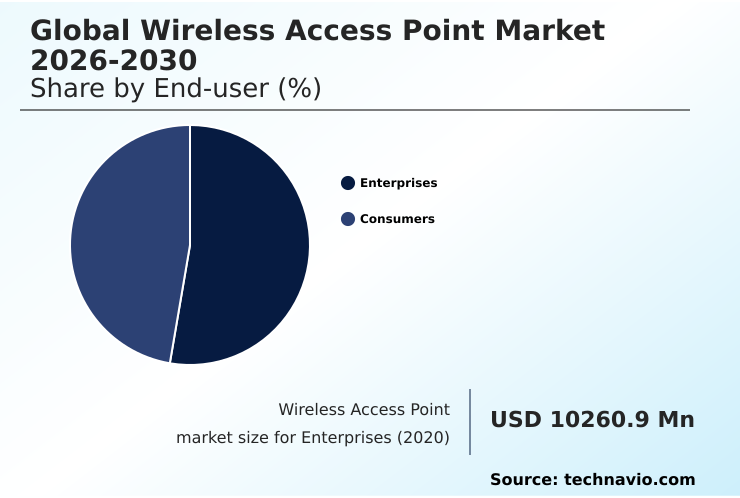
The Enterprises segment was valued at USD 12.51 billion in 2024 and showed a gradual increase during the forecast period.

Request Free Sample

Regional Analysis

North America is estimated to contribute 38% to the growth of the global market during the forecast period.Technavio’s analysts have elaborately explained the regional trends and drivers that shape the market during the forecast period.

See How Wireless Access Point Market Demand is Rising in North America Request Free Sample

The global landscape is defined by varied adoption rates, with North America accounting for 38% of incremental growth due to aggressive network refresh cycles.

The region's rapid Wi-Fi 6E spectrum access is driving deployments that leverage the 6 GHz band operation, often utilizing a dependent access point architecture managed from a centralized management dashboard.

In contrast, emerging regions are focused on expanding public Wi-Fi deployment. A key trend across all regions is the evaluation of private 5G and Wi-Fi convergence for deterministic connectivity, using advanced antenna technology in customer premises equipment.

This approach enhances the business continuity solution for critical operations.

By implementing network performance baselining, organizations can improve cyber threat detection and enable real-time location services, with some achieving a 25% reduction in mean-time-to-resolution for network events, ensuring seamless client roaming.

Market Dynamics

Our researchers analyzed the data with 2025 as the base year, along with the key drivers, trends, and challenges. A holistic analysis of drivers will help companies refine their marketing strategies to gain a competitive advantage.

  • Strategic decisions in the global wireless access point market 2026-2030 are increasingly complex, balancing immediate needs with long-term infrastructure viability. The process of deploying Wi-Fi 6E in enterprise environments highlights this, as it often requires upgrading switches for multi-gigabit Wi-Fi.
  • The debate between cloud-managed vs controller-based Wi-Fi continues, with many weighing the benefits of Network as a Service against traditional capital expenditures. A core focus is on AI-driven Wi-Fi network optimization for managing high-density Wi-Fi networks and troubleshooting co-channel RF interference. The convergence of Wi-Fi and private 5G is gaining traction for mission-critical use cases.
  • Security remains paramount, with a strong emphasis on securing BYOD on corporate Wi-Fi and implementing robust security for enterprise IoT devices through network segmentation for guest access and SASE integration with wireless networks. The total cost of Wi-Fi infrastructure is a critical factor, driving interest in solutions that offer zero-touch provisioning for distributed networks.
  • Outdoor wireless access point deployment and reliable wireless backhaul for remote sites are key for extending connectivity. Modern systems also leverage BLE integration for location services. As organizations prepare for Wi-Fi 7 for immersive applications, setting QoS policies for video conferencing is essential for reducing latency for real-time applications.
  • Utilizing the benefits of OFDMA in crowded environments has shown to improve spectral efficiency by more than 35% compared to older standards.

What are the key market drivers leading to the rise in the adoption of Wireless Access Point Industry?

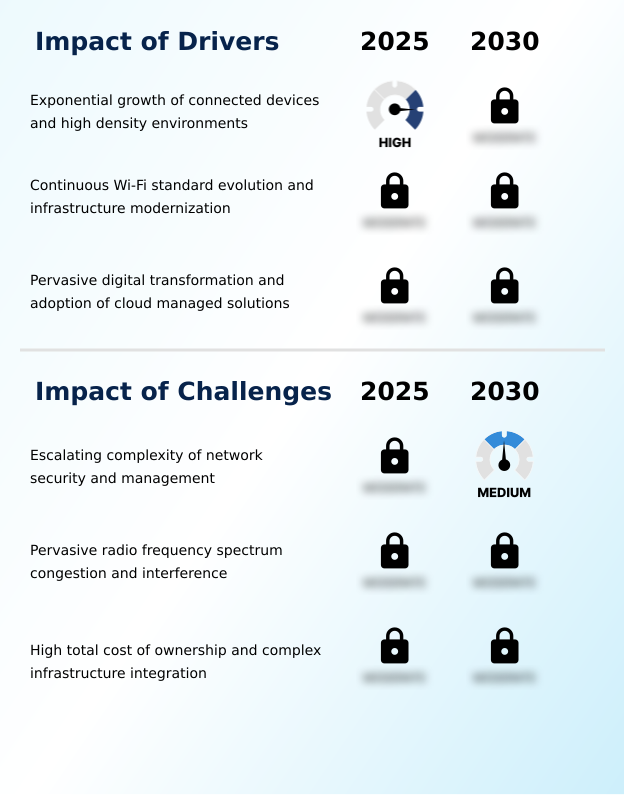
  • The exponential growth of connected devices and the increasing prevalence of high-density environments are primary drivers propelling market expansion.

  • The market is propelled by the need for network infrastructure modernization to support digital transformation enablers.
  • The adoption of Wi-Fi 6 technology, featuring Orthogonal Frequency Division Multiple Access, is critical for high-density environment performance, improving network efficiency by over 30% in crowded spaces.
  • The proliferation of Internet of Things (IoT) connectivity and widespread Bring Your Own Device (BYOD) policies demand high-throughput data transfer and low-latency wireless communication.
  • Cloud-managed networking platforms featuring zero-touch provisioning deployment are instrumental in this transition, simplifying management for hybrid work model support.
  • For instance, smart building infrastructure projects are leveraging these advancements to connect thousands of devices, with some achieving a 15% reduction in energy consumption through better device management.

What are the market trends shaping the Wireless Access Point Industry?

  • The emergence of artificial intelligence and machine learning for network automation is a defining market trend. This evolution represents a shift toward self-optimizing and predictive wireless infrastructures.

  • A defining trend is the shift toward intelligent, automated networks. The integration of AI for IT operations (AIOps) and machine learning network automation is creating self-optimizing wireless networks capable of predictive network analytics. This allows for automated root cause analysis, reducing IT intervention by up to 40%.
  • Concurrently, the Network as a Service (NaaS) model is gaining traction, promoting a subscription-based consumption model that aligns with operational expenditure budgets. This trend toward converged networking and security transforms the access point into a multi-protocol wireless hub with advanced capabilities.
  • The adoption of software-defined networking principles further enhances flexibility, with some deployments reporting a 25% improvement in network provisioning speed, contributing to overall user experience optimization.

What challenges does the Wireless Access Point Industry face during its growth?

  • The escalating complexity of network security and management presents a significant challenge to market growth and adoption.

  • A primary challenge is managing spectrum congestion and the high total cost of ownership. The need for continuous radio frequency optimization to mitigate co-channel interference in unlicensed spectrum bands is intensifying. Upgrading to multi-gigabit Ethernet backhaul and switches with newer Power over Ethernet standards to support modern autonomous access points adds significant expense to the network refresh cycle.
  • This financial barrier can delay adoption, as ancillary infrastructure costs can exceed the cost of the access points by more than 50%. Furthermore, ensuring enterprise-grade wireless security requires constant vigilance and sophisticated tools.
  • The complexity of client device onboarding and implementing granular policy enforcement across a diverse device landscape necessitates robust unified threat management and wireless intrusion prevention systems, increasing the management burden if not properly automated.

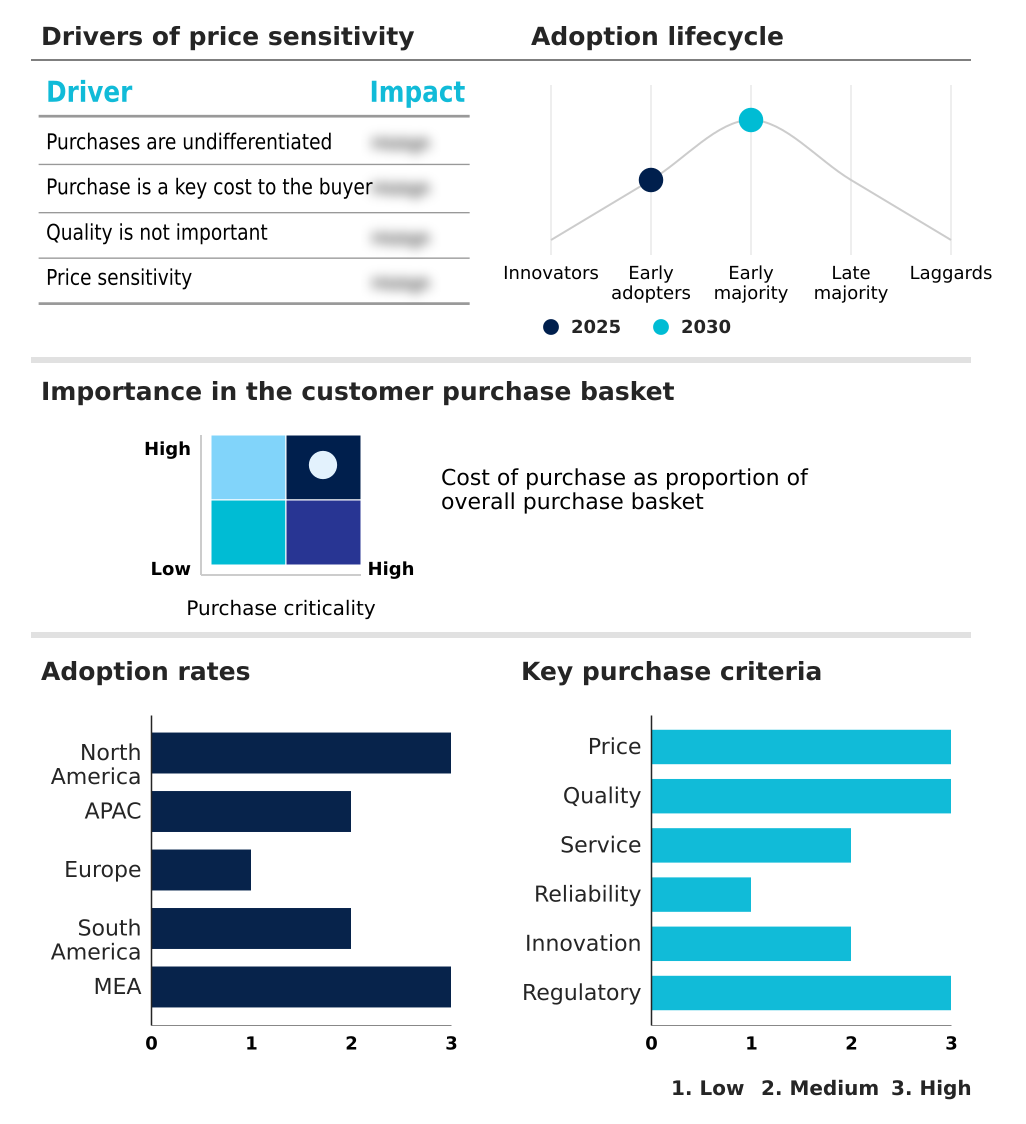
Exclusive Technavio Analysis on Customer Landscape

The wireless access point market forecasting report includes the adoption lifecycle of the market, covering from the innovator’s stage to the laggard’s stage. It focuses on adoption rates in different regions based on penetration. Furthermore, the wireless access point market report also includes key purchase criteria and drivers of price sensitivity to help companies evaluate and develop their market growth analysis strategies.

Customer Landscape of Wireless Access Point Industry

Competitive Landscape

Companies are implementing various strategies, such as strategic alliances, wireless access point market forecast, partnerships, mergers and acquisitions, geographical expansion, and product/service launches, to enhance their presence in the industry.

ALE International - The vendor provides communication equipment and services focused on telecommunications companies, forming a critical part of the network infrastructure supply chain for service providers.

The industry research and growth report includes detailed analyses of the competitive landscape of the market and information about key companies, including:

  • ALE International
  • Allied Telesis Inc.
  • Avaya LLC
  • Cambium Networks Corp.
  • Cisco Systems Inc.
  • CommScope Holding Co. Inc.
  • D Link Corp.
  • Edgecore Networks Corp.
  • EnGenius Technologies Inc.
  • Extreme Networks Inc.
  • Fortinet Inc.
  • Hewlett Packard Entp Co.
  • Huawei Technologies Co. Ltd.
  • NETGEAR Inc.
  • SIA Mikrotikls
  • Sophos Group Ltd.
  • TP Link Corp. Ltd.
  • Ubiquiti Inc.
  • ZTE Corp.

Qualitative and quantitative analysis of companies has been conducted to help clients understand the wider business environment as well as the strengths and weaknesses of key industry players. Data is qualitatively analyzed to categorize companies as pure play, category-focused, industry-focused, and diversified; it is quantitatively analyzed to categorize companies as dominant, leading, strong, tentative, and weak.

Recent Development and News in Wireless access point market

  • In January 2025, TP-Link unveiled its Deco BE68 Whole Home Mesh Wi-Fi 7 system, signaling the industry's move to embrace next-generation wireless technology for consumer and SOHO environments.
  • In February 2025, Fortinet announced the integration of next-generation firewall capabilities into its wireless access point series, reflecting a market trend toward converging networking and security at the network edge.
  • In February 2025, the European Union passed the 'Connected Continent' regulation, mandating Wi-Fi coverage in public buildings and transport hubs, creating a significant, long-term driver for hardware deployment across member states.
  • In February 2025, stc Group partnered with Ericsson to scale AI-driven network automation solutions, enhancing its 5G network capabilities and improving the underlying infrastructure for advanced wireless services.

Dive into Technavio’s robust research methodology, blending expert interviews, extensive data synthesis, and validated models for unparalleled Wireless Access Point Market insights. See full methodology.

Market Scope
Page number 299
Base year 2025
Historic period 2020-2024
Forecast period 2026-2030
Growth momentum & CAGR Accelerate at a CAGR of 6.1%
Market growth 2026-2030 USD 8715.7 million
Market structure Fragmented
YoY growth 2025-2026(%) 5.8%
Key countries US, Canada, Mexico, China, India, Japan, South Korea, Australia, Indonesia, Germany, UK, France, Italy, Spain, The Netherlands, Brazil, Argentina, Chile, Saudi Arabia, UAE, South Africa, Nigeria and Egypt
Competitive landscape Leading Companies, Market Positioning of Companies, Competitive Strategies, and Industry Risks

Request Free Sample

Research Analyst Overview

  • The wireless access point market is defined by a rapid innovation cycle where high-density environment performance is a critical benchmark. The adoption of Wi-Fi 6 (802.11ax) technology, with its use of Orthogonal Frequency Division Multiple Access and BSS Coloring interference mitigation, has become standard.
  • Boardroom decisions now weigh the benefits of a Network as a Service (NaaS) model against traditional capital outlays for wireless LAN controller hardware, especially when considering the continuous need for upgrades to standards like Wi-Fi 7 (802.11be). Modern systems function as a multi-protocol wireless hub, integrating Bluetooth Low Energy (BLE) and enabling private 5G and Wi-Fi convergence.
  • Key features include dynamic radio resource management and predictive network analytics, driven by AI for IT Operations (AIOps) and machine learning network automation. These self-optimizing wireless networks use zero-touch provisioning deployment and cloud-managed networking platforms to simplify operations.
  • The architecture supports both dependent access point and autonomous access point models, connecting via multi-gigabit Ethernet backhaul with Power over Ethernet (PoE) standards. Security is embedded through integrated network access control, wireless intrusion prevention systems, and support for Secure Access Service Edge (SASE), with some deployments achieving a 40% reduction in threat detection times.
  • This addresses demands for application quality of service (QoS) and unified threat management (UTM), which are vital for supporting Bring Your Own Device (BYOD) policies and widespread Internet of Things (IoT) connectivity.

What are the Key Data Covered in this Wireless Access Point Market Research and Growth Report?

  • What is the expected growth of the Wireless Access Point Market between 2026 and 2030?

    • USD 8.72 billion, at a CAGR of 6.1%

  • What segmentation does the market report cover?

    • The report is segmented by End-user (Enterprises, and Consumers), Product (Gateways or routers, Dependent AP, and Independent AP), Type (Indoor, and Outdoor) and Geography (North America, APAC, Europe, South America, Middle East and Africa)

  • Which regions are analyzed in the report?

    • North America, APAC, Europe, South America and Middle East and Africa

  • What are the key growth drivers and market challenges?

    • Exponential growth of connected devices and high density environments, Escalating complexity of network security and management

  • Who are the major players in the Wireless Access Point Market?

    • ALE International, Allied Telesis Inc., Avaya LLC, Cambium Networks Corp., Cisco Systems Inc., CommScope Holding Co. Inc., D Link Corp., Edgecore Networks Corp., EnGenius Technologies Inc., Extreme Networks Inc., Fortinet Inc., Hewlett Packard Entp Co., Huawei Technologies Co. Ltd., NETGEAR Inc., SIA Mikrotikls, Sophos Group Ltd., TP Link Corp. Ltd., Ubiquiti Inc. and ZTE Corp.

Market Research Insights

  • The market's momentum is shaped by a pervasive digital transformation enabler and strong support for hybrid work models, which has led to widespread network infrastructure modernization.
  • The adoption of a subscription-based consumption model is accelerating, offering an operational expenditure model that reduces the total cost of ownership and improves business continuity solutions, with some firms reporting a 20% faster network refresh cycle. Enterprise-grade wireless security and advanced antenna technology are critical for spectrum congestion management, which can reduce connectivity-related support tickets by over 30%.
  • Solutions now facilitate seamless client roaming and client device onboarding, with granular policy enforcement for enhanced security. For industrial IoT use cases and smart building infrastructure, features like real-time location services and indoor wayfinding applications are becoming standard.
  • This evolution is driven by the need for user experience optimization and more efficient remote network troubleshooting, with automated network performance baselining improving diagnostic accuracy by up to 40%.

We can help! Our analysts can customize this wireless access point market research report to meet your requirements.

Get in touch

1. Executive Summary

1.1 Market overview

Executive Summary - Chart on Market Overview
Executive Summary - Data Table on Market Overview
Executive Summary - Chart on Global Market Characteristics
Executive Summary - Chart on Market by Geography
Executive Summary - Chart on Market Segmentation by End-user
Executive Summary - Chart on Market Segmentation by Product
Executive Summary - Chart on Market Segmentation by Type
Executive Summary - Chart on Incremental Growth
Executive Summary - Data Table on Incremental Growth
Executive Summary - Chart on Company Market Positioning

2. Technavio Analysis

2.1 Analysis of price sensitivity, lifecycle, customer purchase basket, adoption rates, and purchase criteria

2.2 Criticality of inputs and Factors of differentiation

Chart on Overview on criticality of inputs and factors of differentiation

2.3 Factors of disruption

Chart on Overview on factors of disruption

2.4 Impact of drivers and challenges

Chart on Impact of drivers and challenges in 2025 and 2030

3. Market Landscape

3.1 Market ecosystem

Chart on Parent Market
Data Table on - Parent Market

3.2 Market characteristics

Chart on Market characteristics analysis

3.3 Value chain analysis

Chart on Value chain analysis

4. Market Sizing

4.1 Market definition

Data Table on Offerings of companies included in the market definition

4.2 Market segment analysis

Market segments

4.3 Market size 2025

4.4 Market outlook: Forecast for 2025-2030

Chart on Global - Market size and forecast 2025-2030 ($ million)
Data Table on Global - Market size and forecast 2025-2030 ($ million)
Chart on Global Market: Year-over-year growth 2025-2030 (%)
Data Table on Global Market: Year-over-year growth 2025-2030 (%)

5. Historic Market Size

5.1 Global Wireless Access Point Market 2020 - 2024

Historic Market Size - Data Table on Global Wireless Access Point Market 2020 - 2024 ($ million)

5.2 End-user segment analysis 2020 - 2024

Historic Market Size - End-user Segment 2020 - 2024 ($ million)

5.3 Product segment analysis 2020 - 2024

Historic Market Size - Product Segment 2020 - 2024 ($ million)

5.4 Type segment analysis 2020 - 2024

Historic Market Size - Type Segment 2020 - 2024 ($ million)

5.5 Geography segment analysis 2020 - 2024

Historic Market Size - Geography Segment 2020 - 2024 ($ million)

5.6 Country segment analysis 2020 - 2024

Historic Market Size - Country Segment 2020 - 2024 ($ million)

6. Qualitative Analysis

6.1 The impact of AI on Global Wireless Access Point Market

7. Five Forces Analysis

7.1 Five forces summary

Five forces analysis - Comparison between 2025 and 2030

7.2 Bargaining power of buyers

Bargaining power of buyers - Impact of key factors 2025 and 2030

7.3 Bargaining power of suppliers

Bargaining power of suppliers - Impact of key factors in 2025 and 2030

7.4 Threat of new entrants

Threat of new entrants - Impact of key factors in 2025 and 2030

7.5 Threat of substitutes

Threat of substitutes - Impact of key factors in 2025 and 2030

7.6 Threat of rivalry

Threat of rivalry - Impact of key factors in 2025 and 2030

7.7 Market condition

Chart on Market condition - Five forces 2025 and 2030

8. Market Segmentation by End-user

8.1 Market segments

Chart on End-user - Market share 2025-2030 (%)
Data Table on End-user - Market share 2025-2030 (%)

8.2 Comparison by End-user

Chart on Comparison by End-user
Data Table on Comparison by End-user

8.3 Enterprises - Market size and forecast 2025-2030

Chart on Enterprises - Market size and forecast 2025-2030 ($ million)
Data Table on Enterprises - Market size and forecast 2025-2030 ($ million)
Chart on Enterprises - Year-over-year growth 2025-2030 (%)
Data Table on Enterprises - Year-over-year growth 2025-2030 (%)

8.4 Consumers - Market size and forecast 2025-2030

Chart on Consumers - Market size and forecast 2025-2030 ($ million)
Data Table on Consumers - Market size and forecast 2025-2030 ($ million)
Chart on Consumers - Year-over-year growth 2025-2030 (%)
Data Table on Consumers - Year-over-year growth 2025-2030 (%)

8.5 Market opportunity by End-user

Market opportunity by End-user ($ million)
Data Table on Market opportunity by End-user ($ million)

9. Market Segmentation by Product

9.1 Market segments

Chart on Product - Market share 2025-2030 (%)
Data Table on Product - Market share 2025-2030 (%)

9.2 Comparison by Product

Chart on Comparison by Product
Data Table on Comparison by Product

9.3 Gateways or routers - Market size and forecast 2025-2030

Chart on Gateways or routers - Market size and forecast 2025-2030 ($ million)
Data Table on Gateways or routers - Market size and forecast 2025-2030 ($ million)
Chart on Gateways or routers - Year-over-year growth 2025-2030 (%)
Data Table on Gateways or routers - Year-over-year growth 2025-2030 (%)

9.4 Dependent AP - Market size and forecast 2025-2030

Chart on Dependent AP - Market size and forecast 2025-2030 ($ million)
Data Table on Dependent AP - Market size and forecast 2025-2030 ($ million)
Chart on Dependent AP - Year-over-year growth 2025-2030 (%)
Data Table on Dependent AP - Year-over-year growth 2025-2030 (%)

9.5 Independent AP - Market size and forecast 2025-2030

Chart on Independent AP - Market size and forecast 2025-2030 ($ million)
Data Table on Independent AP - Market size and forecast 2025-2030 ($ million)
Chart on Independent AP - Year-over-year growth 2025-2030 (%)
Data Table on Independent AP - Year-over-year growth 2025-2030 (%)

9.6 Market opportunity by Product

Market opportunity by Product ($ million)
Data Table on Market opportunity by Product ($ million)

10. Market Segmentation by Type

10.1 Market segments

Chart on Type - Market share 2025-2030 (%)
Data Table on Type - Market share 2025-2030 (%)

10.2 Comparison by Type

Chart on Comparison by Type
Data Table on Comparison by Type

10.3 Indoor - Market size and forecast 2025-2030

Chart on Indoor - Market size and forecast 2025-2030 ($ million)
Data Table on Indoor - Market size and forecast 2025-2030 ($ million)
Chart on Indoor - Year-over-year growth 2025-2030 (%)
Data Table on Indoor - Year-over-year growth 2025-2030 (%)

10.4 Outdoor - Market size and forecast 2025-2030

Chart on Outdoor - Market size and forecast 2025-2030 ($ million)
Data Table on Outdoor - Market size and forecast 2025-2030 ($ million)
Chart on Outdoor - Year-over-year growth 2025-2030 (%)
Data Table on Outdoor - Year-over-year growth 2025-2030 (%)

10.5 Market opportunity by Type

Market opportunity by Type ($ million)
Data Table on Market opportunity by Type ($ million)

11. Customer Landscape

11.1 Customer landscape overview

Analysis of price sensitivity, lifecycle, customer purchase basket, adoption rates, and purchase criteria

12. Geographic Landscape

12.1 Geographic segmentation

Chart on Market share by geography 2025-2030 (%)
Data Table on Market share by geography 2025-2030 (%)

12.2 Geographic comparison

Chart on Geographic comparison
Data Table on Geographic comparison

12.3 North America - Market size and forecast 2025-2030

Chart on North America - Market size and forecast 2025-2030 ($ million)
Data Table on North America - Market size and forecast 2025-2030 ($ million)
Chart on North America - Year-over-year growth 2025-2030 (%)
Data Table on North America - Year-over-year growth 2025-2030 (%)
Chart on Regional Comparison - North America
Data Table on Regional Comparison - North America

12.3.1 US - Market size and forecast 2025-2030

Chart on US - Market size and forecast 2025-2030 ($ million)
Data Table on US - Market size and forecast 2025-2030 ($ million)
Chart on US - Year-over-year growth 2025-2030 (%)
Data Table on US - Year-over-year growth 2025-2030 (%)

12.3.2 Canada - Market size and forecast 2025-2030

Chart on Canada - Market size and forecast 2025-2030 ($ million)
Data Table on Canada - Market size and forecast 2025-2030 ($ million)
Chart on Canada - Year-over-year growth 2025-2030 (%)
Data Table on Canada - Year-over-year growth 2025-2030 (%)

12.3.3 Mexico - Market size and forecast 2025-2030

Chart on Mexico - Market size and forecast 2025-2030 ($ million)
Data Table on Mexico - Market size and forecast 2025-2030 ($ million)
Chart on Mexico - Year-over-year growth 2025-2030 (%)
Data Table on Mexico - Year-over-year growth 2025-2030 (%)

12.4 APAC - Market size and forecast 2025-2030

Chart on APAC - Market size and forecast 2025-2030 ($ million)
Data Table on APAC - Market size and forecast 2025-2030 ($ million)
Chart on APAC - Year-over-year growth 2025-2030 (%)
Data Table on APAC - Year-over-year growth 2025-2030 (%)
Chart on Regional Comparison - APAC
Data Table on Regional Comparison - APAC

12.4.1 China - Market size and forecast 2025-2030

Chart on China - Market size and forecast 2025-2030 ($ million)
Data Table on China - Market size and forecast 2025-2030 ($ million)
Chart on China - Year-over-year growth 2025-2030 (%)
Data Table on China - Year-over-year growth 2025-2030 (%)

12.4.2 India - Market size and forecast 2025-2030

Chart on India - Market size and forecast 2025-2030 ($ million)
Data Table on India - Market size and forecast 2025-2030 ($ million)
Chart on India - Year-over-year growth 2025-2030 (%)
Data Table on India - Year-over-year growth 2025-2030 (%)

12.4.3 Japan - Market size and forecast 2025-2030

Chart on Japan - Market size and forecast 2025-2030 ($ million)
Data Table on Japan - Market size and forecast 2025-2030 ($ million)
Chart on Japan - Year-over-year growth 2025-2030 (%)
Data Table on Japan - Year-over-year growth 2025-2030 (%)

12.4.4 South Korea - Market size and forecast 2025-2030

Chart on South Korea - Market size and forecast 2025-2030 ($ million)
Data Table on South Korea - Market size and forecast 2025-2030 ($ million)
Chart on South Korea - Year-over-year growth 2025-2030 (%)
Data Table on South Korea - Year-over-year growth 2025-2030 (%)

12.4.5 Australia - Market size and forecast 2025-2030

Chart on Australia - Market size and forecast 2025-2030 ($ million)
Data Table on Australia - Market size and forecast 2025-2030 ($ million)
Chart on Australia - Year-over-year growth 2025-2030 (%)
Data Table on Australia - Year-over-year growth 2025-2030 (%)

12.4.6 Indonesia - Market size and forecast 2025-2030

Chart on Indonesia - Market size and forecast 2025-2030 ($ million)
Data Table on Indonesia - Market size and forecast 2025-2030 ($ million)
Chart on Indonesia - Year-over-year growth 2025-2030 (%)
Data Table on Indonesia - Year-over-year growth 2025-2030 (%)

12.5 Europe - Market size and forecast 2025-2030

Chart on Europe - Market size and forecast 2025-2030 ($ million)
Data Table on Europe - Market size and forecast 2025-2030 ($ million)
Chart on Europe - Year-over-year growth 2025-2030 (%)
Data Table on Europe - Year-over-year growth 2025-2030 (%)
Chart on Regional Comparison - Europe
Data Table on Regional Comparison - Europe

12.5.1 Germany - Market size and forecast 2025-2030

Chart on Germany - Market size and forecast 2025-2030 ($ million)
Data Table on Germany - Market size and forecast 2025-2030 ($ million)
Chart on Germany - Year-over-year growth 2025-2030 (%)
Data Table on Germany - Year-over-year growth 2025-2030 (%)

12.5.2 UK - Market size and forecast 2025-2030

Chart on UK - Market size and forecast 2025-2030 ($ million)
Data Table on UK - Market size and forecast 2025-2030 ($ million)
Chart on UK - Year-over-year growth 2025-2030 (%)
Data Table on UK - Year-over-year growth 2025-2030 (%)

12.5.3 France - Market size and forecast 2025-2030

Chart on France - Market size and forecast 2025-2030 ($ million)
Data Table on France - Market size and forecast 2025-2030 ($ million)
Chart on France - Year-over-year growth 2025-2030 (%)
Data Table on France - Year-over-year growth 2025-2030 (%)

12.5.4 Italy - Market size and forecast 2025-2030

Chart on Italy - Market size and forecast 2025-2030 ($ million)
Data Table on Italy - Market size and forecast 2025-2030 ($ million)
Chart on Italy - Year-over-year growth 2025-2030 (%)
Data Table on Italy - Year-over-year growth 2025-2030 (%)

12.5.5 Spain - Market size and forecast 2025-2030

Chart on Spain - Market size and forecast 2025-2030 ($ million)
Data Table on Spain - Market size and forecast 2025-2030 ($ million)
Chart on Spain - Year-over-year growth 2025-2030 (%)
Data Table on Spain - Year-over-year growth 2025-2030 (%)

12.5.6 The Netherlands - Market size and forecast 2025-2030

Chart on The Netherlands - Market size and forecast 2025-2030 ($ million)
Data Table on The Netherlands - Market size and forecast 2025-2030 ($ million)
Chart on The Netherlands - Year-over-year growth 2025-2030 (%)
Data Table on The Netherlands - Year-over-year growth 2025-2030 (%)

12.6 South America - Market size and forecast 2025-2030

Chart on South America - Market size and forecast 2025-2030 ($ million)
Data Table on South America - Market size and forecast 2025-2030 ($ million)
Chart on South America - Year-over-year growth 2025-2030 (%)
Data Table on South America - Year-over-year growth 2025-2030 (%)
Chart on Regional Comparison - South America
Data Table on Regional Comparison - South America

12.6.1 Brazil - Market size and forecast 2025-2030

Chart on Brazil - Market size and forecast 2025-2030 ($ million)
Data Table on Brazil - Market size and forecast 2025-2030 ($ million)
Chart on Brazil - Year-over-year growth 2025-2030 (%)
Data Table on Brazil - Year-over-year growth 2025-2030 (%)

12.6.2 Argentina - Market size and forecast 2025-2030

Chart on Argentina - Market size and forecast 2025-2030 ($ million)
Data Table on Argentina - Market size and forecast 2025-2030 ($ million)
Chart on Argentina - Year-over-year growth 2025-2030 (%)
Data Table on Argentina - Year-over-year growth 2025-2030 (%)

12.6.3 Chile - Market size and forecast 2025-2030

Chart on Chile - Market size and forecast 2025-2030 ($ million)
Data Table on Chile - Market size and forecast 2025-2030 ($ million)
Chart on Chile - Year-over-year growth 2025-2030 (%)
Data Table on Chile - Year-over-year growth 2025-2030 (%)

12.7 Middle East and Africa - Market size and forecast 2025-2030

Chart on Middle East and Africa - Market size and forecast 2025-2030 ($ million)
Data Table on Middle East and Africa - Market size and forecast 2025-2030 ($ million)
Chart on Middle East and Africa - Year-over-year growth 2025-2030 (%)
Data Table on Middle East and Africa - Year-over-year growth 2025-2030 (%)
Chart on Regional Comparison - Middle East and Africa
Data Table on Regional Comparison - Middle East and Africa

12.7.1 Saudi Arabia - Market size and forecast 2025-2030

Chart on Saudi Arabia - Market size and forecast 2025-2030 ($ million)
Data Table on Saudi Arabia - Market size and forecast 2025-2030 ($ million)
Chart on Saudi Arabia - Year-over-year growth 2025-2030 (%)
Data Table on Saudi Arabia - Year-over-year growth 2025-2030 (%)

12.7.2 UAE - Market size and forecast 2025-2030

Chart on UAE - Market size and forecast 2025-2030 ($ million)
Data Table on UAE - Market size and forecast 2025-2030 ($ million)
Chart on UAE - Year-over-year growth 2025-2030 (%)
Data Table on UAE - Year-over-year growth 2025-2030 (%)

12.7.3 South Africa - Market size and forecast 2025-2030

Chart on South Africa - Market size and forecast 2025-2030 ($ million)
Data Table on South Africa - Market size and forecast 2025-2030 ($ million)
Chart on South Africa - Year-over-year growth 2025-2030 (%)
Data Table on South Africa - Year-over-year growth 2025-2030 (%)

12.7.4 Nigeria - Market size and forecast 2025-2030

Chart on Nigeria - Market size and forecast 2025-2030 ($ million)
Data Table on Nigeria - Market size and forecast 2025-2030 ($ million)
Chart on Nigeria - Year-over-year growth 2025-2030 (%)
Data Table on Nigeria - Year-over-year growth 2025-2030 (%)

12.7.5 Egypt - Market size and forecast 2025-2030

Chart on Egypt - Market size and forecast 2025-2030 ($ million)
Data Table on Egypt - Market size and forecast 2025-2030 ($ million)
Chart on Egypt - Year-over-year growth 2025-2030 (%)
Data Table on Egypt - Year-over-year growth 2025-2030 (%)

12.8 Market opportunity by geography

Market opportunity by geography ($ million)
Data Tables on Market opportunity by geography ($ million)

13. Drivers, Challenges, and Opportunity

13.1 Market drivers

Exponential growth of connected devices and high density environments
Continuous Wi-Fi standard evolution and infrastructure modernization
Pervasive digital transformation and adoption of cloud managed solutions

13.2 Market challenges

Escalating complexity of network security and management
Pervasive radio frequency spectrum congestion and interference
High total cost of ownership and complex infrastructure integration

13.3 Impact of drivers and challenges

Impact of drivers and challenges in 2025 and 2030

13.4 Market opportunities

Emergence of artificial intelligence and machine learning for network automation
Convergence of Wi-Fi with cellular and IoT protocols
Ascendancy of network-as-a-service and subscription based consumption

14. Competitive Landscape

14.1 Overview

14.2

Overview on criticality of inputs and factors of differentiation

14.3 Landscape disruption

Overview on factors of disruption

14.4 Industry risks

Impact of key risks on business

15. Competitive Analysis

15.1 Companies profiled

Companies covered

15.2 Company ranking index

15.3 Market positioning of companies

Matrix on companies position and classification

15.4 Allied Telesis Inc.

Allied Telesis Inc. - Overview
Allied Telesis Inc. - Product / Service
Allied Telesis Inc. - Key offerings
SWOT

15.5 Avaya LLC

Avaya LLC - Overview
Avaya LLC - Product / Service
Avaya LLC - Key news
Avaya LLC - Key offerings
SWOT

15.6 Cambium Networks Corp.

Cambium Networks Corp. - Overview
Cambium Networks Corp. - Product / Service
Cambium Networks Corp. - Key offerings
SWOT

15.7 Cisco Systems Inc.

Cisco Systems Inc. - Overview
Cisco Systems Inc. - Business segments
Cisco Systems Inc. - Key news
Cisco Systems Inc. - Key offerings
Cisco Systems Inc. - Segment focus
SWOT

15.8 CommScope Holding Co. Inc.

CommScope Holding Co. Inc. - Overview
CommScope Holding Co. Inc. - Business segments
CommScope Holding Co. Inc. - Key news
CommScope Holding Co. Inc. - Key offerings
CommScope Holding Co. Inc. - Segment focus
SWOT

15.9 D Link Corp.

D Link Corp. - Overview
D Link Corp. - Product / Service
D Link Corp. - Key offerings
SWOT

15.10 Edgecore Networks Corp.

Edgecore Networks Corp. - Overview
Edgecore Networks Corp. - Product / Service
Edgecore Networks Corp. - Key offerings
SWOT

15.11 Extreme Networks Inc.

Extreme Networks Inc. - Overview
Extreme Networks Inc. - Product / Service
Extreme Networks Inc. - Key news
Extreme Networks Inc. - Key offerings
SWOT

15.12 Fortinet Inc.

Fortinet Inc. - Overview
Fortinet Inc. - Product / Service
Fortinet Inc. - Key news
Fortinet Inc. - Key offerings
SWOT

15.13 Hewlett Packard Entp Co.

Hewlett Packard Entp Co. - Overview
Hewlett Packard Entp Co. - Business segments
Hewlett Packard Entp Co. - Key news
Hewlett Packard Entp Co. - Key offerings
Hewlett Packard Entp Co. - Segment focus
SWOT

15.14 Huawei Technologies Co. Ltd.

Huawei Technologies Co. Ltd. - Overview
Huawei Technologies Co. Ltd. - Business segments
Huawei Technologies Co. Ltd. - Key news
Huawei Technologies Co. Ltd. - Key offerings
Huawei Technologies Co. Ltd. - Segment focus
SWOT

15.15 NETGEAR Inc.

NETGEAR Inc. - Overview
NETGEAR Inc. - Business segments
NETGEAR Inc. - Key offerings
NETGEAR Inc. - Segment focus
SWOT

15.16 TP Link Corp. Ltd.

TP Link Corp. Ltd. - Overview
TP Link Corp. Ltd. - Product / Service
TP Link Corp. Ltd. - Key offerings
SWOT

15.17 Ubiquiti Inc.

Ubiquiti Inc. - Overview
Ubiquiti Inc. - Business segments
Ubiquiti Inc. - Key offerings
Ubiquiti Inc. - Segment focus
SWOT

15.18 ZTE Corp.

ZTE Corp. - Overview
ZTE Corp. - Business segments
ZTE Corp. - Key offerings
ZTE Corp. - Segment focus
SWOT

16. Appendix

16.1 Scope of the report

Market definition
Objectives
Notes and caveats

16.2 Inclusions and exclusions checklist

Inclusions checklist
Exclusions checklist

16.3 Currency conversion rates for US$

16.4 Research methodology

16.5 Data procurement

Information sources

16.6 Data validation

16.7 Validation techniques employed for market sizing

16.8 Data synthesis

16.9 360 degree market analysis

16.10 List of abbreviations

Research Methodology

Technavio presents a detailed picture of the market by way of study, synthesis, and summation of data from multiple sources. The analysts have presented the various facets of the market with a particular focus on identifying the key industry influencers. The data thus presented is comprehensive, reliable, and the result of extensive research, both primary and secondary.

INFORMATION SOURCES

Primary sources

  • Manufacturers and suppliers
  • Channel partners
  • Industry experts
  • Strategic decision makers

Secondary sources

  • Industry journals and periodicals
  • Government data
  • Financial reports of key industry players
  • Historical data
  • Press releases

DATA ANALYSIS

Data Synthesis

  • Collation of data
  • Estimation of key figures
  • Analysis of derived insights

Data Validation

  • Triangulation with data models
  • Reference against proprietary databases
  • Corroboration with industry experts

REPORT WRITING

Qualitative

  • Market drivers
  • Market challenges
  • Market trends
  • Five forces analysis

Quantitative

  • Market size and forecast
  • Market segmentation
  • Geographical insights
  • Competitive landscape

Interested in this report?

Get your sample now to see our research methodology and insights!

Download Now

Frequently Asked Questions

Wireless Access Point market growth will increase by USD 8715.7 million during 2026-2030.

The Wireless Access Point market is expected to grow at a CAGR of 6.1% during 2026-2030.

Wireless Access Point market is segmented by End-user (Enterprises, Consumers) Product (Gateways or routers, Dependent AP, Independent AP) Type (Indoor, Outdoor)

ALE International, Allied Telesis Inc., Avaya LLC, Cambium Networks Corp., Cisco Systems Inc., CommScope Holding Co. Inc., D Link Corp., Edgecore Networks Corp., EnGenius Technologies Inc., Extreme Networks Inc., Fortinet Inc., Hewlett Packard Entp Co., Huawei Technologies Co. Ltd., NETGEAR Inc., SIA Mikrotikls, Sophos Group Ltd., TP Link Corp. Ltd., Ubiquiti Inc., ZTE Corp. are a few of the key vendors in the Wireless Access Point market.

North America will register the highest growth rate of 38% among the other regions. Therefore, the Wireless Access Point market in North America is expected to garner significant business opportunities for the vendors during the forecast period.

US, Canada, Mexico, China, India, Japan, South Korea, Australia, Indonesia, Germany, UK, France, Italy, Spain, The Netherlands, Brazil, Argentina, Chile, Saudi Arabia, UAE, South Africa, Nigeria, Egypt

  • Exponential growth of connected devices and high density environments is the driving factor this market.

The Wireless Access Point market vendors should focus on grabbing business opportunities from the End-user segment as it accounted for the largest market share in the base year.