3D Desktop Printer Market Analysis North America, Europe, APAC, South America, Middle East and Africa - US, China, Germany, Canada, UK - Size and Forecast 2024-2028

3D Desktop Printer Market Analysis North America, Europe, APAC, South America, Middle East and Africa - US, China, Germany, Canada, UK - Size and Forecast 2024-2028

Published: May 2024 180 Pages SKU: IRTNTR40741

Market Overview at a Glance

$5.21 B
Market Opportunity
20.28%
CAGR
16.34
YoY growth 2023-2024(%)

3D Desktop Printer Market Size 2024-2028

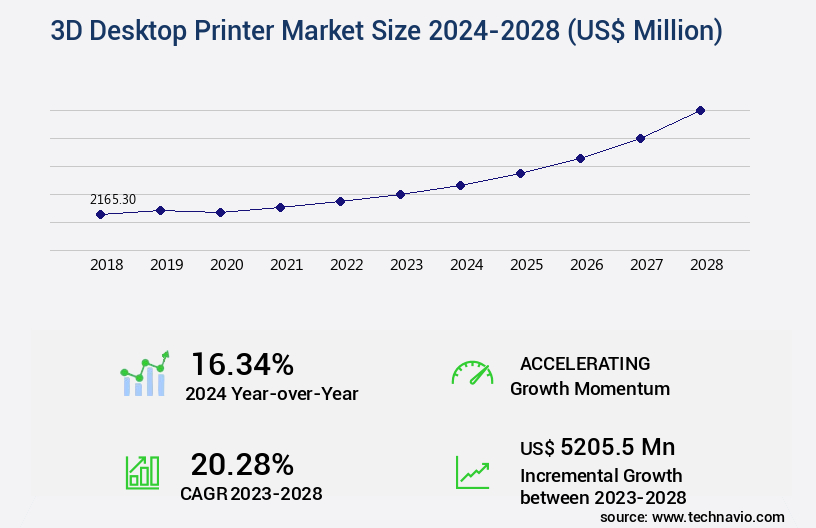
The 3d desktop printer market size is valued to increase by USD 5.21 billion, at a CAGR of 20.28% from 2023 to 2028. Increasing demand for 3D-printed jewelry will drive the 3d desktop printer market.

Market Insights

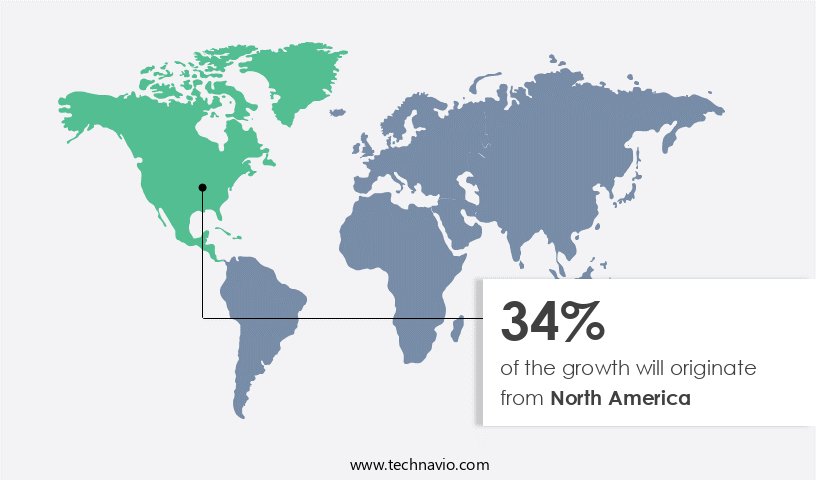
  • North America dominated the market and accounted for a 34% growth during the 2024-2028.
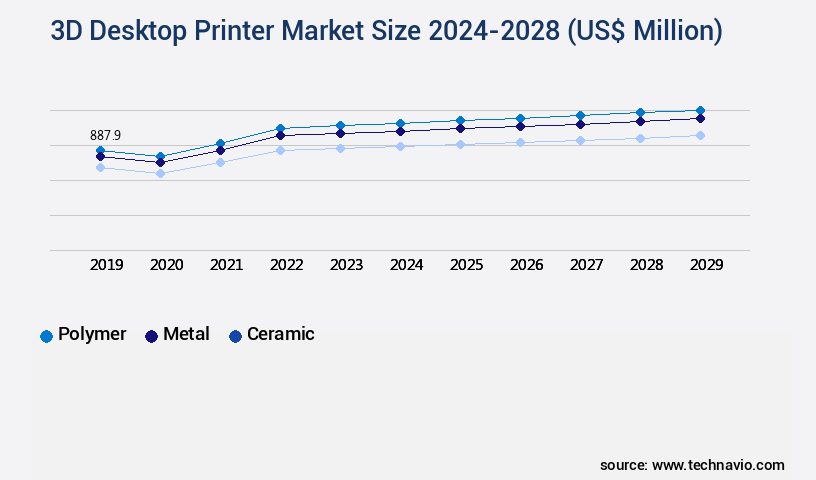
  • By Material - Polymer segment was valued at USD 781.20 billion in 2022
  • By Technology - FDM segment accounted for the largest market revenue share in 2022

Market Size & Forecast

  • Market Opportunities: USD 298.85 million 
  • Market Future Opportunities 2023: USD 5205.50 million
  • CAGR from 2023 to 2028 : 20.28%

Market Summary

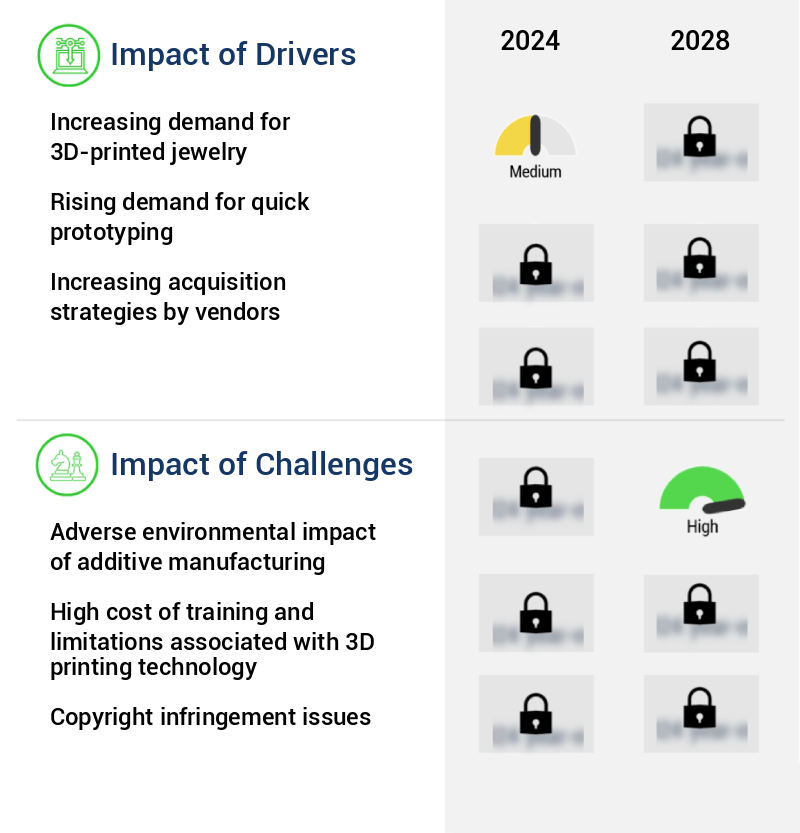
  • The market is experiencing significant growth as the technology advances and becomes more accessible to businesses and individuals. One of the primary drivers of this growth is the increasing demand for 3D-printed jewelry, which offers unique designs and customization options that traditional manufacturing methods cannot match. Another trend is the expansion of 3D printing in direct digital manufacturing, allowing for faster prototyping and production of complex parts. However, the market also faces challenges, including the adverse environmental impact of additive manufacturing, which raises concerns about energy consumption and waste generation. A real-world business scenario illustrating the benefits of 3D desktop printing is supply chain optimization.
  • By integrating 3D printing into their operations, companies can produce custom parts on-demand, reducing inventory costs and lead times, and improving overall operational efficiency. Despite these opportunities, it is crucial for businesses to consider the environmental impact and explore sustainable practices to mitigate the potential negative consequences of additive manufacturing.

What will be the size of the 3D Desktop Printer Market during the forecast period?

3D Desktop Printer Market Size

Get Key Insights on Market Forecast (PDF) Request Free Sample

  • The market is an ever-evolving landscape, showcasing significant advancements and trends that impact businesses across various industries. According to recent research, the adoption of 3D desktop printing technology has witnessed a substantial increase, with over 25% of businesses integrating it into their product development processes. This growth can be attributed to the technology's ability to reduce prototyping time and costs, enabling businesses to bring innovative products to market faster. Moreover, the versatility of 3D desktop printers is a game-changer for companies seeking to comply with complex regulatory requirements. For instance, in the healthcare sector, customized medical devices can be produced on-demand, ensuring adherence to specific patient needs and regulatory standards.
  • These advancements underscore the importance of staying informed about the latest developments in the market. 

Unpacking the 3D Desktop Printer Market Landscape

The market showcases advancements in technology, with significant strides made in software interfaces, print speed efficiency, and multi-material printing. These innovations result in improved return on investment through increased productivity and cost reduction. For instance, desktop printers with advanced slicing software algorithms enable faster print times, reducing the need for extended production cycles. Furthermore, the adoption of multi-material printing allows businesses to produce complex parts with various materials in a single build, streamlining the manufacturing process. Desktop printer mechanics and electronics have also evolved, with enhancements in print head design, UV curing systems, and material jetting contributing to higher print quality and reliability. Other key features, such as nozzle temperature control, support structures generation, and digital light processing, ensure compliance with industry standards and enhance overall product performance. The market continues to evolve, with ongoing research in areas like powder bed fusion, motion control systems, and build volume capacity, further expanding the capabilities of desktop 3D printing.

Key Market Drivers Fueling Growth

The surge in demand for 3D-printed jewelry serves as the primary market catalyst. With its unique design capabilities and potential for mass customization, this innovative technology is revolutionizing the jewelry industry.

  • The market is experiencing significant growth due to its application across various sectors, particularly in jewelry design. Changing consumer preferences and increasing fashion awareness have fueled the demand for new and innovative jewelry designs, leading jewelry manufacturers to adopt advanced manufacturing technologies like Computer-Aided Design (CAD) and 3D desktop printers. These printers, equipped with rapid prototyping technology, enable designers to easily review design concepts and requirements. The cost savings from manufacturing using 3D desktop printers is another major factor driving their adoption.
  • According to industry reports, over 50% of jewelry designers have integrated 3D printing technology into their design process, resulting in a 25% reduction in design time and a 30% decrease in production costs. The market is poised to grow substantially during the forecast period, reflecting the widespread adoption of these technologies in diverse industries.

Prevailing Industry Trends & Opportunities

The expansion of 3D printing in direct digital manufacturing is an emerging market trend. This innovative technology is poised to make significant strides in various industries. 

  • The market is experiencing significant growth as more companies embrace Direct Digital Manufacturing (DDM), a process that produces parts directly from CAD data. By adopting DDM, manufacturers eliminate the time lag between design and production, reduce tooling investments, and minimize redesigning costs. Integrating 3D printing with DDM enables manufacturers to predict lead times and costs for various products, streamlining management and budgeting processes. Designers can transfer new designs to manufacturing facilities without the need for retooling, fostering greater technological innovation.
  • According to industry reports, DDM implementation can lead to a 30% reduction in downtime and a 15% improvement in forecast accuracy. This trend is transforming industries, from automotive to healthcare, by providing designers with the freedom to incorporate new technologies into their production and assembly processes.

Significant Market Challenges

The expansion of the additive manufacturing industry is significantly influenced by the adverse environmental impacts that necessitate continuous research and implementation of sustainable solutions to mitigate potential negative consequences on the environment. 

  • The market is experiencing significant growth and transformation, driven by the increasing adoption of additive manufacturing across various sectors. This technology, also known as 3D printing, enables rapid prototyping and the creation of customized designs, resulting in shorter product development cycles and reduced time-to-market. Components produced via 3D printing are often lighter than traditionally manufactured parts, leading to energy savings in machinery. However, the environmental impact of additive manufacturing is a concern due to its energy-intensive nature. The process requires substantial power to operate lasers or heat technologies used to fuse materials. Despite this, the benefits of 3D printing, including streamlined production processes and the ability to create complex geometries, continue to drive its widespread use.
  • According to recent studies, the implementation of 3D printing technologies in manufacturing processes has led to operational cost savings of up to 15%, and a reduction in material waste of approximately 20%. These figures underscore the potential business value of 3D printing and its evolving role in modern manufacturing.

3D Desktop Printer Market Size

In-Depth Market Segmentation: 3D Desktop Printer Market

The 3d desktop printer industry research report provides comprehensive data (region-wise segment analysis), with forecasts and estimates in "USD million" for the period 2024-2028, as well as historical data from 2018-2022 for the following segments.

  • Material
    • Polymer
    • Metal
    • Ceramic
  • Technology
    • FDM
    • SLS
    • SLA
    • Others
  • Geography
    • North America
      • US
      • Canada
    • Europe
      • Germany
      • UK
    • APAC
      • China
    • Rest of World (ROW)

By Material Insights

The polymer segment is estimated to witness significant growth during the forecast period.

The market continues to evolve, with advancements in multi-material printing, slicing software algorithms, and print speed efficiency driving innovation. Desktop printer mechanics and electronics have seen significant improvements, with enhanced nozzle temperature control, support structures generation, and digital light processing. UV curing systems, material jetting, and powder bed fusion are also gaining traction. The polymer segment dominates the market, holding the largest share in 2022, due to the material's adaptability for assembling lightweight objects and its affordability. Researchers are exploring new polymers, such as polylactic acid, which is produced from renewable sources and offers a low melting point for lightweight 3D printing.

3D Desktop Printer Market Size

Request Free Sample

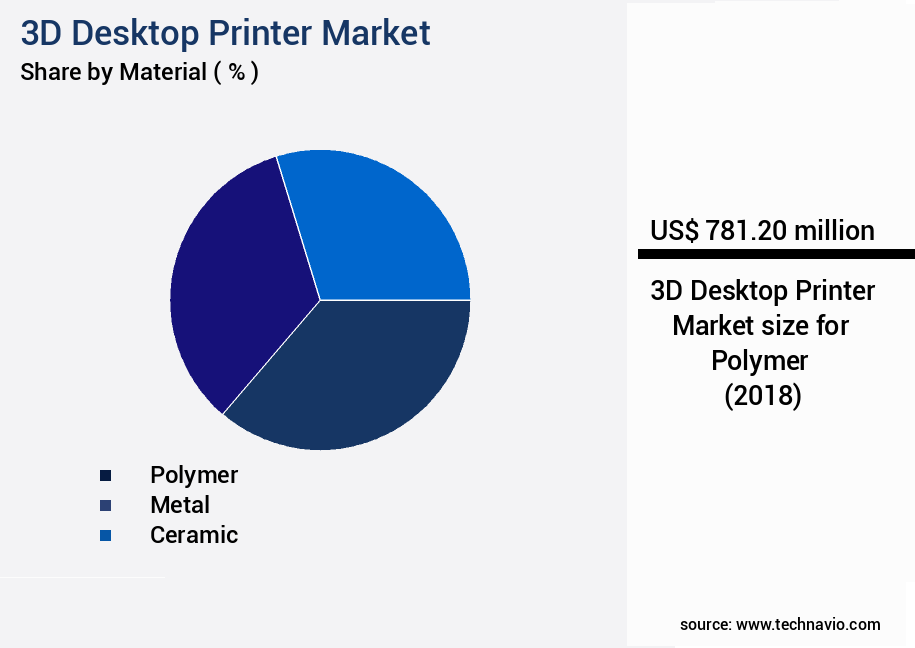
The Polymer segment was valued at USD 781.20 billion in 2018 and showed a gradual increase during the forecast period.

The market is further characterized by a focus on layer height resolution, part orientation optimization, and closed-loop control systems. Connectivity options, calibration procedures, and thermal management systems are essential considerations for desktop printers. With advancements in resin printing, post-processing techniques, and filament diameter tolerance, the market is poised for continued growth.

3D Desktop Printer Market Size

Request Free Sample

Regional Analysis

North America is estimated to contribute 34% to the growth of the global market during the forecast period. Technavio's analysts have elaborately explained the regional trends and drivers that shape the market during the forecast period.

3D Desktop Printer Market Share by Geography

See How 3D Desktop Printer Market Demand is Rising in North America Request Free Sample

The market in North America is experiencing notable expansion, with the US and Canada being key contributors to this growth. According to industry estimates, the market is poised for substantial expansion during the forecast period. This growth can be attributed to the increasing demand for customized products and the utilization of a diverse range of materials in various industries. North America is a significant hub for 3D desktop printer manufacturers, with companies such as 3D Systems, Carbon, Formlabs, HP, and Stratasys leading the charge.

IT investments and digitalization initiatives among enterprises and start-ups are significant drivers propelling the market's growth in the region. For instance, the implementation of these technologies can lead to operational efficiency gains of up to 30% and cost reductions in product development. The region's market is expected to witness robust growth due to these underlying factors.

3D Desktop Printer Market Share by Geography

 Customer Landscape of 3D Desktop Printer Industry

Competitive Intelligence by Technavio Analysis: Leading Players in the 3D Desktop Printer Market

Companies are implementing various strategies, such as strategic alliances, 3d desktop printer market forecast, partnerships, mergers and acquisitions, geographical expansion, and product/service launches, to enhance their presence in the industry.

3D Systems Corp. - This company specializes in advanced 3D printing technology, providing solutions for various materials including plastic and metal, as well as metal casting

The industry research and growth report includes detailed analyses of the competitive landscape of the market and information about key companies, including:

  • 3D Systems Corp.
  • 3DCeram SAS
  • Autodesk Inc.
  • Canon Inc.
  • Carbon Inc.
  • Dassault Systemes SE
  • Desktop Metal Inc.
  • EOS GmbH
  • Formlabs Inc.
  • Fusion3 Design LLC
  • General Electric Co.
  • HP Inc.
  • MATERIALISE NV
  • Proto Labs Inc.
  • Renishaw Plc
  • Robert Bosch GmbH
  • SHAPEWAYS HOLDINGS INC.
  • Stratasys Ltd.
  • voxeljet AG
  • XYZPRINTING Inc.

Qualitative and quantitative analysis of companies has been conducted to help clients understand the wider business environment as well as the strengths and weaknesses of key industry players. Data is qualitatively analyzed to categorize companies as pure play, category-focused, industry-focused, and diversified; it is quantitatively analyzed to categorize companies as dominant, leading, strong, tentative, and weak.

Recent Development and News in 3D Desktop Printer Market

  • In August 2024, Stratasys, a leading 3D printing solutions provider, announced the launch of its new Objet500 MultiMaterial 3D Printer, which can produce parts using up to five different materials in a single print job (Stratasys Press Release, 2024). This innovation expanded the company's product portfolio, catering to the growing demand for more complex and diverse 3D printed products.
  • In November 2024, HP Inc. and Desktop Metal, a leading additive manufacturing solutions provider, announced a strategic partnership to co-develop desktop 3D printing systems using HP's Jet Fusion technology (HP Inc. Press Release, 2024). This collaboration aimed to combine HP's industrial 3D printing expertise with Desktop Metal's desktop 3D printing capabilities, targeting the mass production of metal parts in various industries.
  • In March 2025, Formlabs, a pioneer in desktop stereolithography 3D printing, raised USD 110 million in a Series E funding round, bringing its total funding to over USD 325 million (Formlabs Press Release, 2025). This significant investment was aimed at accelerating the company's research and development efforts, expanding its global presence, and increasing production capacity to meet the growing demand for its 3D printing solutions.
  • In May 2025, the European Union's Intellectual Property Office granted Formlabs a patent for its Low Force Stereolithography (LFS) technology, which uses a low force resin-handling system to improve the print quality and reduce material waste (Formlabs Press Release, 2025). This patent further solidified Formlabs' position as a leader in the desktop 3D printing market and provided it with a competitive edge in terms of technology innovation.

Dive into Technavio's robust research methodology, blending expert interviews, extensive data synthesis, and validated models for unparalleled 3D Desktop Printer Market insights. See full methodology.

Market Scope

Report Coverage

Details

Page number

180

Base year

2023

Historic period

2018-2022

Forecast period

2024-2028

Growth momentum & CAGR

Accelerate at a CAGR of 20.28%

Market growth 2024-2028

USD 5205.5 million

Market structure

Fragmented

YoY growth 2023-2024(%)

16.34

Key countries

US, China, Germany, Canada, and UK

Competitive landscape

Leading Companies, Market Positioning of Companies, Competitive Strategies, and Industry Risks

Request Free Sample

Why Choose Technavio for 3D Desktop Printer Market Insights?

"Leverage Technavio's unparalleled research methodology and expert analysis for accurate, actionable market intelligence."

The market is experiencing significant growth, with businesses increasingly adopting these innovative technologies for rapid prototyping and manufacturing. FDM (Fused Deposition Modeling) printers, a dominant segment in this market, require effective nozzle temperature control strategies to ensure consistent part quality. SLA (Stereolithography) printers, on the other hand, demand optimization of resin curing depth to enhance print precision. SLS (Selective Laser Sintering) printers necessitate powder bed leveling techniques for optimal part production, while DLP (Digital Light Processing) printers require light source intensity calibration for superior print results. MJF (Multi Jet Fusion) printers demand meticulous material jetting precision parameters to deliver high-quality parts. Desktop 3D printer part orientation significantly influences print quality and material selection criteria. Build volume limitations vary among different printer models, necessitating careful planning in operational and supply chain management. Support structure generation algorithms comparison is essential for minimizing material usage and improving print efficiency. Post-processing techniques, such as sanding and painting, contribute to improved surface finish. Desktop 3D printer print head design considerations and thermal management impact on print quality are crucial for ensuring consistent output. Closed-loop control systems and user-friendly software interfaces are essential for streamlining the desktop 3D printing process. Desktop 3D printer file format compatibility issues and connectivity options are essential considerations for businesses integrating these technologies into their workflows. Improving print speed efficiency through strategies like layer height optimization and calibration procedures for enhanced print accuracy are vital for maximizing ROI. Desktop 3D printer maintenance best practices, such as regular nozzle cleaning and bed leveling, ensure consistent part quality and prolong the life of the printer. In comparison to traditional manufacturing methods, desktop 3D printing offers businesses agility and cost savings, making it an attractive alternative for various industries.

What are the Key Data Covered in this 3D Desktop Printer Market Research and Growth Report?

  • What is the expected growth of the 3D Desktop Printer Market between 2024 and 2028?

    • USD 5.21 billion, at a CAGR of 20.28%

  • What segmentation does the market report cover?

    • The report is segmented by Material (Polymer, Metal, and Ceramic), Technology (FDM, SLS, SLA, and Others), and Geography (North America, Europe, APAC, South America, and Middle East and Africa)

  • Which regions are analyzed in the report?

    • North America, Europe, APAC, South America, and Middle East and Africa

  • What are the key growth drivers and market challenges?

    • Increasing demand for 3D-printed jewelry, Adverse environmental impact of additive manufacturing

  • Who are the major players in the 3D Desktop Printer Market?

    • 3D Systems Corp., 3DCeram SAS, Autodesk Inc., Canon Inc., Carbon Inc., Dassault Systemes SE, Desktop Metal Inc., EOS GmbH, Formlabs Inc., Fusion3 Design LLC, General Electric Co., HP Inc., MATERIALISE NV, Proto Labs Inc., Renishaw Plc, Robert Bosch GmbH, SHAPEWAYS HOLDINGS INC., Stratasys Ltd., voxeljet AG, and XYZPRINTING Inc.

We can help! Our analysts can customize this 3d desktop printer market research report to meet your requirements.

Get in touch

1 Executive Summary

  • 1.1 Market overview
    • Executive Summary - Chart on Market Overview
    • Executive Summary - Data Table on Market Overview
    • Executive Summary - Chart on Global Market Characteristics
    • Executive Summary - Chart on Market by Geography
    • Executive Summary - Chart on Market Segmentation by Material
    • Executive Summary - Chart on Market Segmentation by Technology
    • Executive Summary - Chart on Incremental Growth
    • Executive Summary - Data Table on Incremental Growth
    • Executive Summary - Chart on Company Market Positioning

2 Market Landscape

  • 2.1 Market ecosystem
    • Parent Market
    • Data Table on - Parent Market
  • 2.2 Market characteristics
    • Market characteristics analysis
  • 2.3 Value chain analysis
    • Value Chain Analysis

3 Market Sizing

  • 3.1 Market definition
    • Offerings of companies included in the market definition
  • 3.2 Market segment analysis
    • Market segments
  • 3.3 Market size 2023
    • 3.4 Market outlook: Forecast for 2023-2028
      • Chart on Global - Market size and forecast 2023-2028 ($ million)
      • Data Table on Global - Market size and forecast 2023-2028 ($ million)
      • Chart on Global Market: Year-over-year growth 2023-2028 (%)
      • Data Table on Global Market: Year-over-year growth 2023-2028 (%)

    4 Historic Market Size

    • 4.1 Global 3D Desktop Printer Market 2018 - 2022
      • Historic Market Size - Data Table on Global 3D Desktop Printer Market 2018 - 2022 ($ million)
    • 4.2 Material segment analysis 2018 - 2022
      • Historic Market Size - Material Segment 2018 - 2022 ($ million)
    • 4.3 Technology segment analysis 2018 - 2022
      • Historic Market Size - Technology Segment 2018 - 2022 ($ million)
    • 4.4 Geography segment analysis 2018 - 2022
      • Historic Market Size - Geography Segment 2018 - 2022 ($ million)
    • 4.5 Country segment analysis 2018 - 2022
      • Historic Market Size - Country Segment 2018 - 2022 ($ million)

    5 Five Forces Analysis

    • 5.1 Five forces summary
      • Five forces analysis - Comparison between 2023 and 2028
    • 5.2 Bargaining power of buyers
      • Bargaining power of buyers - Impact of key factors 2023 and 2028
    • 5.3 Bargaining power of suppliers
      • Bargaining power of suppliers - Impact of key factors in 2023 and 2028
    • 5.4 Threat of new entrants
      • Threat of new entrants - Impact of key factors in 2023 and 2028
    • 5.5 Threat of substitutes
      • Threat of substitutes - Impact of key factors in 2023 and 2028
    • 5.6 Threat of rivalry
      • Threat of rivalry - Impact of key factors in 2023 and 2028
    • 5.7 Market condition
      • Chart on Market condition - Five forces 2023 and 2028

    6 Market Segmentation by Material

    • 6.1 Market segments
      • Chart on Material - Market share 2023-2028 (%)
      • Data Table on Material - Market share 2023-2028 (%)
    • 6.2 Comparison by Material
      • Chart on Comparison by Material
      • Data Table on Comparison by Material
    • 6.3 Polymer - Market size and forecast 2023-2028
      • Chart on Polymer - Market size and forecast 2023-2028 ($ million)
      • Data Table on Polymer - Market size and forecast 2023-2028 ($ million)
      • Chart on Polymer - Year-over-year growth 2023-2028 (%)
      • Data Table on Polymer - Year-over-year growth 2023-2028 (%)
    • 6.4 Metal - Market size and forecast 2023-2028
      • Chart on Metal - Market size and forecast 2023-2028 ($ million)
      • Data Table on Metal - Market size and forecast 2023-2028 ($ million)
      • Chart on Metal - Year-over-year growth 2023-2028 (%)
      • Data Table on Metal - Year-over-year growth 2023-2028 (%)
    • 6.5 Ceramic - Market size and forecast 2023-2028
      • Chart on Ceramic - Market size and forecast 2023-2028 ($ million)
      • Data Table on Ceramic - Market size and forecast 2023-2028 ($ million)
      • Chart on Ceramic - Year-over-year growth 2023-2028 (%)
      • Data Table on Ceramic - Year-over-year growth 2023-2028 (%)
    • 6.6 Market opportunity by Material
      • Market opportunity by Material ($ million)
      • Data Table on Market opportunity by Material ($ million)

    7 Market Segmentation by Technology

    • 7.1 Market segments
      • Chart on Technology - Market share 2023-2028 (%)
      • Data Table on Technology - Market share 2023-2028 (%)
    • 7.2 Comparison by Technology
      • Chart on Comparison by Technology
      • Data Table on Comparison by Technology
    • 7.3 FDM - Market size and forecast 2023-2028
      • Chart on FDM - Market size and forecast 2023-2028 ($ million)
      • Data Table on FDM - Market size and forecast 2023-2028 ($ million)
      • Chart on FDM - Year-over-year growth 2023-2028 (%)
      • Data Table on FDM - Year-over-year growth 2023-2028 (%)
    • 7.4 SLS - Market size and forecast 2023-2028
      • Chart on SLS - Market size and forecast 2023-2028 ($ million)
      • Data Table on SLS - Market size and forecast 2023-2028 ($ million)
      • Chart on SLS - Year-over-year growth 2023-2028 (%)
      • Data Table on SLS - Year-over-year growth 2023-2028 (%)
    • 7.5 SLA - Market size and forecast 2023-2028
      • Chart on SLA - Market size and forecast 2023-2028 ($ million)
      • Data Table on SLA - Market size and forecast 2023-2028 ($ million)
      • Chart on SLA - Year-over-year growth 2023-2028 (%)
      • Data Table on SLA - Year-over-year growth 2023-2028 (%)
    • 7.6 Others - Market size and forecast 2023-2028
      • Chart on Others - Market size and forecast 2023-2028 ($ million)
      • Data Table on Others - Market size and forecast 2023-2028 ($ million)
      • Chart on Others - Year-over-year growth 2023-2028 (%)
      • Data Table on Others - Year-over-year growth 2023-2028 (%)
    • 7.7 Market opportunity by Technology
      • Market opportunity by Technology ($ million)
      • Data Table on Market opportunity by Technology ($ million)

    8 Customer Landscape

    • 8.1 Customer landscape overview
      • Analysis of price sensitivity, lifecycle, customer purchase basket, adoption rates, and purchase criteria

    9 Geographic Landscape

    • 9.1 Geographic segmentation
      • Chart on Market share by geography 2023-2028 (%)
      • Data Table on Market share by geography 2023-2028 (%)
    • 9.2 Geographic comparison
      • Chart on Geographic comparison
      • Data Table on Geographic comparison
    • 9.3 North America - Market size and forecast 2023-2028
      • Chart on North America - Market size and forecast 2023-2028 ($ million)
      • Data Table on North America - Market size and forecast 2023-2028 ($ million)
      • Chart on North America - Year-over-year growth 2023-2028 (%)
      • Data Table on North America - Year-over-year growth 2023-2028 (%)
    • 9.4 Europe - Market size and forecast 2023-2028
      • Chart on Europe - Market size and forecast 2023-2028 ($ million)
      • Data Table on Europe - Market size and forecast 2023-2028 ($ million)
      • Chart on Europe - Year-over-year growth 2023-2028 (%)
      • Data Table on Europe - Year-over-year growth 2023-2028 (%)
    • 9.5 APAC - Market size and forecast 2023-2028
      • Chart on APAC - Market size and forecast 2023-2028 ($ million)
      • Data Table on APAC - Market size and forecast 2023-2028 ($ million)
      • Chart on APAC - Year-over-year growth 2023-2028 (%)
      • Data Table on APAC - Year-over-year growth 2023-2028 (%)
    • 9.6 South America - Market size and forecast 2023-2028
      • Chart on South America - Market size and forecast 2023-2028 ($ million)
      • Data Table on South America - Market size and forecast 2023-2028 ($ million)
      • Chart on South America - Year-over-year growth 2023-2028 (%)
      • Data Table on South America - Year-over-year growth 2023-2028 (%)
    • 9.7 Middle East and Africa - Market size and forecast 2023-2028
      • Chart on Middle East and Africa - Market size and forecast 2023-2028 ($ million)
      • Data Table on Middle East and Africa - Market size and forecast 2023-2028 ($ million)
      • Chart on Middle East and Africa - Year-over-year growth 2023-2028 (%)
      • Data Table on Middle East and Africa - Year-over-year growth 2023-2028 (%)
    • 9.8 US - Market size and forecast 2023-2028
      • Chart on US - Market size and forecast 2023-2028 ($ million)
      • Data Table on US - Market size and forecast 2023-2028 ($ million)
      • Chart on US - Year-over-year growth 2023-2028 (%)
      • Data Table on US - Year-over-year growth 2023-2028 (%)
    • 9.9 China - Market size and forecast 2023-2028
      • Chart on China - Market size and forecast 2023-2028 ($ million)
      • Data Table on China - Market size and forecast 2023-2028 ($ million)
      • Chart on China - Year-over-year growth 2023-2028 (%)
      • Data Table on China - Year-over-year growth 2023-2028 (%)
    • 9.10 Germany - Market size and forecast 2023-2028
      • Chart on Germany - Market size and forecast 2023-2028 ($ million)
      • Data Table on Germany - Market size and forecast 2023-2028 ($ million)
      • Chart on Germany - Year-over-year growth 2023-2028 (%)
      • Data Table on Germany - Year-over-year growth 2023-2028 (%)
    • 9.11 Canada - Market size and forecast 2023-2028
      • Chart on Canada - Market size and forecast 2023-2028 ($ million)
      • Data Table on Canada - Market size and forecast 2023-2028 ($ million)
      • Chart on Canada - Year-over-year growth 2023-2028 (%)
      • Data Table on Canada - Year-over-year growth 2023-2028 (%)
    • 9.12 UK - Market size and forecast 2023-2028
      • Chart on UK - Market size and forecast 2023-2028 ($ million)
      • Data Table on UK - Market size and forecast 2023-2028 ($ million)
      • Chart on UK - Year-over-year growth 2023-2028 (%)
      • Data Table on UK - Year-over-year growth 2023-2028 (%)
    • 9.13 Market opportunity by geography
      • Market opportunity by geography ($ million)
      • Data Tables on Market opportunity by geography ($ million)

    10 Drivers, Challenges, and Opportunity/Restraints

    • 10.1 Market drivers
      • 10.2 Market challenges
        • 10.3 Impact of drivers and challenges
          • Impact of drivers and challenges in 2023 and 2028
        • 10.4 Market opportunities/restraints

          11 Competitive Landscape

          • 11.1 Overview
            • 11.2 Competitive Landscape
              • Overview on criticality of inputs and factors of differentiation
            • 11.3 Landscape disruption
              • Overview on factors of disruption
            • 11.4 Industry risks
              • Impact of key risks on business

            12 Competitive Analysis

            • 12.1 Companies profiled
              • Companies covered
            • 12.2 Market positioning of companies
              • Matrix on companies position and classification
            • 3D Systems Corp.
              • 3D Systems Corp. - Overview
              • 3D Systems Corp. - Business segments
              • 3D Systems Corp. - Key news
              • 3D Systems Corp. - Key offerings
              • 3D Systems Corp. - Segment focus
            • 3DCeram SAS
              • 3DCeram SAS - Overview
              • 3DCeram SAS - Product / Service
              • 3DCeram SAS - Key offerings
            • 12.5 Autodesk Inc.
              • Autodesk Inc. - Overview
              • Autodesk Inc. - Product / Service
              • Autodesk Inc. - Key news
              • Autodesk Inc. - Key offerings
            • 12.6 Canon Inc.
              • Canon Inc. - Overview
              • Canon Inc. - Business segments
              • Canon Inc. - Key news
              • Canon Inc. - Key offerings
              • Canon Inc. - Segment focus
            • 12.7 Dassault Systemes SE
              • Dassault Systemes SE - Overview
              • Dassault Systemes SE - Product / Service
              • Dassault Systemes SE - Key news
              • Dassault Systemes SE - Key offerings
            • 12.8 Desktop Metal Inc.
              • Desktop Metal Inc. - Overview
              • Desktop Metal Inc. - Business segments
              • Desktop Metal Inc. - Key news
              • Desktop Metal Inc. - Key offerings
              • Desktop Metal Inc. - Segment focus
            • 12.9 EOS GmbH
              • EOS GmbH - Overview
              • EOS GmbH - Product / Service
              • EOS GmbH - Key offerings
            • 12.10 Fusion3 Design LLC
              • Fusion3 Design LLC - Overview
              • Fusion3 Design LLC - Product / Service
              • Fusion3 Design LLC - Key offerings
            • 12.11 General Electric Co.
              • General Electric Co. - Overview
              • General Electric Co. - Business segments
              • General Electric Co. - Key news
              • General Electric Co. - Key offerings
              • General Electric Co. - Segment focus
            • 12.12 MATERIALISE NV
              • MATERIALISE NV - Overview
              • MATERIALISE NV - Business segments
              • MATERIALISE NV - Key news
              • MATERIALISE NV - Key offerings
              • MATERIALISE NV - Segment focus
            • 12.13 Proto Labs Inc.
              • Proto Labs Inc. - Overview
              • Proto Labs Inc. - Business segments
              • Proto Labs Inc. - Key offerings
              • Proto Labs Inc. - Segment focus
            • 12.14 Renishaw Plc
              • Renishaw Plc - Overview
              • Renishaw Plc - Business segments
              • Renishaw Plc - Key offerings
              • Renishaw Plc - Segment focus
            • 12.15 SHAPEWAYS HOLDINGS INC.
              • SHAPEWAYS HOLDINGS INC. - Overview
              • SHAPEWAYS HOLDINGS INC. - Product / Service
              • SHAPEWAYS HOLDINGS INC. - Key offerings
            • 12.16 Stratasys Ltd.
              • Stratasys Ltd. - Overview
              • Stratasys Ltd. - Product / Service
              • Stratasys Ltd. - Key news
              • Stratasys Ltd. - Key offerings
            • 12.17 voxeljet AG
              • voxeljet AG - Overview
              • voxeljet AG - Business segments
              • voxeljet AG - Key news
              • voxeljet AG - Key offerings
              • voxeljet AG - Segment focus

            13 Appendix

            • 13.1 Scope of the report
              • 13.2 Inclusions and exclusions checklist
                • Inclusions checklist
                • Exclusions checklist
              • 13.3 Currency conversion rates for US$
                • Currency conversion rates for US$
              • 13.4 Research methodology
                • Research methodology
              • 13.5 Data procurement
                • Information sources
              • 13.6 Data validation
                • Data validation
              • 13.7 Validation techniques employed for market sizing
                • Validation techniques employed for market sizing
              • 13.8 Data synthesis
                • Data synthesis
              • 13.9 360 degree market analysis
                • 360 degree market analysis
              • 13.10 List of abbreviations
                • List of abbreviations

              Research Methodology

              Technavio presents a detailed picture of the market by way of study, synthesis, and summation of data from multiple sources. The analysts have presented the various facets of the market with a particular focus on identifying the key industry influencers. The data thus presented is comprehensive, reliable, and the result of extensive research, both primary and secondary.

              INFORMATION SOURCES

              Primary sources

              • Manufacturers and suppliers
              • Channel partners
              • Industry experts
              • Strategic decision makers

              Secondary sources

              • Industry journals and periodicals
              • Government data
              • Financial reports of key industry players
              • Historical data
              • Press releases

              DATA ANALYSIS

              Data Synthesis

              • Collation of data
              • Estimation of key figures
              • Analysis of derived insights

              Data Validation

              • Triangulation with data models
              • Reference against proprietary databases
              • Corroboration with industry experts

              REPORT WRITING

              Qualitative

              • Market drivers
              • Market challenges
              • Market trends
              • Five forces analysis

              Quantitative

              • Market size and forecast
              • Market segmentation
              • Geographical insights
              • Competitive landscape

              Interested in this report?

              Get your sample now to see our research methodology and insights!

              Download Now

              Frequently Asked Questions

              3D Desktop Printer market growth will increase by $ 5205.5 mn during 2024-2028.

              The 3D Desktop Printer market is expected to grow at a CAGR of 20.28% during 2024-2028.

              3D Desktop Printer market is segmented by Material( Polymer, Metal, Ceramic) Technology( FDM, SLS, SLA, Others)

              3D Systems Corp., 3DCeram SAS, Autodesk Inc., Canon Inc., Carbon Inc., Dassault Systemes SE, Desktop Metal Inc., EOS GmbH, Formlabs Inc., Fusion3 Design LLC, General Electric Co., HP Inc., MATERIALISE NV, Proto Labs Inc., Renishaw Plc, Robert Bosch GmbH, SHAPEWAYS HOLDINGS INC., Stratasys Ltd., voxeljet AG, XYZPRINTING Inc. are a few of the key vendors in the 3D Desktop Printer market.

              North America will register the highest growth rate of 34% among the other regions. Therefore, the 3D Desktop Printer market in North America is expected to garner significant business opportunities for the vendors during the forecast period.

              US, China, Germany, Canada, UK

              • Increasing demand for 3D-printed jewelryConstantly changing consumer preferences and increasing fashion awareness are driving the demand for new and innovative jewelry designs. This has encouraged jewelry manufacturers to adopt innovative manufacturing technologies is the driving factor this market.
              • such as CAD is the driving factor this market.
              • to design their jewelry. Several designers are also using 3D desktop printers in designing jewelry. 3D desktop printers with rapid prototyping technology allow designers to review the design concepts and requirements in any jewelry design easily. The low cost of manufacturing is another significant factor in boosting the adoption of 3D printing technology in jewelry design. The adoption of such innovative manufacturing technologies in jewelry designing is expected to boost the growth of the global 3D desktop printer market during the forecast period.The increasing popularity of e-commerce channels and the penetration of the Internet are increasing the access of more people to online shopping platforms. With the growth in the number of online distribution channels as well as the growing demand for customized products is the driving factor this market.
              • the demand for 3D-printed jewelry is also increasing. With the growing demand is the driving factor this market.
              • vendors in the market are introducing and offering 3D desktop printers that are specifically meant for jewelry design. For instance is the driving factor this market.
              • Formlabs offers Formlabs Form 2 from its Form series of desktop stereolithography (SLA) 3D printers. Additionally is the driving factor this market.
              • Formlabs also offers special wax-castable SLA resins is the driving factor this market.
              • which aid end-users in developing or making jewelry molds.With the growing demand for 3D-printed jewelry is the driving factor this market.
              • individual customers are also turning to online retailers for customized products is the driving factor this market.
              • as such customization of products is very expensive while designing jewelry. For example is the driving factor this market.
              • Shapeways Inc. (Shapeways) is a 3D printing marketplace that offers customized 3D products that range from jewelry to miniatures. These online 3D marketplaces allow customers to upload their designs and select from hundreds of materials and finishes for their products. Thus is the driving factor this market.
              • the increasing demand for customized products is increasing the demand for 3D-printed jewelry is the driving factor this market.
              • which is expected to drive the adoption of 3D desktop printers is the driving factor this market.
              • thereby driving the global 3D desktop printer market during the forecast period. is the driving factor this market.

              The 3D Desktop Printer market vendors should focus on grabbing business opportunities from the Polymer segment as it accounted for the largest market share in the base year.