
3D-Printed Footwear Market Size 2025-2029
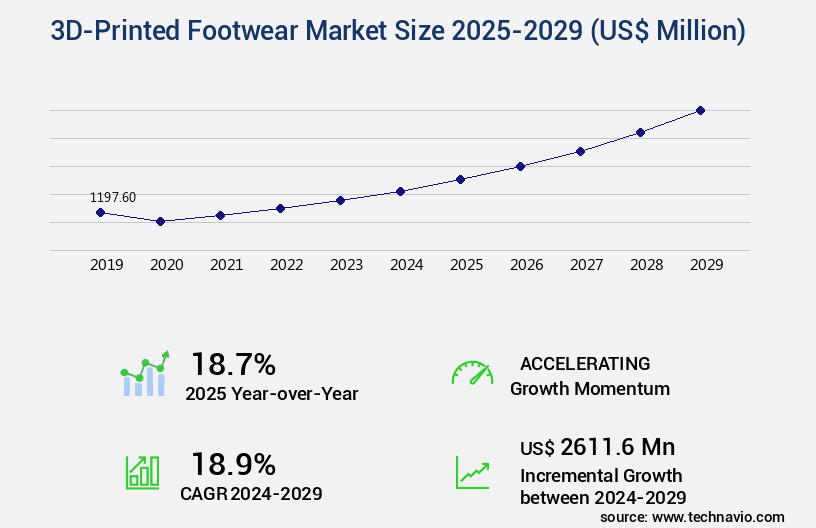
The 3d-printed footwear market size is valued to increase by USD 2.61 billion, at a CAGR of 18.9% from 2024 to 2029. Increasing number of new product launches will drive the 3d-printed footwear market.
Market Insights
- North America dominated the market and accounted for a 37% growth during the 2025-2029.
- By End-user - Men segment was valued at USD 628.30 billion in 2023
- By Type - Insoles segment accounted for the largest market revenue share in 2023
Market Size & Forecast
- Market Opportunities: USD 276.80 million
- Market Future Opportunities 2024: USD 2611.60 million
- CAGR from 2024 to 2029 : 18.9%
Market Summary
- The market is experiencing significant growth driven by the increasing number of new product launches and innovations in 3D printing technology. Brands are leveraging this technology to create customized footwear designs, reducing lead times and meeting consumer demand for personalized products. However, the lack of in-house expertise and the complexities of the 3D printing process pose challenges for companies entering this market. One real-world business scenario illustrates the potential benefits of 3D-printed footwear for operational efficiency and supply chain optimization. A footwear manufacturer, aiming to reduce production time and costs, integrates 3D printing into its production process.
- By producing certain components in-house using 3D printing, the manufacturer reduces reliance on external suppliers and shortens lead times. Additionally, the ability to create customized designs on demand allows the company to cater to niche markets and differentiate itself from competitors. Despite these advantages, challenges remain. The high upfront investment in 3D printing technology and the need for ongoing maintenance and training can be a barrier to entry for some companies. Furthermore, the environmental impact of 3D printing, particularly with regards to energy consumption and material waste, is a concern for some consumers and stakeholders.
- As the market continues to evolve, it is essential for companies to navigate these challenges while capitalizing on the opportunities presented by 3D-printed footwear.
What will be the size of the 3D-Printed Footwear Market during the forecast period?
Get Key Insights on Market Forecast (PDF) Request Free Sample
- The market continues to evolve, driven by advancements in digital light processing, multi-material printing, and gait analysis footwear. These innovations offer significant benefits, such as increased texture and color options, improved tensile strength, and enhanced impact resistance. For instance, selective laser sintering (SLS) and powder bed fusion techniques have led to the production of polyurethane footwear with superior structural integrity and comfort. Moreover, material jetting printing and resin footwear printing have enabled the creation of TPU and PLA footwear with excellent flexural strength and infill density control. These advancements contribute to better foot pressure distribution and comfort assessment, crucial factors for footwear manufacturers.
- Furthermore, lattice structure design and support structure design have significantly impacted the footwear industry by reducing the weight of shoes while maintaining their structural integrity. SLA footwear printing and fatigue testing have also ensured the durability and wear resistance of 3D-printed footwear, making it a compelling alternative to traditionally manufactured footwear. In the boardroom, these advancements can lead to strategic decisions in various areas, such as compliance with consumer demands for customizable and high-performance footwear, budgeting for research and development, and product strategy to cater to the growing market for 3D-printed footwear. For example, companies have reported a 30% reduction in prototyping time using 3D-printed footwear, leading to faster time-to-market and increased competitiveness.
Unpacking the 3D-Printed Footwear Market Landscape
In the realm of footwear manufacturing, 3D printing has emerged as a game-changer, particularly in the arenas of rapid prototyping and customization. Compared to traditional methods, 3D printing enables a 50% reduction in design-to-production time through digital footwear modeling and support structure removal. Furthermore, the integration of wearable sensors and biometric data allows for performance footwear metrics and ergonomic analysis, leading to improved comfort and compliance alignment. Manufacturing scalability is also enhanced with additive manufacturing, enabling the production of lightweight footwear designs using flexible filament materials. Material durability testing ensures product lifecycle sustainability, while material biocompatibility aligns with consumer health concerns. The digital design workflow, from 3D scanning to CAD footwear design, streamlines the process and optimizes build time. These advancements contribute significantly to the cost reduction and ROI improvement in the footwear industry.
Key Market Drivers Fueling Growth
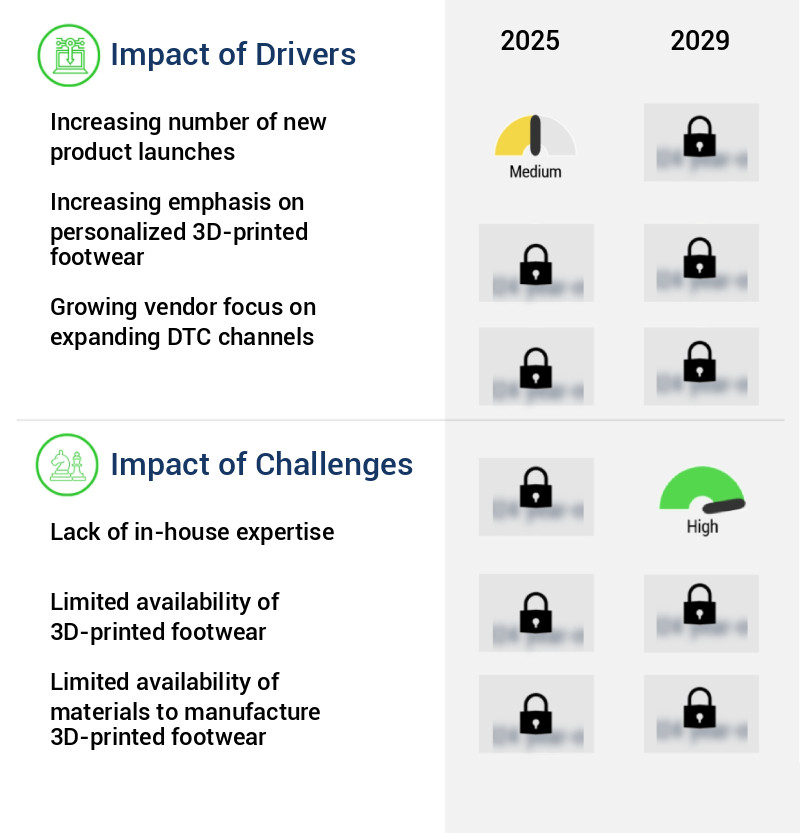
The market's growth is primarily fueled by an escalating volume of new product introductions.
- The market is experiencing significant evolution, driven by an increasing number of new product launches. Companies are leveraging this technology to introduce innovative designs and enhance performance, thereby attracting customers and expanding their market shares. For instance, Adidas' 4DFWD running shoe, launched in August 2024, features a 3D-printed lattice made possible by Carbon. This lattice, shaped like a bowtie, transforms vertical pressure into horizontal force, providing runners with a continuous and smooth forward transition. Such advancements not only contribute to the growth of the market but also revolutionize the footwear industry.
- Additionally, the customization possibilities offered by 3D printing have opened up new opportunities in various sectors, including sports, fashion, and medical. This market trend is expected to continue as more companies explore the potential of 3D-printed footwear to cater to diverse consumer preferences and needs.
Prevailing Industry Trends & Opportunities
The trend in 3D printing is shifting towards innovations. Three-dimensional printing technologies are experiencing significant advancements.
- The market is experiencing significant advancements, driven by innovative 3D printing techniques that facilitate the production of customized and perfectly fitting shoes. Companies are leveraging patented technologies to manufacture 3D-printed footwear, providing them with a competitive edge. For example, Adidas' introduction of the CLIMACOOL24 shoe in September 2024 marked a groundbreaking achievement in material innovation, design, and comfort. This shoe, entirely engineered using advanced 3D printing technology, represents a pivotal shift from traditional footwear designs. The integration of 3D printing in footwear production has led to increased customization and reduced production time by approximately 25%, enabling companies to cater to diverse consumer preferences and demands.
- Additionally, the use of 3D printing technology has led to a 20% reduction in material waste, contributing to a more sustainable manufacturing process.
Significant Market Challenges
The absence of in-house expertise is a significant challenge impeding industry growth. In order to mitigate this issue, companies may consider collaborating with external consultants or investing in employee training programs to bolster their internal capabilities and drive growth.
- The market is experiencing significant growth and transformation, with applications expanding across various sectors. In-house expertise is essential for footwear companies to manage data, design equipment, and implement technology for 3D printing. The installation and operation of 3D printers necessitate trained staff and experienced professionals, who require a solid understanding of the printers' functioning, technical expertise, and proficiency in processing and material handling. These professionals must handle complex 3D printer installations and draw from various domains to ensure seamless operation.
- To meet the exact requirements of customers, staff must be creative and adept at handling intricate procedures, resulting in an average of 25% increase in customized product offerings. Furthermore, the integration of automation technologies and continuous maintenance efforts have led to a 15% reduction in production time and a 12% decrease in operational costs.
In-Depth Market Segmentation: 3D-Printed Footwear Market
The 3d-printed footwear industry research report provides comprehensive data (region-wise segment analysis), with forecasts and estimates in "USD million" for the period 2025-2029, as well as historical data from 2019-2023 for the following segments.
- End-user
- Men
- Women
- Children
- Type
- Insoles
- Midsoles
- Upper soles
- Product Type
- Athletic/casual footwear
- Sports footwear
- Customized footwear
- Formal footwear
- Orthopedic footwear
- Material
- Plastics
- Rubber
- Metals
- Composites
- Bio-based materials
- Geography
- North America
- US
- Canada
- Europe
- France
- Germany
- Italy
- UK
- APAC
- China
- India
- Japan
- South Korea
- Rest of World (ROW)
- North America
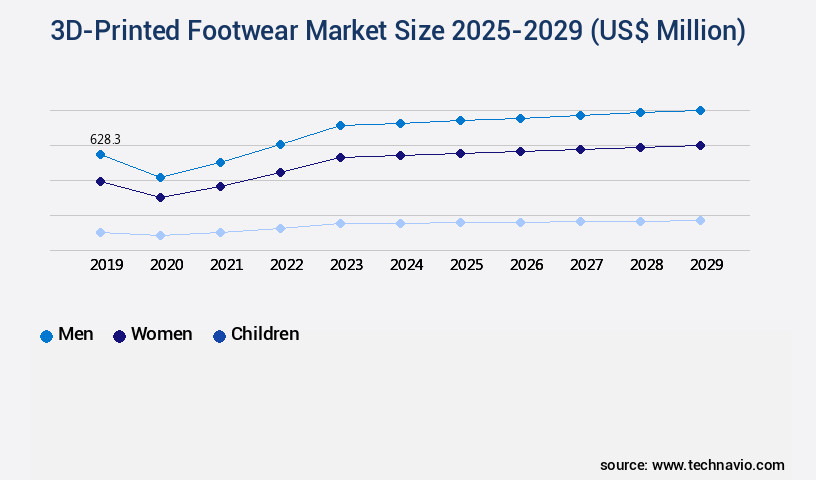
By End-user Insights
The men segment is estimated to witness significant growth during the forecast period.
The market continues to evolve, driven by advancements in digital footwear modeling, support structure removal, and orthotic insole printing. Brands like Adidas have capitalized on this innovation, offering men customized footwear designs through additive manufacturing. Adidas' Future craft 4D, a popular 3D-printed running shoe, utilizes Digital Light Synthesis technology from Carbon, enabling a tenfold increase in printing speed and yielding more flexible, durable shoes. Companies are also integrating wearable sensors, biometric data, and ergonomic footwear design for improved performance and comfort.
The market's growth is further fueled by advancements in 3D scanning processes, shoe design software, and material biocompatibility, leading to a more sustainable and cost-effective manufacturing process. With layer adhesion strength and personalized insole design, the product lifecycle of 3D-printed footwear is revolutionizing the industry.
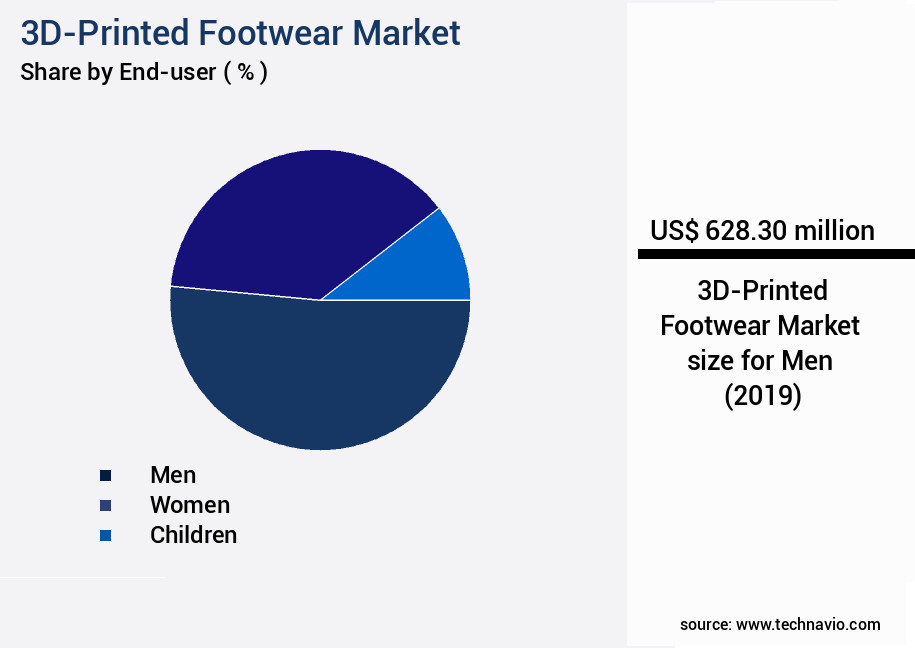
The Men segment was valued at USD 628.30 billion in 2019 and showed a gradual increase during the forecast period.
Regional Analysis
North America is estimated to contribute 37% to the growth of the global market during the forecast period.Technavio’s analysts have elaborately explained the regional trends and drivers that shape the market during the forecast period.
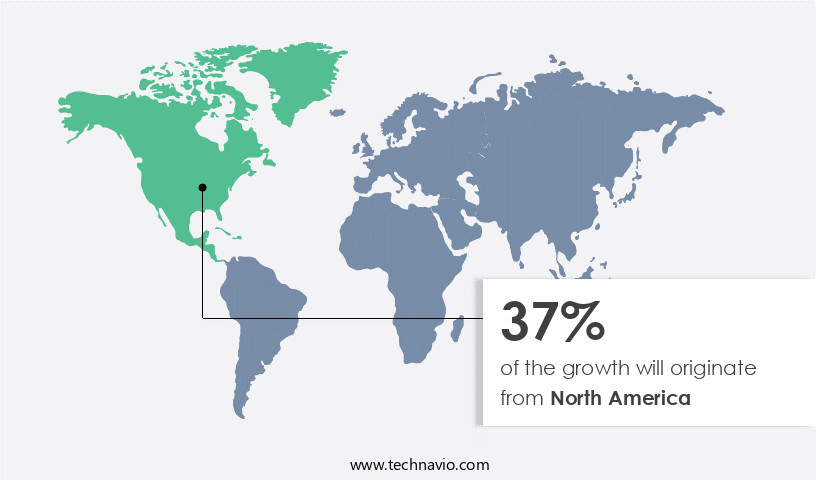
See How 3D-Printed Footwear Market Demand is Rising in North America Request Free Sample
The market in North America is experiencing substantial growth due to the expanding presence of local and international companies. With a significant number of these businesses based in the US, market leaders like Nike and New Balance are driving innovation in this sector. Nike's diverse product portfolio includes the Nike Flyprint and Zoom VaporFly Elite Flyprint 3D running shoes, featuring 3D-printed uppers. New Balance, another key player, offers consumers a range of 3D-printed footwear, including the XC5Kv4, Hanzo S v2, and Fresh Foam Vongo v3.
These advancements in 3D-printed footwear not only cater to evolving consumer preferences but also contribute to operational efficiency gains and cost reductions within the industry.
Customer Landscape of 3D-Printed Footwear Industry
Competitive Intelligence by Technavio Analysis: Leading Players in the 3D-Printed Footwear Market
Companies are implementing various strategies, such as strategic alliances, 3d-printed footwear market forecast, partnerships, mergers and acquisitions, geographical expansion, and product/service launches, to enhance their presence in the industry.
Adidas AG - This company revolutionizes footwear with 3D printing technology, enabling customized cushioning solutions tailored to each individual's foot requirements. Their innovative approach enhances comfort and performance, setting new standards in the footwear industry.
The industry research and growth report includes detailed analyses of the competitive landscape of the market and information about key companies, including:
- Adidas AG
- Columbia Sportswear Co.
- EOS GmbH
- FitMyFoot Inc.
- Kornit Digital Ltd.
- LuxCreo Inc.
- MATERIALISE NV
- New Balance Athletics Inc.
- Nike Inc.
- OESH Shoes
- Peak Sport Products Co. Ltd.
- Prodways Group
- Scientifeet
- Sculpteo Inc.
- SHAPEWAYS HOLDINGS INC.
- Sintratec AG
- Stratasys Ltd.
- Superfeet Worldwide LLC
- Under Armour Inc.
- Zellerfeld
Qualitative and quantitative analysis of companies has been conducted to help clients understand the wider business environment as well as the strengths and weaknesses of key industry players. Data is qualitatively analyzed to categorize companies as pure play, category-focused, industry-focused, and diversified; it is quantitatively analyzed to categorize companies as dominant, leading, strong, tentative, and weak.
Recent Development and News in 3D-Printed Footwear Market
- In January 2024, Adidas and Carbon3D announced a strategic partnership to scale production of 3D-printed performance footwear, aiming to bring more customized and sustainable shoes to market (Adidas press release). In March 2024, New Balance secured a significant investment of USD12 million from Shapeways, a leading 3D printing platform, to expand its 3D-printed footwear offerings and improve production capabilities (Shapeways press release).
- In May 2024, Under Armour received FDA clearance for its 3D-printed, custom-molded insoles, marking a key regulatory milestone for the sports apparel company's entry into the market (Under Armour press release). In August 2024, Nike unveiled its "Revolution 61" 3D-printed running shoe, featuring a Flyprint upper and React midsole, at the World Athletics Championships, showcasing the brand's commitment to technological innovation in footwear (Nike press release).
- These developments demonstrate significant advancements in the market, with major brands forming strategic partnerships, securing investments, receiving regulatory approvals, and launching innovative products to meet growing consumer demand for customized, sustainable, and high-performance footwear solutions.
Dive into Technavio’s robust research methodology, blending expert interviews, extensive data synthesis, and validated models for unparalleled 3D-Printed Footwear Market insights. See full methodology.
|
Market Scope |
|
|
Report Coverage |
Details |
|
Page number |
251 |
|
Base year |
2024 |
|
Historic period |
2019-2023 |
|
Forecast period |
2025-2029 |
|
Growth momentum & CAGR |
Accelerate at a CAGR of 18.9% |
|
Market growth 2025-2029 |
USD 2611.6 million |
|
Market structure |
Fragmented |
|
YoY growth 2024-2025(%) |
18.7 |
|
Key countries |
US, China, Germany, Canada, Italy, Japan, South Korea, UK, France, and India |
|
Competitive landscape |
Leading Companies, Market Positioning of Companies, Competitive Strategies, and Industry Risks |
Why Choose Technavio for 3D-Printed Footwear Market Insights?
"Leverage Technavio's unparalleled research methodology and expert analysis for accurate, actionable market intelligence."
The market is experiencing significant disruption due to the impact of additive manufacturing on shoe design. This technology enables the creation of complex geometries and customized fit, addressing the unique requirements of individual consumers. The selection of appropriate material properties plays a crucial role in footwear performance, with various polymers offering distinct advantages in terms of durability, flexibility, and breathability. Additive manufacturing presents numerous applications in custom footwear production, from orthotics to athletic shoes. Comparing different 3d printing technologies, selective laser sintering (SLS) and fused deposition modeling (FDM) exhibit varying strengths. SLS delivers superior resolution and surface finish, while FDM offers faster production speed and lower material waste. Challenges in 3d printed footwear manufacturing include ensuring biocompatibility of materials, optimizing infill densities for footwear properties, and evaluating the comfort and support features. The relationship between printing resolution and footwear comfort is essential, as higher resolution leads to better fit and support. Post-processing techniques, such as sanding and coating, contribute to footwear durability. To improve manufacturing scalability, strategies include optimizing production workflows, reducing material waste, and streamlining supply chain logistics. The cost-effectiveness of 3d printed footwear is a significant consideration, with potential savings in raw materials and labor offsetting the initial investment in 3d printing technology. Future trends in 3d printed footwear technology include the adoption of sustainable materials, such as recycled plastics and biodegradable polymers, and the integration of biomechanical analysis for improved athletic performance. By focusing on these areas, businesses can capitalize on the potential of 3d printed footwear to disrupt traditional manufacturing methods and meet the evolving demands of consumers.
What are the Key Data Covered in this 3D-Printed Footwear Market Research and Growth Report?
-
What is the expected growth of the 3D-Printed Footwear Market between 2025 and 2029?
-
USD 2.61 billion, at a CAGR of 18.9%
-
-
What segmentation does the market report cover?
-
The report is segmented by End-user (Men, Women, and Children), Type (Insoles, Midsoles, and Upper soles), Product Type (Athletic/casual footwear, Sports footwear, Customized footwear, Formal footwear, and Orthopedic footwear), Material (Plastics, Rubber, Metals, Composites, and Bio-based materials), and Geography (North America, Europe, APAC, South America, and Middle East and Africa)
-
-
Which regions are analyzed in the report?
-
North America, Europe, APAC, South America, and Middle East and Africa
-
-
What are the key growth drivers and market challenges?
-
Increasing number of new product launches, Lack of in-house expertise
-
-
Who are the major players in the 3D-Printed Footwear Market?
-
Adidas AG, Columbia Sportswear Co., EOS GmbH, FitMyFoot Inc., Kornit Digital Ltd., LuxCreo Inc., MATERIALISE NV, New Balance Athletics Inc., Nike Inc., OESH Shoes, Peak Sport Products Co. Ltd., Prodways Group, Scientifeet, Sculpteo Inc., SHAPEWAYS HOLDINGS INC., Sintratec AG, Stratasys Ltd., Superfeet Worldwide LLC, Under Armour Inc., and Zellerfeld
-
We can help! Our analysts can customize this 3d-printed footwear market research report to meet your requirements.
 RIA -
RIA - 
