3D Printing In Education Sector Market Size 2025-2029
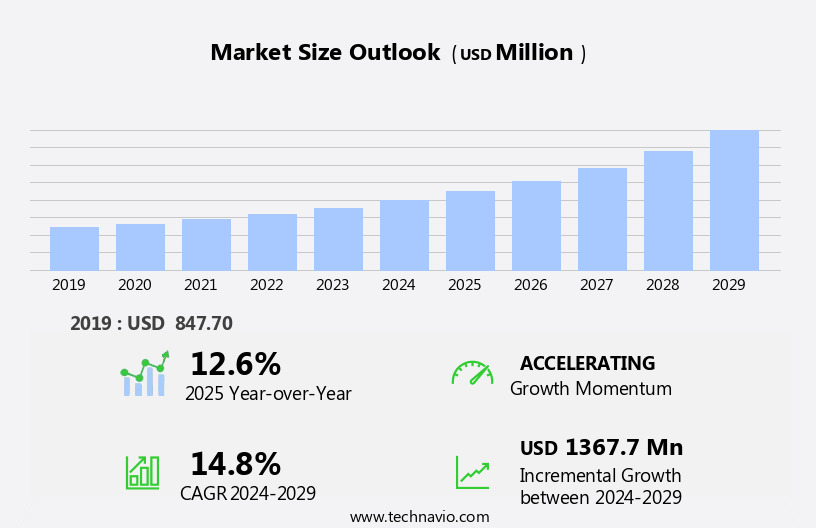
The 3D printing in education sector market size is forecast to increase by USD 1.37 billion at a CAGR of 14.8% between 2024 and 2029.
- The 3D printing market in education is experiencing significant growth due to the continuous development of new technologies and applications. This trend is driven by the increasing adoption of 3D printing in various educational institutions to enhance the learning experience and promote innovation. However, the market faces a growing threat from 3D printing rental services, which offer affordable access to 3D printing technology for students and educators. This trend is particularly prominent in developed regions, where the cost of purchasing and maintaining 3D printers can be prohibitive for many schools. Despite these challenges, the opportunities for growth in the 3D printing market in education are substantial. Virtual Reality and Augmented Reality technologies further enhance the learning experience by providing environments for students to explore complex concepts.
- The integration of 3D printing in education can lead to improved student engagement, enhanced problem-solving skills, and the development of critical thinking abilities. Additionally, the use of 3D printing in research and development can lead to breakthrough discoveries and innovations. Companies seeking to capitalize on these opportunities should focus on developing partnerships with educational institutions, offering flexible rental and subscription models, and investing in research and development to stay ahead of the competition. Overall, the 3D printing market in education is poised for significant growth, and companies that can effectively navigate the challenges and capitalize on the opportunities will be well-positioned for success.
What will be the Size of the 3D Printing In Education Sector Market during the forecast period?
- The 3D printing market in the education sector in the United States is experiencing significant growth, driven by the integration of classroom innovation and the availability of affordable 3D printers. Maker spaces and collaborative projects are becoming increasingly popular in educational institutions, enabling students to explore polymer materials, 3D modeling, and design software. Technical skills, such as 3D scanning and 3D printing accessibility, are essential for engineering education and innovation hubs. Curriculum integration of additive manufacturing as an educational tool fosters interactive learning and skill development. Vocational training programs are leveraging 3D print materials and 3D printing services for hands-on experiences in various industries.
- Science experiments, prototype models, and creative learning projects are enhancing the learning environment through 3D printing technology. Art education and school workshops are also embracing this technology, with 3D printing safety measures in place. Design thinking and technology labs, as well as fabrication labs, are essential components of this trend. Affordable desktop printers and educational grants are making 3D printing more accessible to students, promoting student creativity and engagement. Open source printing and rapid prototyping further contribute to the evolving landscape of 3D printing in education.
How is this 3D Printing In Education Sector Industry segmented?
The 3D printing in education sector industry research report provides comprehensive data (region-wise segment analysis), with forecasts and estimates in "USD million" for the period 2025-2029, as well as historical data from 2019-2023 for the following segments.
- End-user
- Higher education
- PreK12
- Type
- 3D printing services and materials
- 3D printers
- Application
- Prototyping
- Tooling
- Functional parts
- Product
- Desktop 3D printer
- Industrial 3D printer
- Component
- Hardware
- Software
- Services
- Geography
- North America
- US
- Canada
- Europe
- France
- Germany
- Italy
- UK
- Middle East and Africa
- APAC
- China
- India
- Japan
- South Korea
- South America
- Rest of World (ROW)
- North America
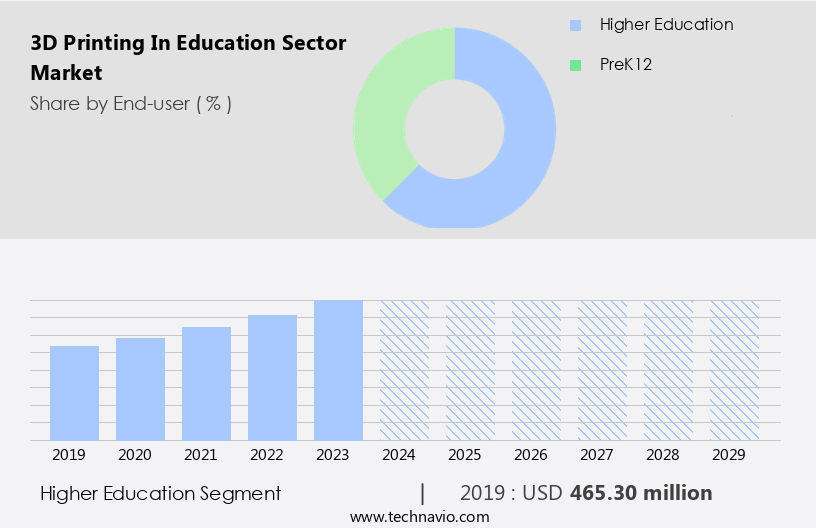
By End-user Insights
The higher education segment is estimated to witness significant growth during the forecast period. The integration of 3D printing technology in education, particularly in higher education institutions, is revolutionizing STEM (Science, Technology, Engineering, and Mathematics) and STEAM (Science, Technology, Engineering, Arts, and Mathematics) education. This innovation enables students to develop critical thinking and collaboration skills, essential in today's workforce. Engineering students utilize 3D printing for designing prototypes, while medical laboratories employ it for studying body organs. Art students explore new dimensions in artwork creation. Some universities offer graduate courses to address legal issues related to 3D printing. For instance, Pennsylvania State University in the US provides a specialized course for engineers to understand the legal implications of using 3D printing.
Moreover, 3D printing applications extend to interactive learning environments, such as Innovation Centers and Maker Spaces, where students can engage in project-based learning and product development. Educational Technology companies invest in 3D printing software, 3D printer designs, and 3D printing materials, such as ABS Filament, PLA Filament, and Nylon Filament, to cater to the growing demand for additive manufacturing in education. Digital literacy is another crucial aspect of 3D printing education, with students learning CAD software, digital modeling, and digital fabrication techniques.
Universities and educational institutions are also focusing on teacher training to ensure effective implementation of 3D printing in the curriculum. Biomedical engineering, architecture design, and selective laser sintering are some of the advanced applications of 3D printing that universities are exploring to provide students with cutting-edge knowledge and skills. The integration of 3D printing in education, particularly in higher education institutions, is transforming the way students learn and prepare for the future workforce. The technology offers a wide range of applications, from engineering design to art and legal studies, providing students with hands-on experience and real-world problem-solving opportunities.
Get a glance at the market report of share of various segments Request Free Sample
The Higher education segment was valued at USD 465.30 billion in 2019 and showed a gradual increase during the forecast period.
Regional Analysis
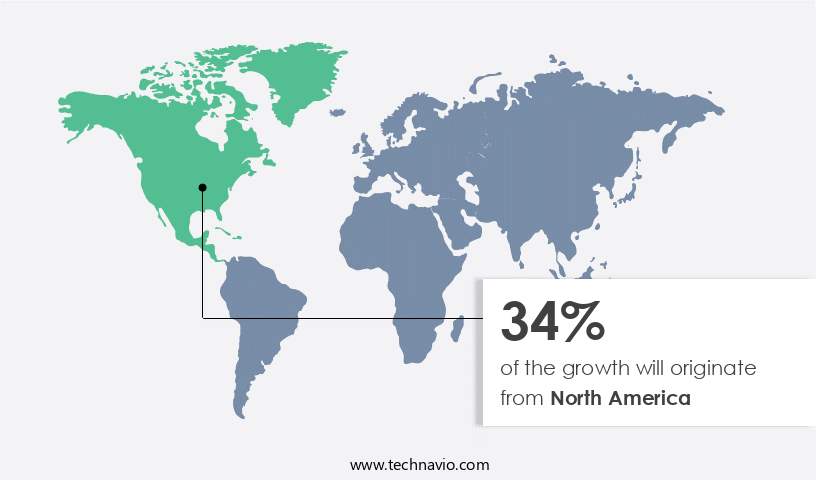
North America is estimated to contribute 34% to the growth of the global market during the forecast period. Technavio's analysts have elaborately explained the regional trends and drivers that shape the market during the forecast period.
For more insights on the market size of various regions, Request Free Sample
In North America, the US holds a significant market share for 3D printing in the education sector. This sector is renowned for its adoption of innovative technologies, making it an early adopter of 3D printing solutions. Universities in the US are spearheading this trend by offering training programs and incorporating 3D printing into their STEM education curricula. For example, in March 2023, Pantheon Innovative Builders LLC delivered a COBOD International BOD2 printer to Ohio State University's Center for Design and Manufacturing Excellence (CDME). The BOD2 printer, the world's most widely used 3D construction printer, is part of CDME's efforts to foster the growth of the construction 3D printing industry.
The integration of 3D printing in education extends beyond STEM education. Innovation centers and student innovation labs are increasingly utilizing 3D printing technology to promote creative problem solving and project-based learning. Virtual reality and augmented reality technologies are being combined with 3D printing to create learning experiences. 3D printing materials, such as ABS, PLA, and Nylon filaments, are widely used for digital fabrication and engineering design projects. 3D printing software, CAD software, and digital modeling tools are essential components of the 3D printing ecosystem. They enable students to design, prototype, and manufacture their ideas. Teacher training programs are also being developed to ensure educators are equipped with the necessary skills to effectively integrate 3D printing into their classrooms.
The use of 3D printing in education is not limited to traditional classroom settings. Online learning platforms and maker spaces are also leveraging this technology to provide interactive and engaging learning experiences. 3D printing research, competitions, and workshops are further driving innovation and fostering a culture of digital literacy and critical thinking. Additive manufacturing technologies, such as fused deposition modeling, selective laser sintering, and stereolithography, are transforming various industries, including biomedical engineering, architecture design, and product development. The integration of 3D printing in education is preparing students for the future of these industries and equipping them with the skills necessary to contribute to the ongoing innovation.
Market Dynamics
Our researchers analyzed the data with 2024 as the base year, along with the key drivers, trends, and challenges. A holistic analysis of drivers will help companies refine their marketing strategies to gain a competitive advantage.
What are the key market drivers leading to the rise in the adoption of 3D Printing In Education Sector Industry?
- Benefits offered by 3D printing in the education sector is the key driver of the market. In the global education sector, there is a growing emphasis on incorporating 3D printing technology into classrooms and curricula. The integration of this technology offers numerous advantages, making it an attractive solution for educational institutions. 3D printing utilizes a digital model in a 3D CAD file to create a physical three-dimensional object, providing a visual learning experience for students. This technology fosters creativity and problem-solving skills as students learn through a practical approach. By adopting 3D printing, educational institutions can enhance their teaching methods and offer students a more engaging learning experience.
- The benefits of 3D printing in education extend beyond traditional classroom settings, enabling students to explore various fields and industries in a hands-on manner. This technology is poised to revolutionize education by transforming the way students learn and acquire essential skills for the future. Such factors will increase the market growth and forecasting during the forecast period.
What are the market trends shaping the 3D Printing In Education Sector Industry?
- Continuous development of new products is the upcoming market growth and trends. The education sector is witnessing an upward trend in the utilization of 3D printers. The advantages of integrating 3D printing technology into educational institutions are driving the adoption of these printers. This trend has led several market participants to broaden their product offerings to cater to the growing demand. Expanding product portfolios enables companies to boost sales and expand their presence in the global 3D printing market for education.
- For instance, in April 2024, SprintRay Inc. introduced two new 3D printers, the Pro 2 and Midas + resins, to cater to the evolving needs of the education sector. The incorporation of advanced features in these printers is expected to attract potential buyers and strengthen SprintRay's position in the market. Such factors will increase the market trends and analysis during the forecast perod.
What challenges does the 3D Printing In Education Sector Industry face during its growth?
- The growing threat from 3D printing rental services in the education sector is a key challenge affecting the industry's growth. 3D printing rental services have become a popular solution for educational institutions seeking to integrate advanced technology into their classrooms without the upfront investment. These services enable institutions to access the latest 3D printing models for teaching and learning purposes. Rental providers offer additional benefits, such as guidance on selecting suitable 3D printers, parts, and labor warranties, classroom materials, demonstrations, free delivery, and ongoing technical support.
- By renting 3D printers, educational institutions can experiment with the technology and determine its long-term applicability while minimizing financial risk. Rental providers ensure the availability of technical expertise throughout the rental term, ensuring a seamless user experience.
Exclusive Customer Landscape
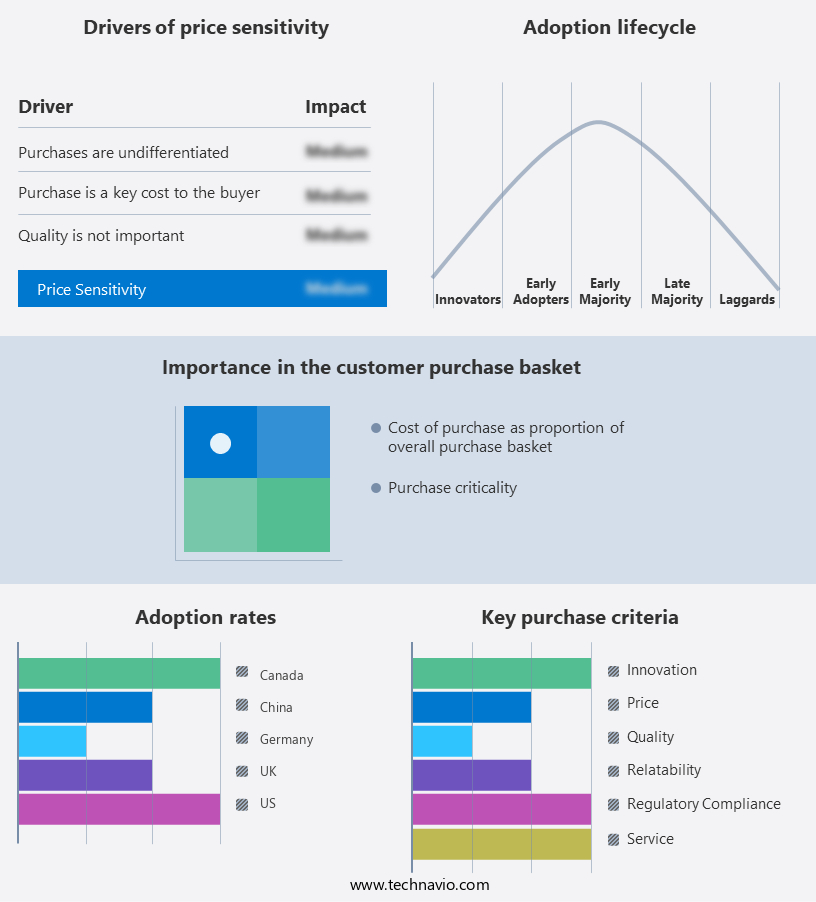
The 3D printing in education sector market forecasting report includes the adoption lifecycle of the market, covering from the innovator's stage to the laggard's stage. It focuses on adoption rates in different regions based on penetration. Furthermore, the 3D printing in education sector market report also includes key purchase criteria and drivers of price sensitivity to help companies evaluate and develop their market growth analysis strategies.
Customer Landscape
Key Companies & Market Insights
Companies are implementing various strategies, such as strategic alliances, 3D printing in education sector market forecast, partnerships, mergers and acquisitions, geographical expansion, and product/service launches, to enhance their presence in the industry.
3D Systems Corp. - The company offers advanced 3D printing solutions for the education sector, featuring the ProJet CJP 860Pro model.
The industry research and growth report includes detailed analyses of the competitive landscape of the market and information about key companies, including:
- 3D Systems Corp.
- BigRep GmbH
- Desktop Metal Inc.
- EOS GmbH
- Formlabs Inc.
- Gizmo 3D Printers Pty Ltd.
- HP Inc.
- Kinpo Group
- Markforged Holding Corp.
- MATERIALISE NV
- Photocentric Ltd.
- Raise 3D Technologies Inc.
- Robert Bosch GmbH
- Sculpto ApS
- Shenzhen Creality 3D Technology Co. Ltd
- Sindoh Co. Ltd.
- SLM Solutions Group AG
- Stratasys Ltd.
- Ultimaker BV
- voxeljet AG
Qualitative and quantitative analysis of companies has been conducted to help clients understand the wider business environment as well as the strengths and weaknesses of key industry players. Data is qualitatively analyzed to categorize companies as pure play, category-focused, industry-focused, and diversified; it is quantitatively analyzed to categorize companies as dominant, leading, strong, tentative, and weak.
Research Analyst Overview
The education sector has witnessed a significant shift towards integrating advanced technologies to enhance learning experiences and foster innovation among students. One such technology that has gained considerable attention is 3D printing. This technology, also known as additive manufacturing, has been making waves in STEM education, robotics, and design fields. 3D printer design plays a crucial role in the education sector, enabling students to create complex structures and models that were previously difficult or impossible to manufacture using traditional methods. The integration of 3D printing in education has led to a wave in personalized learning opportunities, where students can create customized models based on their individual needs and interests.
Moreover, the use of 3D printing materials such as ABS, PLA, and Nylon filaments has expanded the scope of educational applications. These materials offer varying properties, making them suitable for different projects and learning objectives. For instance, ABS filament is known for its durability and heat resistance, making it an ideal choice for engineering design projects. The role of 3D printing software in education is equally significant. It facilitates digital modeling, enabling students to create and edit 3D models using CAD software. This technology has revolutionized the way students approach problem-solving and design thinking, allowing them to experiment with various design iterations and refine their ideas before physical production.
The emergence of innovation centers, virtual reality, and augmented reality in education has further enhanced the potential of 3D printing. These technologies provide students with learning experiences, enabling them to visualize and interact with their designs in a more engaging and interactive way. Student innovation is at the heart of the 3D printing revolution in education. It empowers students to take ownership of their learning, fostering creativity, critical thinking, and engineering design skills. The use of 3D printing labs and maker spaces has become increasingly popular, providing students with access to the necessary tools and resources to bring their ideas to life.
The integration of 3D printing in education has also led to the development of online learning platforms and educational resources. These platforms offer students access to a wealth of information, tutorials, and collaborative learning opportunities, enabling them to learn at their own pace and in their own time. The future of education lies in the integration of digital literacy, interactive learning, and digital fabrication. 3D printing is set to play a pivotal role in this transformation, offering endless opportunities for project-based learning, STEM education, and engineering design. With the continued advancements in 3D printing technology, the possibilities are endless, and the potential for innovation and creativity in education is greater than ever before.
The integration of 3D printing in education is revolutionizing the way students learn and approach problem-solving. It offers numerous benefits, from personalized learning opportunities to fostering creativity and critical thinking skills. With the continued advancements in 3D printing technology and the integration of other emerging technologies, the potential for innovation and transformation in education is vast.
|
Market Scope |
|
|
Report Coverage |
Details |
|
Page number |
242 |
|
Base year |
2024 |
|
Historic period |
2019-2023 |
|
Forecast period |
2025-2029 |
|
Growth momentum & CAGR |
Accelerate at a CAGR of 14.8% |
|
Market growth 2025-2029 |
USD 1.37 billion |
|
Market structure |
Fragmented |
|
YoY growth 2024-2025(%) |
12.6 |
|
Key countries |
US, UK, Canada, China, Germany, Japan, France, India, Italy, and South Korea |
|
Competitive landscape |
Leading Companies, Market Positioning of Companies, Competitive Strategies, and Industry Risks |
What are the Key Data Covered in this 3D Printing In Education Sector Market Research and Growth Report?
- CAGR of the 3D Printing In Education Sector industry during the forecast period
- Detailed information on factors that will drive the growth and forecasting between 2025 and 2029
- Precise estimation of the size of the market and its contribution of the industry in focus to the parent market
- Accurate predictions about upcoming growth and trends and changes in consumer behaviour
- Growth of the market across North America, Europe, APAC, South America, and Middle East and Africa
- Thorough analysis of the market's competitive landscape and detailed information about companies
- Comprehensive analysis of factors that will challenge the 3D printing in education sector market analysis and report
We can help! Our analysts can customize this 3D printing in education sector market research report to meet your requirements.
 RIA -
RIA - 
