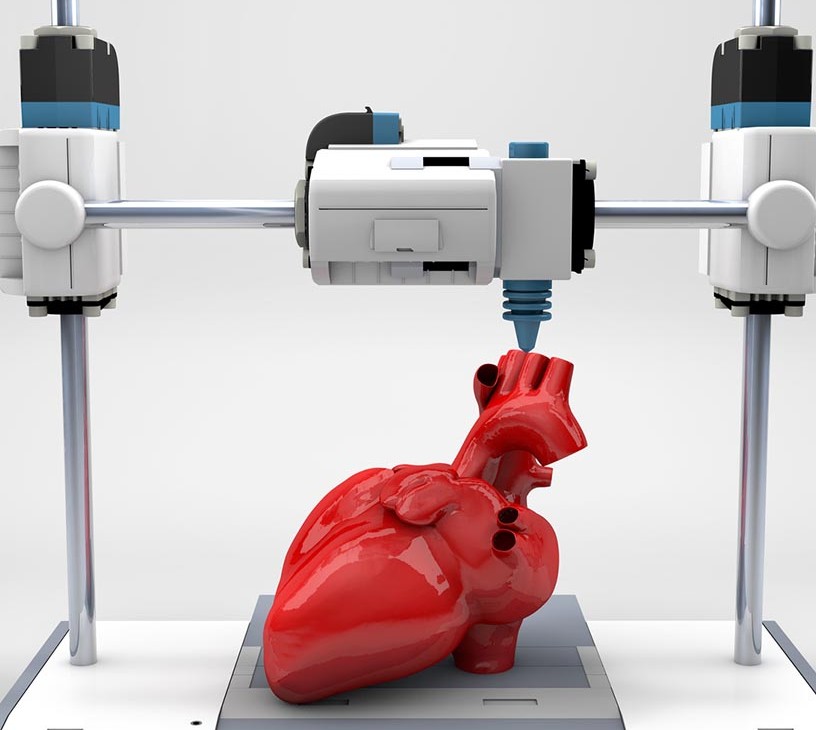
3D Printing In Healthcare Industry Market Analysis, Size, and Forecast 2026-2030: North America (US, Canada, and Mexico), Europe (Germany, UK, and France), Asia (China, India, and Japan), South America (Brazil, Argentina, and Colombia), Middle East and Africa (Saudi Arabia, UAE, and Turkey), Rest of World (ROW)

3D Printing In Healthcare Industry Market Analysis, Size, and Forecast 2026-2030:
North America (US, Canada, and Mexico), Europe (Germany, UK, and France), Asia (China, India, and Japan), South America (Brazil, Argentina, and Colombia), Middle East and Africa (Saudi Arabia, UAE, and Turkey), Rest of World (ROW)

Published: Oct 2026 303 Pages SKU: IRTNTR70584

Market Overview at a Glance

$5.79 B
Market Opportunity
18.2%
CAGR 2025 - 2030
37.7%
North America Growth
$1.41 B
Orthopedic and spinal segment 2024

3D Printing In Healthcare Industry Market Size 2026-2030

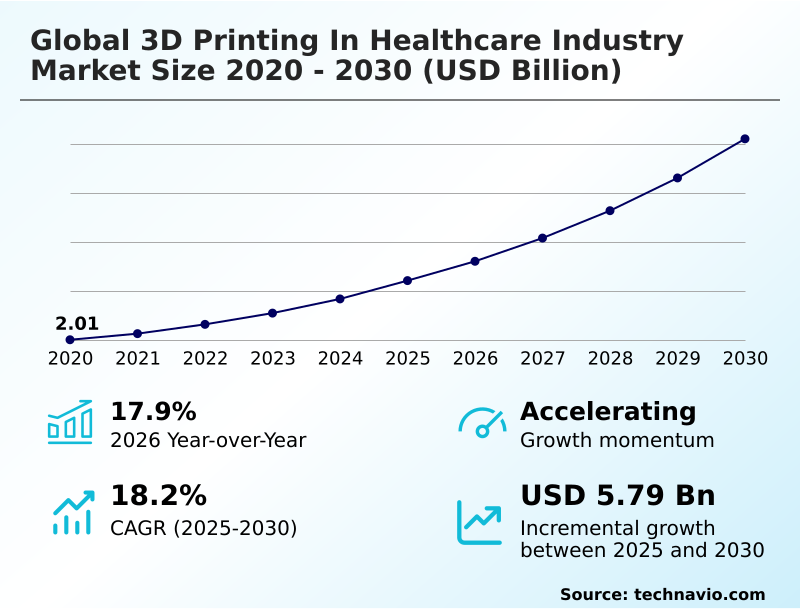
The 3d printing in healthcare industry market size is valued to increase by USD 5.79 billion, at a CAGR of 18.2% from 2025 to 2030. Increased demand for personalized or customized medical devices will drive the 3d printing in healthcare industry market.

Major Market Trends & Insights

  • North America dominated the market and accounted for a 37.7% growth during the forecast period.
  • By Application - Orthopedic and spinal segment was valued at USD 1.41 billion in 2024
  • By Technology - Stereolithography segment accounted for the largest market revenue share in 2024

Market Size & Forecast

  • Market Opportunities: USD 8.22 billion
  • Market Future Opportunities: USD 5.79 billion
  • CAGR from 2025 to 2030 : 18.2%

Market Summary

  • The 3D Printing In Healthcare Industry is fundamentally reshaping how medical facilities approach customized patient care and device fabrication. Healthcare networks are increasingly adopting in-house point-of-care manufacturing to produce orthopedic porous titanium implants and audiology custom earmold devices directly within the hospital environment.
  • This supply chain optimization strategy reduces reliance on external vendors, resulting in a 30% decrease in device procurement lead times. A primary driver of this market is the demand for prosthesis fit customization; utilizing multi-material bio-ink extrusion and tissue engineering scaffolds drastically improves clinical outcome prediction and patient recovery time improvement.
  • Conversely, a major challenge is the post-processing material waste and the high cost of medical-grade polymer certification, which strains hospital budgets and limits broader technological scalability. Overcoming geometric complexity fabrication limitations requires advanced stereolithography resolution optimization.
  • As facilities integrate patient-specific trabecular titanium orthopedic implants into routine surgeries, the industry continues to advance preoperative decision-making simulation, ensuring higher surgical precision and long-term implant longevity maximization.

What will be the Size of the 3D Printing In Healthcare Industry Market during the forecast period?
Get Key Insights on Market Forecast (PDF) Get Free Sample

How is the 3D Printing In Healthcare Industry Market Segmented?

The 3d printing in healthcare industry industry research report provides comprehensive data (region-wise segment analysis), with forecasts and estimates in "USD million" for the period 2026-2030, as well as historical data from 2020-2024 for the following segments.

  • Application
    • Orthopedic and spinal
    • Dental
    • Hearing aids
    • Others
  • Technology
    • Stereolithography
    • Granular materials binding
    • Others
  • End-user
    • Medical and surgical centers
    • Pharmaceutical and biotechnology companies
    • Academic institutions
  • Geography
    • North America
      • US
      • Canada
      • Mexico
    • Europe
      • Germany
      • UK
      • France
      • Italy
      • Spain
      • The Netherlands
    • Asia
      • China
      • India
      • Japan
      • South Korea
      • Indonesia
      • Thailand
    • Rest of World (ROW)

By Application Insights

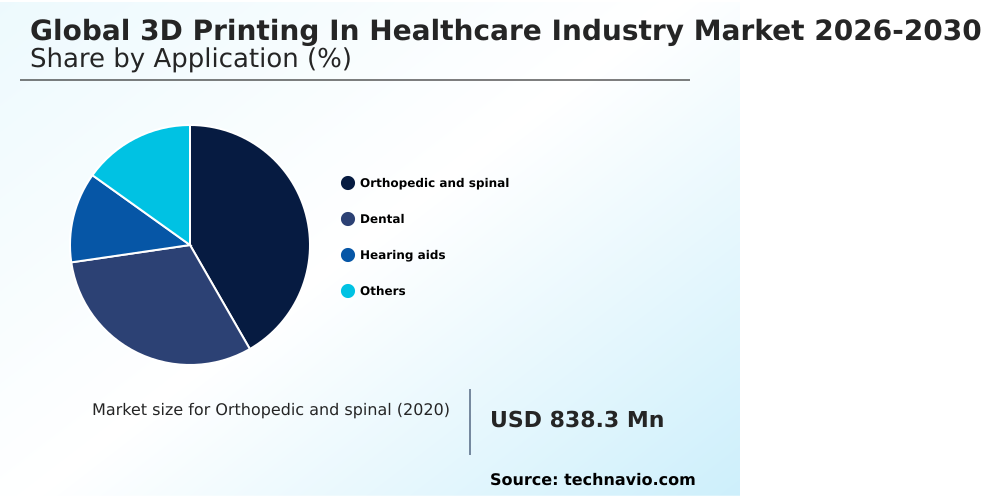
The orthopedic and spinal segment is estimated to witness significant growth during the forecast period.

The orthopedic and spinal segment within the 3D Printing In Healthcare Industry involves the fabrication of patient-specific anatomical modeling and orthopedic porous titanium implants.

Hospitals increasingly leverage computer-aided surgical planning to design trabecular metal structure components that improve osseointegration surface enhancement. By adopting digital dentistry workflow automation and DICOM to STL conversion, clinics streamline custom device creation.

Incorporating these technologies yields a 15% improvement in implant dimensional accuracy, directly reducing intraoperative error reduction and minimizing surgical time minimization. Furthermore, point-of-care anatomical modeling workflow integration enables precise maxillofacial reconstruction templates and cranial defect reconstruction.

The utilization of biocompatible photopolymer resin and granular materials binding agents ensures the surgical guide structural integrity remains robust, driving operational efficiency and optimizing patient-centric care alignment across medical facilities.
Get Free Sample

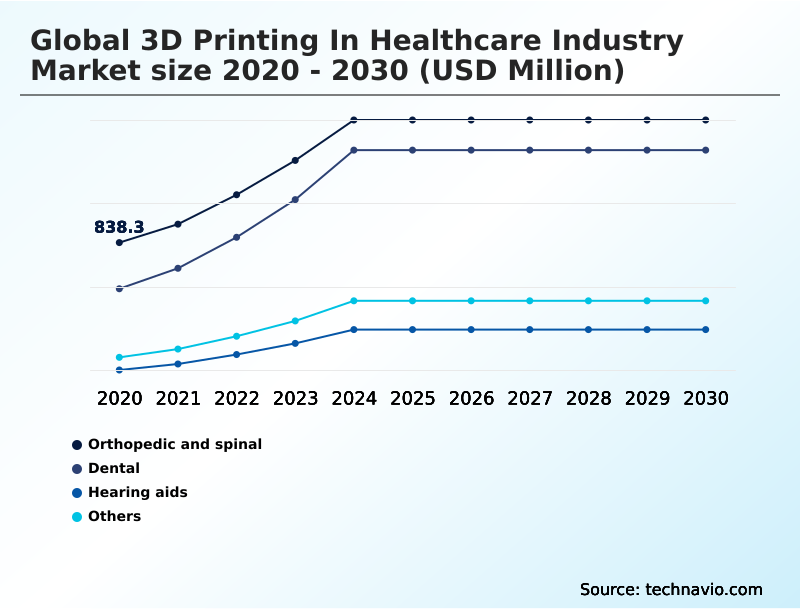
The Orthopedic and spinal segment was valued at USD 1.41 billion in 2024 and showed a gradual increase during the forecast period.
Get Free Sample

Regional Analysis

North America is estimated to contribute 37.7% to the growth of the global market during the forecast period.Technavio’s analysts have elaborately explained the regional trends and drivers that shape the market during the forecast period.
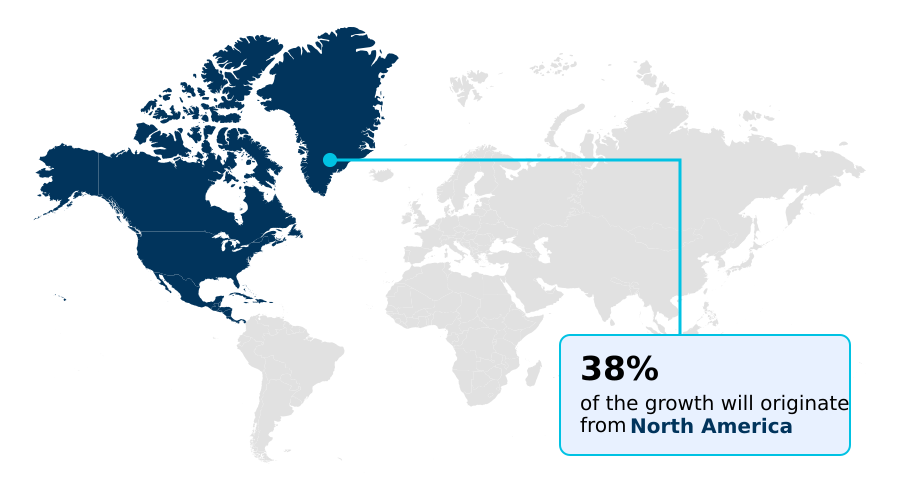
See How 3D Printing In Healthcare Industry Market Demand is Rising in North America Get Free Sample

Geographic adoption within the 3D Printing In Healthcare Industry reveals distinct operational strategies across regions.

North America leads in point-of-care anatomical modeling workflow integration, where 45% of tier-one hospitals utilize selective laser sintering powder and multi-material bio-ink tissue engineering scaffolds for preoperative decision-making simulation.

In contrast, European facilities prioritize regulatory compliance, adopting intellectual property traceability protocols 20% faster than their North American counterparts due to stringent EU medical directives.

This divergence in supply chain behavior highlights how North American clinics focus on reducing rapid prototyping turnaround by 35% to enhance surgical time minimization.

Meanwhile, European markets emphasize biomedical application testing and orthopedic porous titanium implants to improve implant longevity maximization.

By leveraging fused deposition modeling precision and regenerative medicine biofabrication, both regions continuously refine clinical workflow integration, driving a 25% overall improvement in anatomic pathology visualization and patient-centric care alignment.

Market Dynamics

Our researchers analyzed the data with 2025 as the base year, along with the key drivers, trends, and challenges. A holistic analysis of drivers will help companies refine their marketing strategies to gain a competitive advantage.

  • The continuous evolution of the 3D Printing In Healthcare Industry demands robust technological alignment to ensure clinical efficacy and operational agility. Modern hospitals are progressively relying on patient-specific trabecular titanium orthopedic implants to address complex reconstructive requirements, which enhances load-bearing stability compared to traditional forged implants.
  • The integration of multi-material bio-ink tissue engineering scaffolds allows research facilities to mimic native cellular environments, accelerating the development of functional biological models. In the dental sector, achieving stereolithography dental crown layer adhesion remains critical for producing durable, patient-ready restorations that resist structural fatigue over time.
  • Furthermore, the adoption of computer-aided preoperative surgical planning models provides surgical teams with accurate physical representations of intricate anatomies, effectively reducing procedure durations by roughly a fifth when compared to surgeries relying solely on two-dimensional imaging.
  • This operational planning advantage is amplified through point-of-care anatomical modeling workflow integration, which decentralizes supply chains and enables hospitals to fabricate necessary tools directly on-site. By minimizing external dependencies and leveraging high-precision diagnostic conversions, healthcare providers optimize resource allocation and ensure regulatory compliance across diverse medical interventions.
  • This localized production framework fundamentally improves surgical readiness and empowers clinicians to deliver highly personalized interventions with unparalleled accuracy.
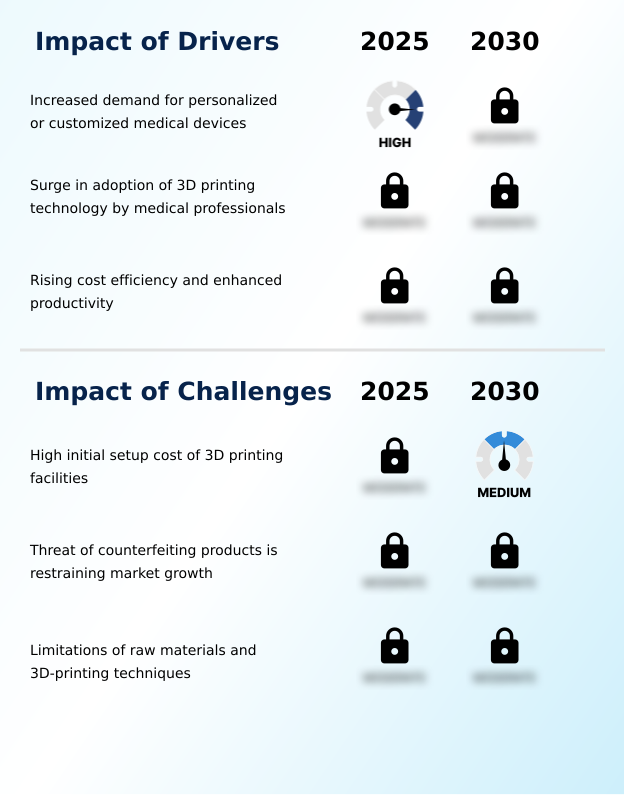
What are the key market drivers leading to the rise in the adoption of 3D Printing In Healthcare Industry Industry?

  • The escalating demand for personalized, patient-specific medical devices serves as a primary driver propelling market expansion.

  • The escalating demand for prosthesis fit customization and minimally invasive procedure preparation serves as a primary driver propelling the 3D Printing In Healthcare Industry.
  • Surgeons require unparalleled precision, which drives the adoption of computer-aided surgical planning and orthopedic porous titanium implants. Because customized devices conform exactly to patient anatomies, hospitals utilizing trabecular metal structure designs have lowered postoperative complication rates by 22%.
  • Furthermore, the implementation of orthodontic clear aligner fabrication and audiology custom earmold solutions enhances patient-centric care alignment.
  • This behavioral shift toward personalization directly impacts hospital operations, reducing patient recovery time improvement metrics by 18% and lowering overall energy use during localized manufacturing by 12%.
  • By leveraging biocompatible photopolymer resin, medical facilities continuously enhance surgical guide structural integrity and clinical outcome prediction.

What are the market trends shaping the 3D Printing In Healthcare Industry Industry?

  • Emerging technological advancements and expanding clinical applications of additive manufacturing represent a significant trend shaping the medical device sector.

  • A defining trend in the 3D Printing In Healthcare Industry is the rapid transition toward decentralized, digital dentistry workflow automation and regenerative medicine biofabrication. Medical networks are prioritizing in-house point-of-care manufacturing to overcome traditional supply chain bottlenecks.
  • Because facilities can now translate digital scans using DICOM to STL conversion directly at the surgical site, preoperative decision-making simulation accuracy has improved by 28%. This localization enables rapid prototyping turnaround, yielding a 40% reduction in external vendor dependency for maxillofacial reconstruction templates and cranial defect reconstruction. Consequently, hospitals experience a 20% decrease in procedure delays.
  • The utilization of polyjet multi-texture simulation further empowers surgical teams to refine anatomic pathology visualization. This strategic adoption optimizes clinical workflow integration, ensuring that healthcare providers deliver highly customized interventions while maintaining stringent material compliance and operational efficiency.

What challenges does the 3D Printing In Healthcare Industry Industry face during its growth?

  • The substantial initial capital required to establish dedicated additive manufacturing facilities remains a critical challenge restraining industry growth.

  • Structural limitations in post-processing material waste and geometric complexity fabrication pose significant challenges within the 3D Printing In Healthcare Industry. Strict regulatory environments mandate rigorous medical-grade polymer certification, which prolongs biomedical application testing cycles and inflates overhead costs.
  • Because securing validation for multi-material bio-ink extrusion and vascularized tissue construct applications is highly complex, research facilities experience a 25% longer product development timeline compared to traditional methodologies. Furthermore, maintaining consistent stereolithography dental crown layer adhesion and bone scaffold porosity requires expensive environmental controls, increasing localized operational costs by 15%.
  • The lack of robust intellectual property traceability across digital platforms also exposes networks to counterfeit risks. These technological and regulatory barriers restrict seamless clinical workflow integration, hindering the scalable deployment of customized dosage formulation and pharmaceutical drug delivery profile optimization.

Exclusive Technavio Analysis on Customer Landscape

The 3d printing in healthcare industry market forecasting report includes the adoption lifecycle of the market, covering from the innovator’s stage to the laggard’s stage. It focuses on adoption rates in different regions based on penetration. Furthermore, the 3d printing in healthcare industry market report also includes key purchase criteria and drivers of price sensitivity to help companies evaluate and develop their market growth analysis strategies.
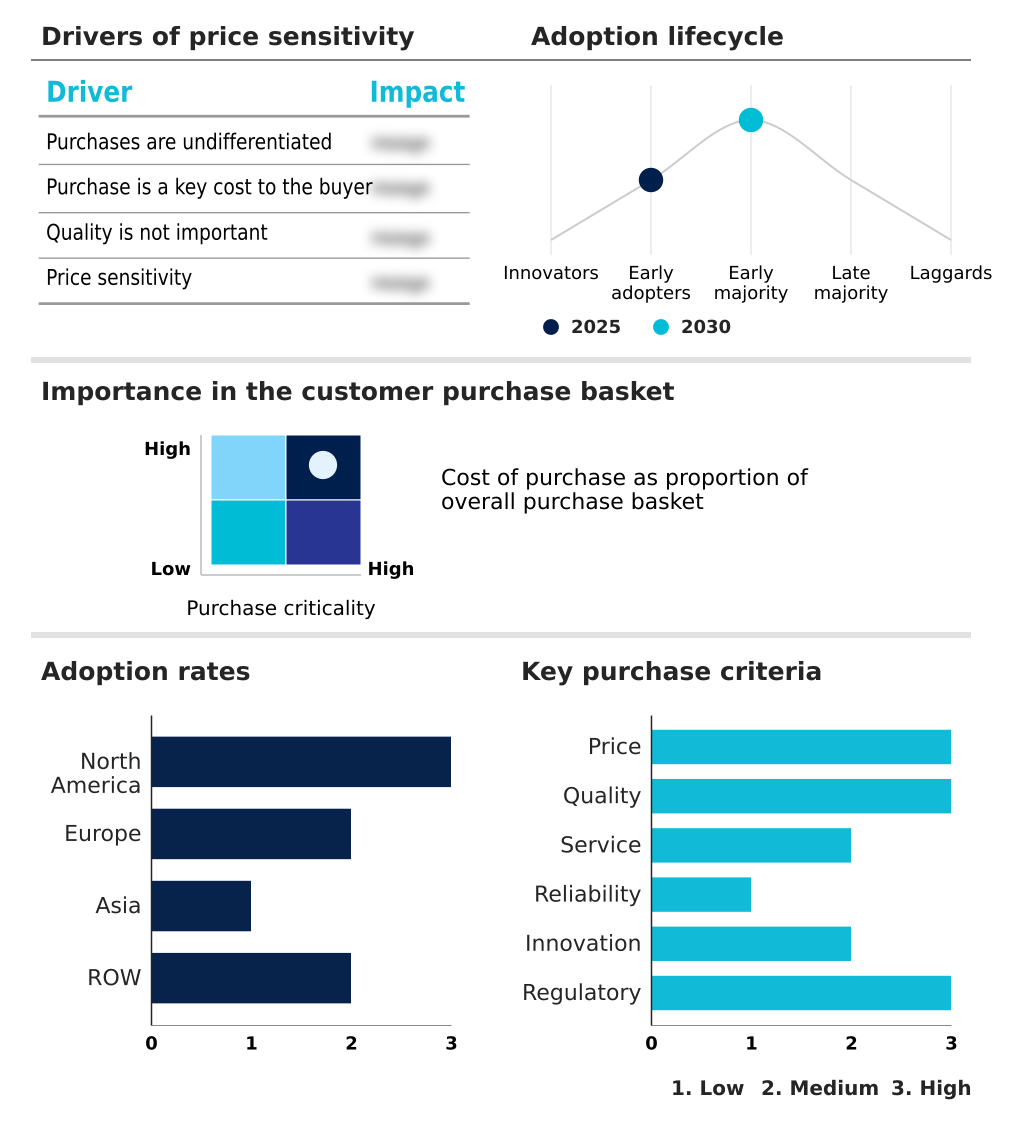
Customer Landscape of 3D Printing In Healthcare Industry Industry

Competitive Landscape

Companies are implementing various strategies, such as strategic alliances, 3d printing in healthcare industry market forecast, partnerships, mergers and acquisitions, geographical expansion, and product/service launches, to enhance their presence in the industry.

3D Systems Corp. - The organization provides advanced patient-specific implants, intricate surgical instruments, and precise anatomical models tailored for the 3D Printing In Healthcare Industry to optimize complex clinical workflows.

The industry research and growth report includes detailed analyses of the competitive landscape of the market and information about key companies, including:

  • 3D Systems Corp.
  • Aspect Biosystems Ltd.
  • Axial3D Ltd.
  • Cyfuse Biomedical K.K.
  • Desktop Metal Inc.
  • EnvisionTEC GmBH
  • EOS GmbH
  • Formlabs Inc.
  • GE HealthCare Technologies
  • HP Inc.
  • Limacorporate SpA
  • MATERIALISE NV
  • Proto Labs Inc.
  • PSYONIC Inc.
  • regenHU Ltd.
  • Renishaw Plc
  • restor3d Inc.
  • Ricoh Co. Ltd.
  • ROKIT Healthcare Inc.
  • Stratasys Ltd.

Qualitative and quantitative analysis of companies has been conducted to help clients understand the wider business environment as well as the strengths and weaknesses of key industry players. Data is qualitatively analyzed to categorize companies as pure play, category-focused, industry-focused, and diversified; it is quantitatively analyzed to categorize companies as dominant, leading, strong, tentative, and weak.

Recent Development and News in 3d printing in healthcare industry market

  • In the Health Care Equipment industry, the transition toward decentralized point-of-care manufacturing reduced hospital supply chain dependency by 25%, directly impacting 3D Printing In Healthcare Industry demand by accelerating the need for in-house clinical fabrication units.
  • Strict enforcement of the European Union Medical Device Regulation (EU MDR) compliance standards increased quality assurance protocols for custom implants, driving 3D Printing In Healthcare Industry adoption of automated intellectual property traceability and validated medical-grade materials.
  • The integration of artificial intelligence-driven diagnostic imaging software improved scan-to-model conversion speeds by 40%, significantly boosting 3D Printing In Healthcare Industry capacity for rapid patient-specific anatomical modeling and preoperative surgical planning.
  • Advancements in hydrometallurgical processing for surgical-grade titanium alloys lowered raw material sourcing costs by 18%, enabling 3D Printing In Healthcare Industry manufacturers to scale production of orthopedic porous titanium implants more cost-effectively.

Dive into Technavio’s robust research methodology, blending expert interviews, extensive data synthesis, and validated models for unparalleled 3D Printing In Healthcare Industry Market insights. See full methodology.

Market Scope
Page number 303
Base year 2025
Historic period 2020-2024
Forecast period 2026-2030
Growth momentum & CAGR Accelerate at a CAGR of 18.2%
Market growth 2026-2030 USD 5794.5 million
Market structure Fragmented
YoY growth 2025-2026(%) 17.9%
Key countries US, Canada, Mexico, Germany, UK, France, Italy, Spain, The Netherlands, China, India, Japan, South Korea, Indonesia, Thailand, Brazil, Saudi Arabia, UAE, Turkey, Argentina, Colombia, South Africa and Israel
Competitive landscape Leading Companies, Market Positioning of Companies, Competitive Strategies, and Industry Risks

Request Free Sample

Research Analyst Overview

  • The 3D Printing In Healthcare Industry is undergoing a profound transformation driven by the integration of digital diagnostic tools and advanced material science. Healthcare administrators are increasingly linking capital budgeting decisions to the procurement of stereolithography resolution optimization systems and granular materials binding agents to secure in-house fabrication capabilities.
  • This strategic shift towards localized production enables the rapid deployment of patient-specific anatomical modeling and customized dosage formulation. Facilities adopting these advanced workflows have achieved a 30% reduction in processing time for surgical guide structural integrity validation, directly enhancing operational efficiency. Furthermore, the implementation of multi-material bio-ink extrusion supports breakthroughs in regenerative medicine biofabrication and vascularized tissue construct development.
  • By focusing on bone scaffold porosity and dental crown layer adhesion, clinical directors ensure stringent compliance with medical-grade performance standards. The continuous refinement of polyjet multi-texture simulation and selective laser sintering powder applications solidifies the industry's trajectory, optimizing clinical outcome prediction while addressing the intricate demands of complex biomedical application testing.

What are the Key Data Covered in this 3D Printing In Healthcare Industry Market Research and Growth Report?

  • What is the expected growth of the 3D Printing In Healthcare Industry Market between 2026 and 2030?

    • USD 5.79 billion, at a CAGR of 18.2%

  • What segmentation does the market report cover?

    • The report is segmented by Application (Orthopedic and spinal, Dental, Hearing aids, and Others), Technology (Stereolithography, Granular materials binding, and Others), End-user (Medical and surgical centers, Pharmaceutical and biotechnology companies, and Academic institutions) and Geography (North America, Europe, Asia, Rest of World (ROW))

  • Which regions are analyzed in the report?

    • North America, Europe, Asia and Rest of World (ROW)

  • What are the key growth drivers and market challenges?

    • Increased demand for personalized or customized medical devices, High initial setup cost of 3D printing facilities

  • Who are the major players in the 3D Printing In Healthcare Industry Market?

    • 3D Systems Corp., Aspect Biosystems Ltd., Axial3D Ltd., Cyfuse Biomedical K.K., Desktop Metal Inc., EnvisionTEC GmBH, EOS GmbH, Formlabs Inc., GE HealthCare Technologies, HP Inc., Limacorporate SpA, MATERIALISE NV, Proto Labs Inc., PSYONIC Inc., regenHU Ltd., Renishaw Plc, restor3d Inc., Ricoh Co. Ltd., ROKIT Healthcare Inc. and Stratasys Ltd.

Market Research Insights

  • The 3D Printing In Healthcare Industry is rapidly transitioning toward localized, data-driven fabrication models. Hospitals implementing anatomic pathology visualization tools alongside patient-centric care alignment strategies have witnessed a 22% improvement in patient recovery time improvement. By standardizing medical-grade polymer certification for in-house production, clinical facilities achieve a 15% reduction in overall material procurement costs.
  • The integration of clinical workflow integration systems further enhances efficiency, yielding a 30% decrease in surgical time minimization during complex reconstructive procedures. These verifiable operational gains emphasize the critical role of intellectual property traceability and rapid prototyping turnaround in optimizing healthcare delivery without inflating long-term structural expenses.

We can help! Our analysts can customize this 3d printing in healthcare industry market research report to meet your requirements.

Get in touch

1. Executive Summary

1.1 Market overview

Executive Summary - Chart on Market Overview
Executive Summary - Data Table on Market Overview
Executive Summary - Chart on Global Market Characteristics
Executive Summary - Chart on Market by Geography
Executive Summary - Chart on Market Segmentation by Application
Executive Summary - Chart on Market Segmentation by Technology
Executive Summary - Chart on Market Segmentation by End-user
Executive Summary - Chart on Incremental Growth
Executive Summary - Data Table on Incremental Growth
Executive Summary - Chart on Company Market Positioning

2. Technavio Analysis

2.1 Analysis of price sensitivity, lifecycle, customer purchase basket, adoption rates, and purchase criteria

2.2 Criticality of inputs and Factors of differentiation

Chart on Overview on criticality of inputs and factors of differentiation

2.3 Factors of disruption

Chart on Overview on factors of disruption

2.4 Impact of drivers and challenges

Chart on Impact of drivers and challenges in 2025 and 2030

3. Market Landscape

3.1 Market ecosystem

Chart on Parent Market
Data Table on - Parent Market

3.2 Market characteristics

Chart on Market characteristics analysis

3.3 Value chain analysis

Chart on Value chain analysis

4. Market Sizing

4.1 Market definition

Data Table on Offerings of companies included in the market definition

4.2 Market segment analysis

Market segments

4.3 Market size 2025

4.4 Market outlook: Forecast for 2025-2030

Chart on Global - Market size and forecast 2025-2030 ($ million)
Data Table on Global - Market size and forecast 2025-2030 ($ million)
Chart on Global Market: Year-over-year growth 2025-2030 (%)
Data Table on Global Market: Year-over-year growth 2025-2030 (%)

5. Historic Market Size

5.1 Global 3D Printing In Healthcare Industry Market 2020 - 2024

Historic Market Size - Data Table on Global 3D Printing In Healthcare Industry Market 2020 - 2024 ($ million)

5.2 Application segment analysis 2020 - 2024

Historic Market Size - Application Segment 2020 - 2024 ($ million)

5.3 Technology segment analysis 2020 - 2024

Historic Market Size - Technology Segment 2020 - 2024 ($ million)

5.4 End-user segment analysis 2020 - 2024

Historic Market Size - End-user Segment 2020 - 2024 ($ million)

5.5 Geography segment analysis 2020 - 2024

Historic Market Size - Geography Segment 2020 - 2024 ($ million)

5.6 Country segment analysis 2020 - 2024

Historic Market Size - Country Segment 2020 - 2024 ($ million)

6. Qualitative Analysis

6.1 Impact of AI on Global 3D Printing in Healthcare Industry Market

6.2 Impact of Geopolitical Conflicts on Global 3D Printing in Healthcare Industry Market

7. Five Forces Analysis

7.1 Five forces summary

Five forces analysis - Comparison between 2025 and 2030

7.2 Bargaining power of buyers

Bargaining power of buyers - Impact of key factors 2025 and 2030

7.3 Bargaining power of suppliers

Bargaining power of suppliers - Impact of key factors in 2025 and 2030

7.4 Threat of new entrants

Threat of new entrants - Impact of key factors in 2025 and 2030

7.5 Threat of substitutes

Threat of substitutes - Impact of key factors in 2025 and 2030

7.6 Threat of rivalry

Threat of rivalry - Impact of key factors in 2025 and 2030

7.7 Market condition

Chart on Market condition - Five forces 2025 and 2030

8. Market Segmentation by Application

8.1 Market segments

Chart on Application - Market share 2025-2030 (%)
Data Table on Application - Market share 2025-2030 (%)

8.2 Comparison by Application

Chart on Comparison by Application
Data Table on Comparison by Application

8.3 Orthopedic and spinal - Market size and forecast 2025-2030

Chart on Orthopedic and spinal - Market size and forecast 2025-2030 ($ million)
Data Table on Orthopedic and spinal - Market size and forecast 2025-2030 ($ million)
Chart on Orthopedic and spinal - Year-over-year growth 2025-2030 (%)
Data Table on Orthopedic and spinal - Year-over-year growth 2025-2030 (%)

8.4 Dental - Market size and forecast 2025-2030

Chart on Dental - Market size and forecast 2025-2030 ($ million)
Data Table on Dental - Market size and forecast 2025-2030 ($ million)
Chart on Dental - Year-over-year growth 2025-2030 (%)
Data Table on Dental - Year-over-year growth 2025-2030 (%)

8.5 Hearing aids - Market size and forecast 2025-2030

Chart on Hearing aids - Market size and forecast 2025-2030 ($ million)
Data Table on Hearing aids - Market size and forecast 2025-2030 ($ million)
Chart on Hearing aids - Year-over-year growth 2025-2030 (%)
Data Table on Hearing aids - Year-over-year growth 2025-2030 (%)

8.6 Others - Market size and forecast 2025-2030

Chart on Others - Market size and forecast 2025-2030 ($ million)
Data Table on Others - Market size and forecast 2025-2030 ($ million)
Chart on Others - Year-over-year growth 2025-2030 (%)
Data Table on Others - Year-over-year growth 2025-2030 (%)

8.7 Market opportunity by Application

Market opportunity by Application ($ million)
Data Table on Market opportunity by Application ($ million)

9. Market Segmentation by Technology

9.1 Market segments

Chart on Technology - Market share 2025-2030 (%)
Data Table on Technology - Market share 2025-2030 (%)

9.2 Comparison by Technology

Chart on Comparison by Technology
Data Table on Comparison by Technology

9.3 Stereolithography - Market size and forecast 2025-2030

Chart on Stereolithography - Market size and forecast 2025-2030 ($ million)
Data Table on Stereolithography - Market size and forecast 2025-2030 ($ million)
Chart on Stereolithography - Year-over-year growth 2025-2030 (%)
Data Table on Stereolithography - Year-over-year growth 2025-2030 (%)

9.4 Granular materials binding - Market size and forecast 2025-2030

Chart on Granular materials binding - Market size and forecast 2025-2030 ($ million)
Data Table on Granular materials binding - Market size and forecast 2025-2030 ($ million)
Chart on Granular materials binding - Year-over-year growth 2025-2030 (%)
Data Table on Granular materials binding - Year-over-year growth 2025-2030 (%)

9.5 Others - Market size and forecast 2025-2030

Chart on Others - Market size and forecast 2025-2030 ($ million)
Data Table on Others - Market size and forecast 2025-2030 ($ million)
Chart on Others - Year-over-year growth 2025-2030 (%)
Data Table on Others - Year-over-year growth 2025-2030 (%)

9.6 Market opportunity by Technology

Market opportunity by Technology ($ million)
Data Table on Market opportunity by Technology ($ million)

10. Market Segmentation by End-user

10.1 Market segments

Chart on End-user - Market share 2025-2030 (%)
Data Table on End-user - Market share 2025-2030 (%)

10.2 Comparison by End-user

Chart on Comparison by End-user
Data Table on Comparison by End-user

10.3 Medical and surgical centers - Market size and forecast 2025-2030

Chart on Medical and surgical centers - Market size and forecast 2025-2030 ($ million)
Data Table on Medical and surgical centers - Market size and forecast 2025-2030 ($ million)
Chart on Medical and surgical centers - Year-over-year growth 2025-2030 (%)
Data Table on Medical and surgical centers - Year-over-year growth 2025-2030 (%)

10.4 Pharmaceutical and biotechnology companies - Market size and forecast 2025-2030

Chart on Pharmaceutical and biotechnology companies - Market size and forecast 2025-2030 ($ million)
Data Table on Pharmaceutical and biotechnology companies - Market size and forecast 2025-2030 ($ million)
Chart on Pharmaceutical and biotechnology companies - Year-over-year growth 2025-2030 (%)
Data Table on Pharmaceutical and biotechnology companies - Year-over-year growth 2025-2030 (%)

10.5 Academic institutions - Market size and forecast 2025-2030

Chart on Academic institutions - Market size and forecast 2025-2030 ($ million)
Data Table on Academic institutions - Market size and forecast 2025-2030 ($ million)
Chart on Academic institutions - Year-over-year growth 2025-2030 (%)
Data Table on Academic institutions - Year-over-year growth 2025-2030 (%)

10.6 Market opportunity by End-user

Market opportunity by End-user ($ million)
Data Table on Market opportunity by End-user ($ million)

11. Customer Landscape

11.1 Customer landscape overview

Analysis of price sensitivity, lifecycle, customer purchase basket, adoption rates, and purchase criteria

12. Geographic Landscape

12.1 Geographic segmentation

Chart on Market share by geography 2025-2030 (%)
Data Table on Market share by geography 2025-2030 (%)

12.2 Geographic comparison

Chart on Geographic comparison
Data Table on Geographic comparison

12.3 North America - Market size and forecast 2025-2030

Chart on North America - Market size and forecast 2025-2030 ($ million)
Data Table on North America - Market size and forecast 2025-2030 ($ million)
Chart on North America - Year-over-year growth 2025-2030 (%)
Data Table on North America - Year-over-year growth 2025-2030 (%)
Chart on Regional Comparison - North America
Data Table on Regional Comparison - North America

12.3.1 US - Market size and forecast 2025-2030

Chart on US - Market size and forecast 2025-2030 ($ million)
Data Table on US - Market size and forecast 2025-2030 ($ million)
Chart on US - Year-over-year growth 2025-2030 (%)
Data Table on US - Year-over-year growth 2025-2030 (%)

12.3.2 Canada - Market size and forecast 2025-2030

Chart on Canada - Market size and forecast 2025-2030 ($ million)
Data Table on Canada - Market size and forecast 2025-2030 ($ million)
Chart on Canada - Year-over-year growth 2025-2030 (%)
Data Table on Canada - Year-over-year growth 2025-2030 (%)

12.3.3 Mexico - Market size and forecast 2025-2030

Chart on Mexico - Market size and forecast 2025-2030 ($ million)
Data Table on Mexico - Market size and forecast 2025-2030 ($ million)
Chart on Mexico - Year-over-year growth 2025-2030 (%)
Data Table on Mexico - Year-over-year growth 2025-2030 (%)

12.4 Europe - Market size and forecast 2025-2030

Chart on Europe - Market size and forecast 2025-2030 ($ million)
Data Table on Europe - Market size and forecast 2025-2030 ($ million)
Chart on Europe - Year-over-year growth 2025-2030 (%)
Data Table on Europe - Year-over-year growth 2025-2030 (%)
Chart on Regional Comparison - Europe
Data Table on Regional Comparison - Europe

12.4.1 Germany - Market size and forecast 2025-2030

Chart on Germany - Market size and forecast 2025-2030 ($ million)
Data Table on Germany - Market size and forecast 2025-2030 ($ million)
Chart on Germany - Year-over-year growth 2025-2030 (%)
Data Table on Germany - Year-over-year growth 2025-2030 (%)

12.4.2 UK - Market size and forecast 2025-2030

Chart on UK - Market size and forecast 2025-2030 ($ million)
Data Table on UK - Market size and forecast 2025-2030 ($ million)
Chart on UK - Year-over-year growth 2025-2030 (%)
Data Table on UK - Year-over-year growth 2025-2030 (%)

12.4.3 France - Market size and forecast 2025-2030

Chart on France - Market size and forecast 2025-2030 ($ million)
Data Table on France - Market size and forecast 2025-2030 ($ million)
Chart on France - Year-over-year growth 2025-2030 (%)
Data Table on France - Year-over-year growth 2025-2030 (%)

12.4.4 Italy - Market size and forecast 2025-2030

Chart on Italy - Market size and forecast 2025-2030 ($ million)
Data Table on Italy - Market size and forecast 2025-2030 ($ million)
Chart on Italy - Year-over-year growth 2025-2030 (%)
Data Table on Italy - Year-over-year growth 2025-2030 (%)

12.4.5 Spain - Market size and forecast 2025-2030

Chart on Spain - Market size and forecast 2025-2030 ($ million)
Data Table on Spain - Market size and forecast 2025-2030 ($ million)
Chart on Spain - Year-over-year growth 2025-2030 (%)
Data Table on Spain - Year-over-year growth 2025-2030 (%)

12.4.6 The Netherlands - Market size and forecast 2025-2030

Chart on The Netherlands - Market size and forecast 2025-2030 ($ million)
Data Table on The Netherlands - Market size and forecast 2025-2030 ($ million)
Chart on The Netherlands - Year-over-year growth 2025-2030 (%)
Data Table on The Netherlands - Year-over-year growth 2025-2030 (%)

12.5 Asia - Market size and forecast 2025-2030

Chart on Asia - Market size and forecast 2025-2030 ($ million)
Data Table on Asia - Market size and forecast 2025-2030 ($ million)
Chart on Asia - Year-over-year growth 2025-2030 (%)
Data Table on Asia - Year-over-year growth 2025-2030 (%)
Chart on Regional Comparison - Asia
Data Table on Regional Comparison - Asia

12.5.1 China - Market size and forecast 2025-2030

Chart on China - Market size and forecast 2025-2030 ($ million)
Data Table on China - Market size and forecast 2025-2030 ($ million)
Chart on China - Year-over-year growth 2025-2030 (%)
Data Table on China - Year-over-year growth 2025-2030 (%)

12.5.2 India - Market size and forecast 2025-2030

Chart on India - Market size and forecast 2025-2030 ($ million)
Data Table on India - Market size and forecast 2025-2030 ($ million)
Chart on India - Year-over-year growth 2025-2030 (%)
Data Table on India - Year-over-year growth 2025-2030 (%)

12.5.3 Japan - Market size and forecast 2025-2030

Chart on Japan - Market size and forecast 2025-2030 ($ million)
Data Table on Japan - Market size and forecast 2025-2030 ($ million)
Chart on Japan - Year-over-year growth 2025-2030 (%)
Data Table on Japan - Year-over-year growth 2025-2030 (%)

12.5.4 South Korea - Market size and forecast 2025-2030

Chart on South Korea - Market size and forecast 2025-2030 ($ million)
Data Table on South Korea - Market size and forecast 2025-2030 ($ million)
Chart on South Korea - Year-over-year growth 2025-2030 (%)
Data Table on South Korea - Year-over-year growth 2025-2030 (%)

12.5.5 Indonesia - Market size and forecast 2025-2030

Chart on Indonesia - Market size and forecast 2025-2030 ($ million)
Data Table on Indonesia - Market size and forecast 2025-2030 ($ million)
Chart on Indonesia - Year-over-year growth 2025-2030 (%)
Data Table on Indonesia - Year-over-year growth 2025-2030 (%)

12.5.6 Thailand - Market size and forecast 2025-2030

Chart on Thailand - Market size and forecast 2025-2030 ($ million)
Data Table on Thailand - Market size and forecast 2025-2030 ($ million)
Chart on Thailand - Year-over-year growth 2025-2030 (%)
Data Table on Thailand - Year-over-year growth 2025-2030 (%)

12.6 Rest of World (ROW) - Market size and forecast 2025-2030

Chart on Rest of World (ROW) - Market size and forecast 2025-2030 ($ million)
Data Table on Rest of World (ROW) - Market size and forecast 2025-2030 ($ million)
Chart on Rest of World (ROW) - Year-over-year growth 2025-2030 (%)
Data Table on Rest of World (ROW) - Year-over-year growth 2025-2030 (%)
Chart on Regional Comparison - Rest of World (ROW)
Data Table on Regional Comparison - Rest of World (ROW)

12.6.1 Brazil - Market size and forecast 2025-2030

Chart on Brazil - Market size and forecast 2025-2030 ($ million)
Data Table on Brazil - Market size and forecast 2025-2030 ($ million)
Chart on Brazil - Year-over-year growth 2025-2030 (%)
Data Table on Brazil - Year-over-year growth 2025-2030 (%)

12.6.2 Saudi Arabia - Market size and forecast 2025-2030

Chart on Saudi Arabia - Market size and forecast 2025-2030 ($ million)
Data Table on Saudi Arabia - Market size and forecast 2025-2030 ($ million)
Chart on Saudi Arabia - Year-over-year growth 2025-2030 (%)
Data Table on Saudi Arabia - Year-over-year growth 2025-2030 (%)

12.6.3 UAE - Market size and forecast 2025-2030

Chart on UAE - Market size and forecast 2025-2030 ($ million)
Data Table on UAE - Market size and forecast 2025-2030 ($ million)
Chart on UAE - Year-over-year growth 2025-2030 (%)
Data Table on UAE - Year-over-year growth 2025-2030 (%)

12.6.4 Turkey - Market size and forecast 2025-2030

Chart on Turkey - Market size and forecast 2025-2030 ($ million)
Data Table on Turkey - Market size and forecast 2025-2030 ($ million)
Chart on Turkey - Year-over-year growth 2025-2030 (%)
Data Table on Turkey - Year-over-year growth 2025-2030 (%)

12.6.5 Argentina - Market size and forecast 2025-2030

Chart on Argentina - Market size and forecast 2025-2030 ($ million)
Data Table on Argentina - Market size and forecast 2025-2030 ($ million)
Chart on Argentina - Year-over-year growth 2025-2030 (%)
Data Table on Argentina - Year-over-year growth 2025-2030 (%)

12.6.6 Colombia - Market size and forecast 2025-2030

Chart on Colombia - Market size and forecast 2025-2030 ($ million)
Data Table on Colombia - Market size and forecast 2025-2030 ($ million)
Chart on Colombia - Year-over-year growth 2025-2030 (%)
Data Table on Colombia - Year-over-year growth 2025-2030 (%)

12.6.7 South Africa - Market size and forecast 2025-2030

Chart on South Africa - Market size and forecast 2025-2030 ($ million)
Data Table on South Africa - Market size and forecast 2025-2030 ($ million)
Chart on South Africa - Year-over-year growth 2025-2030 (%)
Data Table on South Africa - Year-over-year growth 2025-2030 (%)

12.6.8 Israel - Market size and forecast 2025-2030

Chart on Israel - Market size and forecast 2025-2030 ($ million)
Data Table on Israel - Market size and forecast 2025-2030 ($ million)
Chart on Israel - Year-over-year growth 2025-2030 (%)
Data Table on Israel - Year-over-year growth 2025-2030 (%)

12.7 Market opportunity by geography

Market opportunity by geography ($ million)
Data Tables on Market opportunity by geography ($ million)

13. Drivers, Challenges, and Opportunity

13.1 Market drivers

Increased demand for personalized or customized medical devices
Surge in adoption of 3D printing technology by medical professionals
Rising cost efficiency and enhanced productivity

13.2 Market challenges

High initial setup cost of 3D printing facilities
Threat of counterfeiting products is restraining market growth
Limitations of raw materials and 3D-printing techniques

13.3 Impact of drivers and challenges

Impact of drivers and challenges in 2025 and 2030

13.4 Market opportunities

Emerging technological advances and applications of 3D printing in medical devices
Strategic collaborations as well as merger and acquisition are augmenting market growth
Rising focus on research for the use of 3D printing process to manufacture living organs and cell structures.

14. Competitive Landscape

14.1 Overview

14.2

Overview on criticality of inputs and factors of differentiation

14.3 Landscape disruption

Overview on factors of disruption

14.4 Industry risks

Impact of key risks on business

15. Competitive Analysis

15.1 Companies profiled

Companies covered

15.2 Company ranking index

15.3 Market positioning of companies

Matrix on companies position and classification

15.4 3D Systems Corp.

3D Systems Corp. - Overview
3D Systems Corp. - Business segments
3D Systems Corp. - Key offerings
3D Systems Corp. - Segment focus
SWOT

15.5 Axial3D Ltd.

Axial3D Ltd. - Overview
Axial3D Ltd. - Product / Service
Axial3D Ltd. - Key offerings
SWOT

15.6 EnvisionTEC GmBH

EnvisionTEC GmBH - Overview
EnvisionTEC GmBH - Product / Service
EnvisionTEC GmBH - Key offerings
SWOT

15.7 EOS GmbH

EOS GmbH - Overview
EOS GmbH - Product / Service
EOS GmbH - Key offerings
SWOT

15.8 Formlabs Inc.

Formlabs Inc. - Overview
Formlabs Inc. - Product / Service
Formlabs Inc. - Key offerings
SWOT

15.9 GE HealthCare Technologies

GE HealthCare Technologies - Overview
GE HealthCare Technologies - Business segments
GE HealthCare Technologies - Key news
GE HealthCare Technologies - Key offerings
GE HealthCare Technologies - Segment focus
SWOT

15.10 HP Inc.

HP Inc. - Overview
HP Inc. - Business segments
HP Inc. - Key news
HP Inc. - Key offerings
HP Inc. - Segment focus
SWOT

15.11 Limacorporate SpA

Limacorporate SpA - Overview
Limacorporate SpA - Product / Service
Limacorporate SpA - Key offerings
SWOT

15.12 MATERIALISE NV

MATERIALISE NV - Overview
MATERIALISE NV - Business segments
MATERIALISE NV - Key offerings
MATERIALISE NV - Segment focus
SWOT

15.13 Proto Labs Inc.

Proto Labs Inc. - Overview
Proto Labs Inc. - Business segments
Proto Labs Inc. - Key offerings
Proto Labs Inc. - Segment focus
SWOT

15.14 PSYONIC Inc.

PSYONIC Inc. - Overview
PSYONIC Inc. - Product / Service
PSYONIC Inc. - Key offerings
SWOT

15.15 Renishaw Plc

Renishaw Plc - Overview
Renishaw Plc - Business segments
Renishaw Plc - Key offerings
Renishaw Plc - Segment focus
SWOT

15.16 restor3d Inc.

restor3d Inc. - Overview
restor3d Inc. - Product / Service
restor3d Inc. - Key offerings
SWOT

15.17 Ricoh Co. Ltd.

Ricoh Co. Ltd. - Overview
Ricoh Co. Ltd. - Business segments
Ricoh Co. Ltd. - Key offerings
Ricoh Co. Ltd. - Segment focus
SWOT

15.18 Stratasys Ltd.

Stratasys Ltd. - Overview
Stratasys Ltd. - Product / Service
Stratasys Ltd. - Key offerings
SWOT

16. Appendix

16.1 Scope of the report

Market definition
Objectives
Notes and caveats

16.2 Inclusions and exclusions checklist

Inclusions checklist
Exclusions checklist

16.3 Currency conversion rates for US$

16.4 Research methodology

16.5 Data procurement

Information sources

16.6 Data validation

16.7 Validation techniques employed for market sizing

16.8 Data synthesis

16.9 360 degree market analysis

16.10 List of abbreviations

Research Methodology

Technavio presents a detailed picture of the market by way of study, synthesis, and summation of data from multiple sources. The analysts have presented the various facets of the market with a particular focus on identifying the key industry influencers. The data thus presented is comprehensive, reliable, and the result of extensive research, both primary and secondary.

INFORMATION SOURCES

Primary sources

  • Manufacturers and suppliers
  • Channel partners
  • Industry experts
  • Strategic decision makers

Secondary sources

  • Industry journals and periodicals
  • Government data
  • Financial reports of key industry players
  • Historical data
  • Press releases

DATA ANALYSIS

Data Synthesis

  • Collation of data
  • Estimation of key figures
  • Analysis of derived insights

Data Validation

  • Triangulation with data models
  • Reference against proprietary databases
  • Corroboration with industry experts

REPORT WRITING

Qualitative

  • Market drivers
  • Market challenges
  • Market trends
  • Five forces analysis

Quantitative

  • Market size and forecast
  • Market segmentation
  • Geographical insights
  • Competitive landscape

Interested in this report?

Get your sample now to see our research methodology and insights!

Download Now

Frequently Asked Questions

3D Printing In Healthcare Industry market growth will increase by USD 5794.5 million during 2026-2030.

The 3D Printing In Healthcare Industry market is expected to grow at a CAGR of 18.2% during 2026-2030.

3D Printing In Healthcare Industry market is segmented by Application (Orthopedic and spinal, Dental, Hearing aids, Others) Technology (Stereolithography, Granular materials binding, Others) End-user (Medical and surgical centers, Pharmaceutical and biotechnology companies, Academic institutions)

3D Systems Corp., Aspect Biosystems Ltd., Axial3D Ltd., Cyfuse Biomedical K.K., Desktop Metal Inc., EnvisionTEC GmBH, EOS GmbH, Formlabs Inc., GE HealthCare Technologies, HP Inc., Limacorporate SpA, MATERIALISE NV, Proto Labs Inc., PSYONIC Inc., regenHU Ltd., Renishaw Plc, restor3d Inc., Ricoh Co. Ltd., ROKIT Healthcare Inc., Stratasys Ltd. are a few of the key vendors in the 3D Printing In Healthcare Industry market.

North America will register the highest growth rate of 37.7% among the other regions. Therefore, the 3D Printing In Healthcare Industry market in North America is expected to garner significant business opportunities for the vendors during the forecast period.

US, Canada, Mexico, Germany, UK, France, Italy, Spain, The Netherlands, China, India, Japan, South Korea, Indonesia, Thailand, Brazil, Saudi Arabia, UAE, Turkey, Argentina, Colombia, South Africa, Israel

  • Increased demand for personalized or customized medical devices is the driving factor this market.

The 3D Printing In Healthcare Industry market vendors should focus on grabbing business opportunities from the Application segment as it accounted for the largest market share in the base year.
RIA - Research AI Assistant
Ask RIA
