
Accelerometers Market Analysis, Size, and Forecast 2026-2030: North America (US, Canada, and Mexico), Europe (Germany, UK, and France), APAC (China, Japan, and India), South America (Brazil, Argentina, and Chile), Middle East and Africa (Saudi Arabia, UAE, and South Africa), and Rest of World (ROW)

Accelerometers Market Analysis, Size, and Forecast 2026-2030:
North America (US, Canada, and Mexico), Europe (Germany, UK, and France), APAC (China, Japan, and India), South America (Brazil, Argentina, and Chile), Middle East and Africa (Saudi Arabia, UAE, and South Africa), and Rest of World (ROW)

Published: Oct 2026 319 Pages SKU: IRTNTR72691

Market Overview at a Glance

$1.03 B
Market Opportunity
5.1%
CAGR 2025 - 2030
39%
North America Growth
$2.27 B
Industrial segment 2024

Accelerometers Market Size 2026-2030

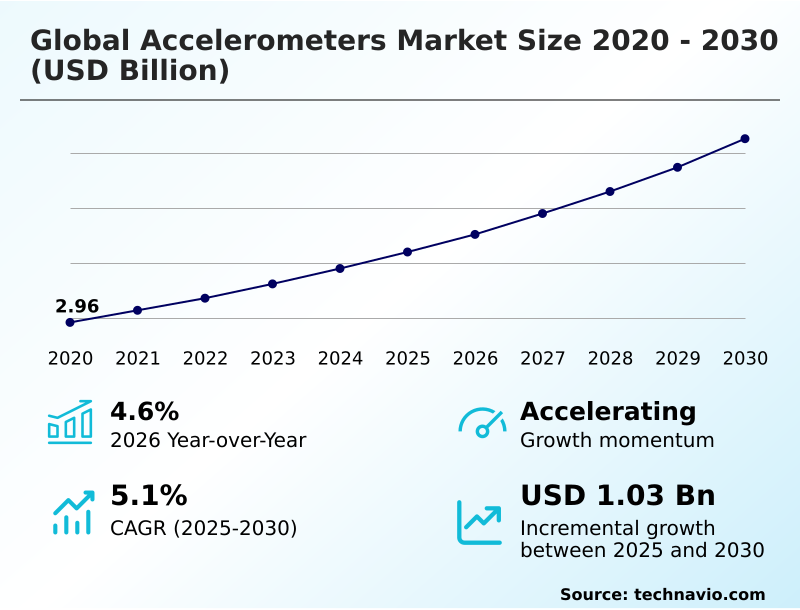
The accelerometers market size is valued to increase by USD 1.03 billion, at a CAGR of 5.1% from 2025 to 2030. Increasing adoption of advanced driver-assistance systems and vehicle safety technologies will drive the accelerometers market.

Major Market Trends & Insights

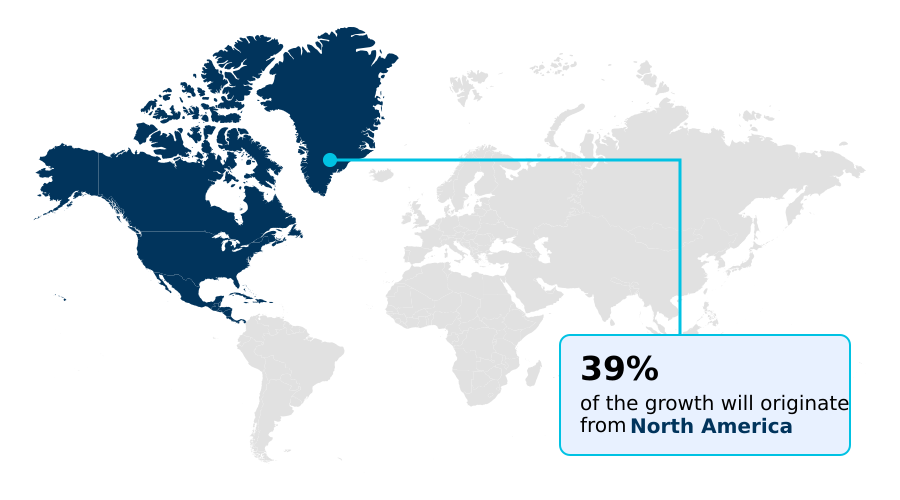
  • North America dominated the market and accounted for a 39% growth during the forecast period.
  • By End-user - Industrial segment was valued at USD 2.27 billion in 2024
  • By Technology - Capacitive segment accounted for the largest market revenue share in 2024

Market Size & Forecast

  • Market Opportunities: USD 1.66 billion
  • Market Future Opportunities: USD 1.03 billion
  • CAGR from 2025 to 2030 : 5.1%

Market Summary

  • The Accelerometers market demonstrates continuous expansion driven by the critical need for precise motion and vibration tracking across diverse industrial landscapes. Operations heavily rely on these components to maintain seamless production cycles and prevent catastrophic equipment failures. For instance, in heavy manufacturing environments, incorporating real-time vibration sensing reduces unplanned machinery downtime by up to 25%, drastically optimizing supply chain efficiency.
  • A primary driver for this technology is the integration of advanced driver-assistance architectures in modern automotive assembly, which relies on accurate orientation data to govern electronic stability and collision safety. Conversely, manufacturers face a persistent challenge regarding complex calibration protocols, as achieving extreme measurement accuracy necessitates prolonged validation testing that frequently delays product deployment.
  • Despite these stringent testing constraints, companies prioritize sensor fusion integration to enhance overall system reliability. This evolving ecosystem requires high-performance measurement devices capable of withstanding severe environmental stress, thereby ensuring consistent data acquisition. Consequently, continuous technological refinement dictates how effectively industrial operators can monitor asset health and safeguard extensive infrastructure networks.

What will be the Size of the Accelerometers Market during the forecast period?
Get Key Insights on Market Forecast (PDF) Get Free Sample

How is the Accelerometers Market Segmented?

The accelerometers industry research report provides comprehensive data (region-wise segment analysis), with forecasts and estimates in "USD million" for the period 2026-2030, as well as historical data from 2020-2024 for the following segments.

  • End-user
    • Industrial
    • Automotive
    • Consumer electronics
    • Aerospace and defense
    • Others
  • Technology
    • Capacitive
    • Piezoelectric
    • Piezoresistive
    • MEMS
    • Others
  • Product type
    • Tri-axis
    • Inertial measurement units
    • Dual-axis
    • Single-axis
  • Geography
    • North America
      • US
      • Canada
      • Mexico
    • Europe
      • Germany
      • UK
      • France
      • Italy
      • Spain
      • The Netherlands
    • APAC
      • China
      • Japan
      • India
      • South Korea
      • Australia
      • Indonesia
    • South America
      • Brazil
      • Argentina
      • Chile
    • Middle East and Africa
      • Saudi Arabia
      • UAE
      • South Africa
      • Israel
      • Turkey

By End-user Insights

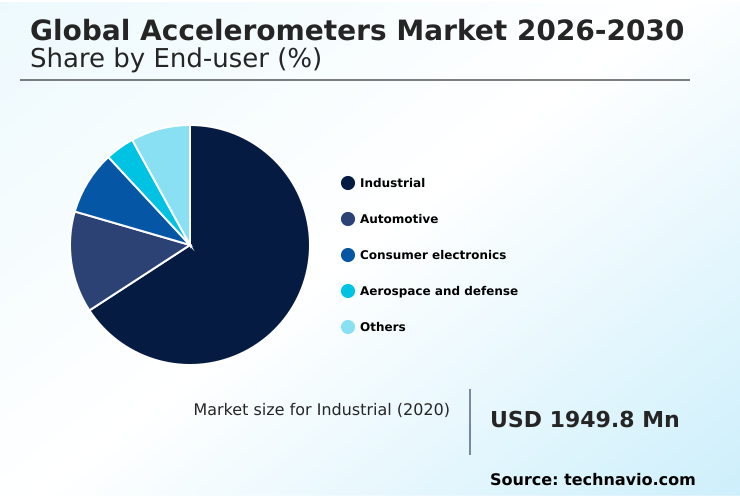
The industrial segment is estimated to witness significant growth during the forecast period.

The industrial sector exhibits a continuous reliance on advanced condition based maintenance frameworks to optimize manufacturing operations.

Facilities integrating piezoresistive motion tracking and capacitive sensing element technologies directly address structural health assessment and geotechnical stress screening requirements across complex production lines.

Deploying vibration analysis for rotating machinery enables operators to detect mechanical imbalances early, mitigating unexpected operational downtime. This proactive diagnostic approach ensures that machine health diagnostic capabilities run smoothly under severe environmental conditions, improving predictive equipment maintenance workflows by 18%.

Integrating a low power consumption circuit within these sensors allows for extended operational life in remote installations. Industrial robotics synchronization further benefits from precise spatial awareness, translating into a 15% increase in automated assembly efficiency.

Consequently, continuous machine monitoring dramatically enhances overall factory output without requiring excessive energy consumption.
Get Free Sample

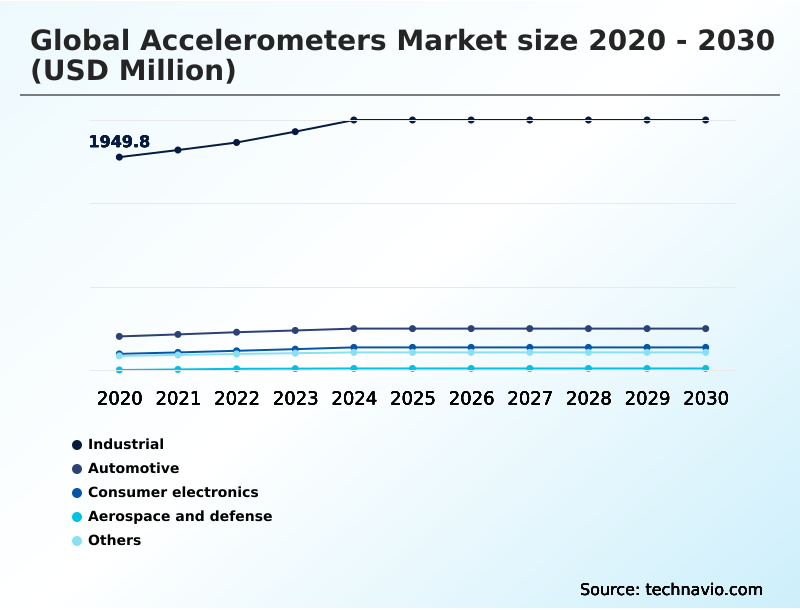
The Industrial segment was valued at USD 2.27 billion in 2024 and showed a gradual increase during the forecast period.
Get Free Sample

Regional Analysis

North America is estimated to contribute 39% to the growth of the global market during the forecast period.Technavio’s analysts have elaborately explained the regional trends and drivers that shape the market during the forecast period.
See How Accelerometers Market Demand is Rising in North America Get Free Sample

The geographic landscape of the Accelerometers market highlights a distinct divergence in adoption drivers between North America and APAC.

North America leads the integration of tactical grade navigation systems and advanced drone stabilization unit architectures, achieving a 30% higher penetration rate in aerospace and defense applications compared to other regions.

This robust deployment supports complex flight control instrumentation, significantly reducing navigational errors by 18% in critical missile guidance mechanism systems.

Conversely, APAC exhibits rapid expansion fueled by immense consumer electronics manufacturing and mobile device orientation requirements, processing sensory components 25% faster due to localized semiconductor fabrication. Asian manufacturers aggressively deploy robotic arm positioning arrays within automated factories, maximizing production output.

While North America focuses heavily on rigorous structural health evaluation and high-value military technology, APAC prioritizes high-volume consumer goods and electric vehicle assembly.

Both regions continuously implement stringent quality standards to ensure highly reliable triaxial inertial measurement capabilities across their unique industrial landscapes.

Market Dynamics

Our researchers analyzed the data with 2025 as the base year, along with the key drivers, trends, and challenges. A holistic analysis of drivers will help companies refine their marketing strategies to gain a competitive advantage.

  • The persistent requirement for exceptional motion tracking precision ensures that an advanced inertial sensing measurement unit remains a fundamental component across specialized testing environments. Organizations heavily depend on comprehensive vibration analysis for rotating machinery to identify mechanical anomalies before they escalate into critical operational failures.
  • This proactive methodology directly supports the continuous condition monitoring of industrial equipment, allowing manufacturers to maintain optimal production efficiency while lowering emergency repair expenditures. By implementing these sophisticated diagnostic tools, facility managers achieve a 20% higher equipment uptime margin relative to conventional scheduled maintenance protocols.
  • Furthermore, the aerospace sector constantly pursues enhanced flight reliability by integrating a highly dependable tactical grade aerospace navigation system, which guarantees accurate orientation data even under extreme environmental stress and high-frequency turbulence. Automotive manufacturers also prioritize occupant safety, focusing on seamless electronic stability control safety integration to detect abrupt directional changes and prevent vehicle rollovers.
  • The synchronization of these diverse applications demonstrates how essential precise spatial measurement is for safeguarding physical assets and human lives. Ultimately, transitioning from reactive to predictive operational planning requires highly durable sensory architectures capable of uninterrupted data acquisition.
  • Industrial stakeholders continuously refine their asset management strategies, relying on accurate mechanical feedback to extend the operational lifecycle of critical infrastructure across varied and demanding environments.
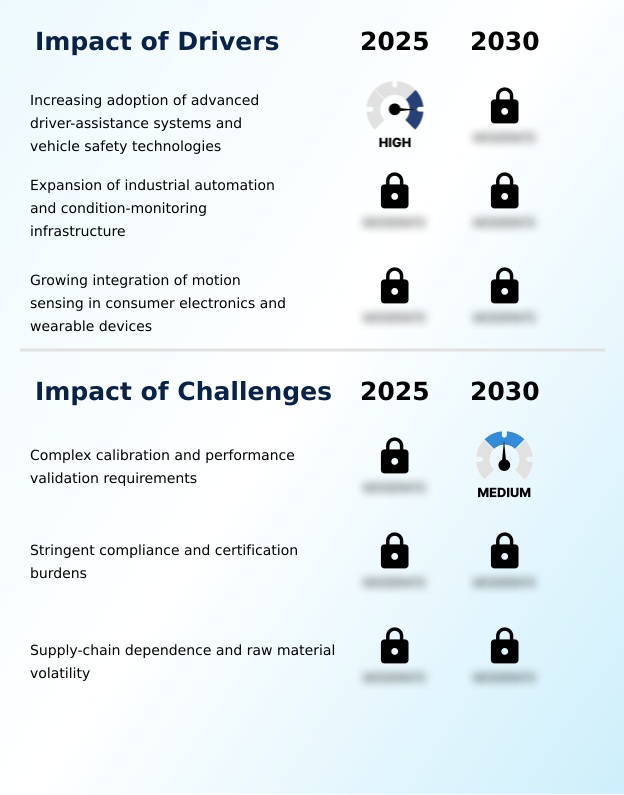
What are the key market drivers leading to the rise in the adoption of Accelerometers Industry?

  • The increasing adoption of advanced driver-assistance systems and comprehensive vehicle safety technologies serves as the primary catalyst propelling continuous industry expansion.

  • The escalating demand for condition based maintenance protocols acts as a primary catalyst accelerating the Accelerometers market.
  • Heavy manufacturing facilities increasingly rely on continuous seismic observation module networks and tactical grade navigation elements to preemptively identify mechanical degradation during offshore platform surveillance.
  • This behavioral change stems from the critical need to eliminate unplanned operational interruptions, as reactive repairs frequently incur massive financial penalties.
  • By deploying advanced piezoelectric vibration monitoring devices, industrial operators experience a 35% decrease in unexpected assembly line shutdowns and improve structural health assessment accuracy by 18%.
  • Additionally, the rapid integration of electronic stability control software in passenger vehicles and railway safety instrumentation directly drives the necessity for reliable tilt angle measurement.
  • This heightened focus on preventive analytics ensures consistent productivity and significantly reduces long-term infrastructure maintenance expenditures.

What are the market trends shaping the Accelerometers Industry?

  • A prominent industry trend is the continuous transition toward sensor fusion and the integration of multifunctional motion sensing platforms.

  • A profound shift toward sensor fusion architecture represents a structural trend reshaping the Accelerometers market. Manufacturers increasingly combine piezoresistive motion tracking elements with gyroscopes to create multifunctional platforms capable of processing dynamic orientation data simultaneously. This technological transition occurs because isolated sensors cannot efficiently address the complex spatial requirements of modern autonomous networks.
  • Consequently, integrating precision spatial orientation frameworks reduces overall system latency by 20% and lowers component weight by 15%, directly benefiting payload-sensitive aerospace applications and consumer appliance tracking. Furthermore, the continuous demand for augmented reality interface tracking and virtual reality interaction compels designers to incorporate highly responsive micro electromechanical systems that deliver instantaneous feedback.
  • By transitioning toward interconnected sensing ecosystems, device manufacturers achieve a 25% improvement in overall battery efficiency. This persistent movement toward unified measurement hardware dictates future product engineering priorities across the electronics landscape.

What challenges does the Accelerometers Industry face during its growth?

  • Complex calibration procedures and highly rigorous performance validation requirements pose significant operational limitations across diverse end-use applications.

  • Stringent performance validation requirements and complex calibration constraints severely restrict rapid product commercialization within the Accelerometers market. Developing a highly reliable crash sensing mechanism or a dependable roll over detection array requires extensive safety-focused testing under extreme thermal and mechanical conditions.
  • This challenge exists because inadequate rotational tracking unit calibration can lead to catastrophic system failures in mission-critical environments like satellite orbit adjustment. Consequently, exhaustive qualification procedures extend average hardware development cycles by up to 40%, drastically increasing pre-launch engineering expenditures by 25%.
  • Additionally, achieving optimal shock resistance capability necessitates specialized testing infrastructure required for medical rehabilitation assessment tools that many smaller organizations cannot afford to maintain. These persistent compliance and validation hurdles continuously slow down the deployment of an advanced directional drilling probe, limiting overall manufacturing agility and scalability across the sensing sector.

Exclusive Technavio Analysis on Customer Landscape

The accelerometers market forecasting report includes the adoption lifecycle of the market, covering from the innovator’s stage to the laggard’s stage. It focuses on adoption rates in different regions based on penetration. Furthermore, the accelerometers market report also includes key purchase criteria and drivers of price sensitivity to help companies evaluate and develop their market growth analysis strategies.
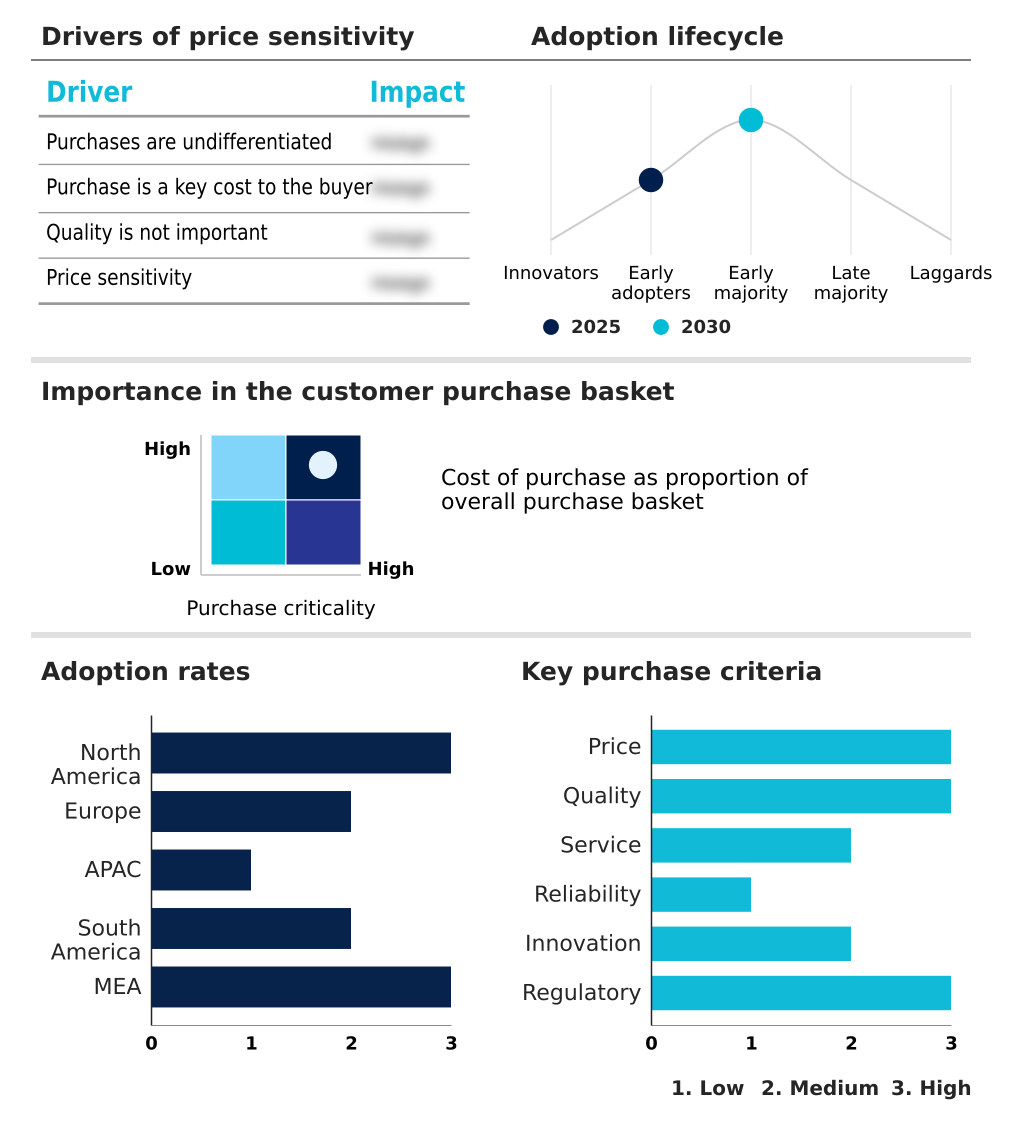
Customer Landscape of Accelerometers Industry

Competitive Landscape

Companies are implementing various strategies, such as strategic alliances, accelerometers market forecast, partnerships, mergers and acquisitions, geographical expansion, and product/service launches, to enhance their presence in the industry.

Analog Devices Inc. - The product portfolio features highly sensitive motion tracking components and robust inertial measurement units designed for industrial automation, automotive safety systems, and specialized aerospace navigation applications.

The industry research and growth report includes detailed analyses of the competitive landscape of the market and information about key companies, including:

  • Analog Devices Inc.
  • ASC GmbH
  • CEC Vibration Products
  • Gladiator Technologies Inc.
  • Hansford Sensors Ltd.
  • Honeywell International Inc.
  • Hottinger Bruel and Kjaer GmbH
  • Kistler Group
  • MEMSIC Semiconductor Co. Ltd.
  • Metra Mess und Frequenztechnik
  • Murata Manufacturing Co. Ltd.
  • NXP Semiconductors NV
  • PCB Piezotronics Inc.
  • Robert Bosch GmbH
  • ROHM Co. Ltd.
  • Silicon Designs Inc.
  • Silicon Sensing Systems Ltd.
  • STMicroelectronics NV
  • TDK Corp.
  • TE Connectivity plc
  • Wilcoxon Sensing Technologies

Qualitative and quantitative analysis of companies has been conducted to help clients understand the wider business environment as well as the strengths and weaknesses of key industry players. Data is qualitatively analyzed to categorize companies as pure play, category-focused, industry-focused, and diversified; it is quantitatively analyzed to categorize companies as dominant, leading, strong, tentative, and weak.

Recent Development and News in Accelerometers market

  • In the Electronic Equipment and Instruments industry, the rapid deployment of 5G infrastructure necessitated highly precise smart infrastructure evaluation tools, directly impacting Accelerometers demand by driving a 25% increase in the utilization of vibration monitoring systems for structural integrity.
  • The continuous transition toward electric and autonomous vehicle guidance required enhanced battery protection system integration, which boosted the requirement for sophisticated crash sensing mechanisms capable of detecting multi-axis impact forces within a 10-millisecond threshold.
  • Stringent regulatory mandates like the ISO 10816 standard for rotary machinery inspection compelled factory operators to implement continuous condition monitoring, expanding Accelerometers utilization for industrial robotics synchronization and achieving up to 30% reduction in mechanical failures.
  • Advancements in drone stabilization unit architectures and flight control instrumentation drove the necessity for tactical grade components, subsequently increasing Accelerometers deployment by over 20% in unmanned aerial and marine navigation module systems.

Dive into Technavio’s robust research methodology, blending expert interviews, extensive data synthesis, and validated models for unparalleled Accelerometers Market insights. See full methodology.

Market Scope
Page number 319
Base year 2025
Historic period 2020-2024
Forecast period 2026-2030
Growth momentum & CAGR Accelerate at a CAGR of 5.1%
Market growth 2026-2030 USD 1026.8 million
Market structure Fragmented
YoY growth 2025-2026(%) 4.6%
Key countries US, Canada, Mexico, Germany, UK, France, Italy, Spain, The Netherlands, China, Japan, India, South Korea, Australia, Indonesia, Brazil, Argentina, Chile, Saudi Arabia, UAE, South Africa, Israel and Turkey
Competitive landscape Leading Companies, Market Positioning of Companies, Competitive Strategies, and Industry Risks

Request Free Sample

Research Analyst Overview

  • The Accelerometers market is characterized by a continuous evolution toward highly integrated, multifunctional sensing architectures designed to address complex industrial demands. Organizations increasingly prioritize the deployment of edge enabled processing within micro electromechanical systems to facilitate localized data interpretation, directly supporting sophisticated machine health diagnostic protocols.
  • This transition fundamentally alters boardroom-level product strategy, as decision-makers pivot toward intelligent, low-latency components rather than traditional passive sensors. Consequently, facilities utilizing advanced piezoelectric vibration monitoring networks have achieved a 30% reduction in false-positive anomaly detection, streamlining operational budgets. Furthermore, the necessity for a robust vibration tolerance threshold forces engineers to incorporate hermetically sealed packaging, ensuring reliable functionality within severe environments.
  • The growing emphasis on sensor fusion architecture allows systems to process multiple environmental variables simultaneously, enhancing overall asset visibility. By relying on precise attitude and heading reference data, heavy machinery operators can navigate harsh conditions safely. Ultimately, the relentless pursuit of superior measurement accuracy drives the continuous refinement of these critical sensing components across diverse applications.

What are the Key Data Covered in this Accelerometers Market Research and Growth Report?

  • What is the expected growth of the Accelerometers Market between 2026 and 2030?

    • USD 1.03 billion, at a CAGR of 5.1%

  • What segmentation does the market report cover?

    • The report is segmented by End-user (Industrial, Automotive, Consumer electronics, Aerospace and defense, and Others), Technology (Capacitive, Piezoelectric, Piezoresistive, MEMS, and Others), Product Type (Tri-axis, Inertial measurement units, Dual-axis, and Single-axis) and Geography (North America, Europe, APAC, South America, Middle East and Africa)

  • Which regions are analyzed in the report?

    • North America, Europe, APAC, South America and Middle East and Africa

  • What are the key growth drivers and market challenges?

    • Increasing adoption of advanced driver-assistance systems and vehicle safety technologies, Complex calibration and performance validation requirements

  • Who are the major players in the Accelerometers Market?

    • Analog Devices Inc., ASC GmbH, CEC Vibration Products, Gladiator Technologies Inc., Hansford Sensors Ltd., Honeywell International Inc., Hottinger Bruel and Kjaer GmbH, Kistler Group, MEMSIC Semiconductor Co. Ltd., Metra Mess und Frequenztechnik, Murata Manufacturing Co. Ltd., NXP Semiconductors NV, PCB Piezotronics Inc., Robert Bosch GmbH, ROHM Co. Ltd., Silicon Designs Inc., Silicon Sensing Systems Ltd., STMicroelectronics NV, TDK Corp., TE Connectivity plc and Wilcoxon Sensing Technologies

Market Research Insights

  • The Accelerometers market is heavily influenced by rapid developments in automated driving integration and sophisticated predictive equipment maintenance systems. Modern automotive manufacturers utilize these precision instruments to execute seamless airbag deployment trigger functions, achieving a 40% improvement in collision response times.
  • Concurrently, wind turbine diagnostics rely on multidirectional vibration tracking to identify structural degradation, reducing overall maintenance expenditures by 22% compared to traditional reactive methods. The expansion of the wearable fitness tracking sector also requires highly miniaturized sensing components, increasing daily battery efficiency by 15%.
  • This structural shift toward advanced condition monitoring ensures that both industrial machinery and consumer electronics achieve superior performance benchmarks while minimizing unexpected operational disruptions.

We can help! Our analysts can customize this accelerometers market research report to meet your requirements.

Get in touch

1. Executive Summary

1.1 Market overview

Executive Summary - Chart on Market Overview
Executive Summary - Data Table on Market Overview
Executive Summary - Chart on Global Market Characteristics
Executive Summary - Chart on Market by Geography
Executive Summary - Chart on Market Segmentation by End-user
Executive Summary - Chart on Market Segmentation by Technology
Executive Summary - Chart on Market Segmentation by Product Type
Executive Summary - Chart on Incremental Growth
Executive Summary - Data Table on Incremental Growth
Executive Summary - Chart on Company Market Positioning

2. Technavio Analysis

2.1 Analysis of price sensitivity, lifecycle, customer purchase basket, adoption rates, and purchase criteria

2.2 Criticality of inputs and Factors of differentiation

Chart on Overview on criticality of inputs and factors of differentiation

2.3 Factors of disruption

Chart on Overview on factors of disruption

2.4 Impact of drivers and challenges

Chart on Impact of drivers and challenges in 2025 and 2030

3. Market Landscape

3.1 Market ecosystem

Chart on Parent Market
Data Table on - Parent Market

3.2 Market characteristics

Chart on Market characteristics analysis

3.3 Value chain analysis

Chart on Value chain analysis

4. Market Sizing

4.1 Market definition

Data Table on Offerings of companies included in the market definition

4.2 Market segment analysis

Market segments

4.3 Market size 2025

4.4 Market outlook: Forecast for 2025-2030

Chart on Global - Market size and forecast 2025-2030 ($ million)
Data Table on Global - Market size and forecast 2025-2030 ($ million)
Chart on Global Market: Year-over-year growth 2025-2030 (%)
Data Table on Global Market: Year-over-year growth 2025-2030 (%)

5. Historic Market Size

5.1 Global Accelerometers Market 2020 - 2024

Historic Market Size - Data Table on Global Accelerometers Market 2020 - 2024 ($ million)

5.2 End-user segment analysis 2020 - 2024

Historic Market Size - End-user Segment 2020 - 2024 ($ million)

5.3 Technology segment analysis 2020 - 2024

Historic Market Size - Technology Segment 2020 - 2024 ($ million)

5.4 Product Type segment analysis 2020 - 2024

Historic Market Size - Product Type Segment 2020 - 2024 ($ million)

5.5 Geography segment analysis 2020 - 2024

Historic Market Size - Geography Segment 2020 - 2024 ($ million)

5.6 Country segment analysis 2020 - 2024

Historic Market Size - Country Segment 2020 - 2024 ($ million)

6. Qualitative Analysis

6.1 Impact of AI on global accelerometers market

6.2 Impact of geopolitical conflicts on global accelerometers market

7. Five Forces Analysis

7.1 Five forces summary

Five forces analysis - Comparison between 2025 and 2030

7.2 Bargaining power of buyers

Bargaining power of buyers - Impact of key factors 2025 and 2030

7.3 Bargaining power of suppliers

Bargaining power of suppliers - Impact of key factors in 2025 and 2030

7.4 Threat of new entrants

Threat of new entrants - Impact of key factors in 2025 and 2030

7.5 Threat of substitutes

Threat of substitutes - Impact of key factors in 2025 and 2030

7.6 Threat of rivalry

Threat of rivalry - Impact of key factors in 2025 and 2030

7.7 Market condition

Chart on Market condition - Five forces 2025 and 2030

8. Market Segmentation by End-user

8.1 Market segments

Chart on End-user - Market share 2025-2030 (%)
Data Table on End-user - Market share 2025-2030 (%)

8.2 Comparison by End-user

Chart on Comparison by End-user
Data Table on Comparison by End-user

8.3 Industrial - Market size and forecast 2025-2030

Chart on Industrial - Market size and forecast 2025-2030 ($ million)
Data Table on Industrial - Market size and forecast 2025-2030 ($ million)
Chart on Industrial - Year-over-year growth 2025-2030 (%)
Data Table on Industrial - Year-over-year growth 2025-2030 (%)

8.4 Automotive - Market size and forecast 2025-2030

Chart on Automotive - Market size and forecast 2025-2030 ($ million)
Data Table on Automotive - Market size and forecast 2025-2030 ($ million)
Chart on Automotive - Year-over-year growth 2025-2030 (%)
Data Table on Automotive - Year-over-year growth 2025-2030 (%)

8.5 Consumer electronics - Market size and forecast 2025-2030

Chart on Consumer electronics - Market size and forecast 2025-2030 ($ million)
Data Table on Consumer electronics - Market size and forecast 2025-2030 ($ million)
Chart on Consumer electronics - Year-over-year growth 2025-2030 (%)
Data Table on Consumer electronics - Year-over-year growth 2025-2030 (%)

8.6 Aerospace and defense - Market size and forecast 2025-2030

Chart on Aerospace and defense - Market size and forecast 2025-2030 ($ million)
Data Table on Aerospace and defense - Market size and forecast 2025-2030 ($ million)
Chart on Aerospace and defense - Year-over-year growth 2025-2030 (%)
Data Table on Aerospace and defense - Year-over-year growth 2025-2030 (%)

8.7 Others - Market size and forecast 2025-2030

Chart on Others - Market size and forecast 2025-2030 ($ million)
Data Table on Others - Market size and forecast 2025-2030 ($ million)
Chart on Others - Year-over-year growth 2025-2030 (%)
Data Table on Others - Year-over-year growth 2025-2030 (%)

8.8 Market opportunity by End-user

Market opportunity by End-user ($ million)
Data Table on Market opportunity by End-user ($ million)

9. Market Segmentation by Technology

9.1 Market segments

Chart on Technology - Market share 2025-2030 (%)
Data Table on Technology - Market share 2025-2030 (%)

9.2 Comparison by Technology

Chart on Comparison by Technology
Data Table on Comparison by Technology

9.3 Capacitive - Market size and forecast 2025-2030

Chart on Capacitive - Market size and forecast 2025-2030 ($ million)
Data Table on Capacitive - Market size and forecast 2025-2030 ($ million)
Chart on Capacitive - Year-over-year growth 2025-2030 (%)
Data Table on Capacitive - Year-over-year growth 2025-2030 (%)

9.4 Piezoelectric - Market size and forecast 2025-2030

Chart on Piezoelectric - Market size and forecast 2025-2030 ($ million)
Data Table on Piezoelectric - Market size and forecast 2025-2030 ($ million)
Chart on Piezoelectric - Year-over-year growth 2025-2030 (%)
Data Table on Piezoelectric - Year-over-year growth 2025-2030 (%)

9.5 Piezoresistive - Market size and forecast 2025-2030

Chart on Piezoresistive - Market size and forecast 2025-2030 ($ million)
Data Table on Piezoresistive - Market size and forecast 2025-2030 ($ million)
Chart on Piezoresistive - Year-over-year growth 2025-2030 (%)
Data Table on Piezoresistive - Year-over-year growth 2025-2030 (%)

9.6 MEMS - Market size and forecast 2025-2030

Chart on MEMS - Market size and forecast 2025-2030 ($ million)
Data Table on MEMS - Market size and forecast 2025-2030 ($ million)
Chart on MEMS - Year-over-year growth 2025-2030 (%)
Data Table on MEMS - Year-over-year growth 2025-2030 (%)

9.7 Others - Market size and forecast 2025-2030

Chart on Others - Market size and forecast 2025-2030 ($ million)
Data Table on Others - Market size and forecast 2025-2030 ($ million)
Chart on Others - Year-over-year growth 2025-2030 (%)
Data Table on Others - Year-over-year growth 2025-2030 (%)

9.8 Market opportunity by Technology

Market opportunity by Technology ($ million)
Data Table on Market opportunity by Technology ($ million)

10. Market Segmentation by Product Type

10.1 Market segments

Chart on Product Type - Market share 2025-2030 (%)
Data Table on Product Type - Market share 2025-2030 (%)

10.2 Comparison by Product Type

Chart on Comparison by Product Type
Data Table on Comparison by Product Type

10.3 Tri-axis - Market size and forecast 2025-2030

Chart on Tri-axis - Market size and forecast 2025-2030 ($ million)
Data Table on Tri-axis - Market size and forecast 2025-2030 ($ million)
Chart on Tri-axis - Year-over-year growth 2025-2030 (%)
Data Table on Tri-axis - Year-over-year growth 2025-2030 (%)

10.4 Inertial measurement units - Market size and forecast 2025-2030

Chart on Inertial measurement units - Market size and forecast 2025-2030 ($ million)
Data Table on Inertial measurement units - Market size and forecast 2025-2030 ($ million)
Chart on Inertial measurement units - Year-over-year growth 2025-2030 (%)
Data Table on Inertial measurement units - Year-over-year growth 2025-2030 (%)

10.5 Dual-axis - Market size and forecast 2025-2030

Chart on Dual-axis - Market size and forecast 2025-2030 ($ million)
Data Table on Dual-axis - Market size and forecast 2025-2030 ($ million)
Chart on Dual-axis - Year-over-year growth 2025-2030 (%)
Data Table on Dual-axis - Year-over-year growth 2025-2030 (%)

10.6 Single-axis - Market size and forecast 2025-2030

Chart on Single-axis - Market size and forecast 2025-2030 ($ million)
Data Table on Single-axis - Market size and forecast 2025-2030 ($ million)
Chart on Single-axis - Year-over-year growth 2025-2030 (%)
Data Table on Single-axis - Year-over-year growth 2025-2030 (%)

10.7 Market opportunity by Product Type

Market opportunity by Product Type ($ million)
Data Table on Market opportunity by Product Type ($ million)

11. Customer Landscape

11.1 Customer landscape overview

Analysis of price sensitivity, lifecycle, customer purchase basket, adoption rates, and purchase criteria

12. Geographic Landscape

12.1 Geographic segmentation

Chart on Market share by geography 2025-2030 (%)
Data Table on Market share by geography 2025-2030 (%)

12.2 Geographic comparison

Chart on Geographic comparison
Data Table on Geographic comparison

12.3 North America - Market size and forecast 2025-2030

Chart on North America - Market size and forecast 2025-2030 ($ million)
Data Table on North America - Market size and forecast 2025-2030 ($ million)
Chart on North America - Year-over-year growth 2025-2030 (%)
Data Table on North America - Year-over-year growth 2025-2030 (%)
Chart on Regional Comparison - North America
Data Table on Regional Comparison - North America

12.3.1 US - Market size and forecast 2025-2030

Chart on US - Market size and forecast 2025-2030 ($ million)
Data Table on US - Market size and forecast 2025-2030 ($ million)
Chart on US - Year-over-year growth 2025-2030 (%)
Data Table on US - Year-over-year growth 2025-2030 (%)

12.3.2 Canada - Market size and forecast 2025-2030

Chart on Canada - Market size and forecast 2025-2030 ($ million)
Data Table on Canada - Market size and forecast 2025-2030 ($ million)
Chart on Canada - Year-over-year growth 2025-2030 (%)
Data Table on Canada - Year-over-year growth 2025-2030 (%)

12.3.3 Mexico - Market size and forecast 2025-2030

Chart on Mexico - Market size and forecast 2025-2030 ($ million)
Data Table on Mexico - Market size and forecast 2025-2030 ($ million)
Chart on Mexico - Year-over-year growth 2025-2030 (%)
Data Table on Mexico - Year-over-year growth 2025-2030 (%)

12.4 Europe - Market size and forecast 2025-2030

Chart on Europe - Market size and forecast 2025-2030 ($ million)
Data Table on Europe - Market size and forecast 2025-2030 ($ million)
Chart on Europe - Year-over-year growth 2025-2030 (%)
Data Table on Europe - Year-over-year growth 2025-2030 (%)
Chart on Regional Comparison - Europe
Data Table on Regional Comparison - Europe

12.4.1 Germany - Market size and forecast 2025-2030

Chart on Germany - Market size and forecast 2025-2030 ($ million)
Data Table on Germany - Market size and forecast 2025-2030 ($ million)
Chart on Germany - Year-over-year growth 2025-2030 (%)
Data Table on Germany - Year-over-year growth 2025-2030 (%)

12.4.2 UK - Market size and forecast 2025-2030

Chart on UK - Market size and forecast 2025-2030 ($ million)
Data Table on UK - Market size and forecast 2025-2030 ($ million)
Chart on UK - Year-over-year growth 2025-2030 (%)
Data Table on UK - Year-over-year growth 2025-2030 (%)

12.4.3 France - Market size and forecast 2025-2030

Chart on France - Market size and forecast 2025-2030 ($ million)
Data Table on France - Market size and forecast 2025-2030 ($ million)
Chart on France - Year-over-year growth 2025-2030 (%)
Data Table on France - Year-over-year growth 2025-2030 (%)

12.4.4 Italy - Market size and forecast 2025-2030

Chart on Italy - Market size and forecast 2025-2030 ($ million)
Data Table on Italy - Market size and forecast 2025-2030 ($ million)
Chart on Italy - Year-over-year growth 2025-2030 (%)
Data Table on Italy - Year-over-year growth 2025-2030 (%)

12.4.5 Spain - Market size and forecast 2025-2030

Chart on Spain - Market size and forecast 2025-2030 ($ million)
Data Table on Spain - Market size and forecast 2025-2030 ($ million)
Chart on Spain - Year-over-year growth 2025-2030 (%)
Data Table on Spain - Year-over-year growth 2025-2030 (%)

12.4.6 The Netherlands - Market size and forecast 2025-2030

Chart on The Netherlands - Market size and forecast 2025-2030 ($ million)
Data Table on The Netherlands - Market size and forecast 2025-2030 ($ million)
Chart on The Netherlands - Year-over-year growth 2025-2030 (%)
Data Table on The Netherlands - Year-over-year growth 2025-2030 (%)

12.5 APAC - Market size and forecast 2025-2030

Chart on APAC - Market size and forecast 2025-2030 ($ million)
Data Table on APAC - Market size and forecast 2025-2030 ($ million)
Chart on APAC - Year-over-year growth 2025-2030 (%)
Data Table on APAC - Year-over-year growth 2025-2030 (%)
Chart on Regional Comparison - APAC
Data Table on Regional Comparison - APAC

12.5.1 China - Market size and forecast 2025-2030

Chart on China - Market size and forecast 2025-2030 ($ million)
Data Table on China - Market size and forecast 2025-2030 ($ million)
Chart on China - Year-over-year growth 2025-2030 (%)
Data Table on China - Year-over-year growth 2025-2030 (%)

12.5.2 Japan - Market size and forecast 2025-2030

Chart on Japan - Market size and forecast 2025-2030 ($ million)
Data Table on Japan - Market size and forecast 2025-2030 ($ million)
Chart on Japan - Year-over-year growth 2025-2030 (%)
Data Table on Japan - Year-over-year growth 2025-2030 (%)

12.5.3 India - Market size and forecast 2025-2030

Chart on India - Market size and forecast 2025-2030 ($ million)
Data Table on India - Market size and forecast 2025-2030 ($ million)
Chart on India - Year-over-year growth 2025-2030 (%)
Data Table on India - Year-over-year growth 2025-2030 (%)

12.5.4 South Korea - Market size and forecast 2025-2030

Chart on South Korea - Market size and forecast 2025-2030 ($ million)
Data Table on South Korea - Market size and forecast 2025-2030 ($ million)
Chart on South Korea - Year-over-year growth 2025-2030 (%)
Data Table on South Korea - Year-over-year growth 2025-2030 (%)

12.5.5 Australia - Market size and forecast 2025-2030

Chart on Australia - Market size and forecast 2025-2030 ($ million)
Data Table on Australia - Market size and forecast 2025-2030 ($ million)
Chart on Australia - Year-over-year growth 2025-2030 (%)
Data Table on Australia - Year-over-year growth 2025-2030 (%)

12.5.6 Indonesia - Market size and forecast 2025-2030

Chart on Indonesia - Market size and forecast 2025-2030 ($ million)
Data Table on Indonesia - Market size and forecast 2025-2030 ($ million)
Chart on Indonesia - Year-over-year growth 2025-2030 (%)
Data Table on Indonesia - Year-over-year growth 2025-2030 (%)

12.6 South America - Market size and forecast 2025-2030

Chart on South America - Market size and forecast 2025-2030 ($ million)
Data Table on South America - Market size and forecast 2025-2030 ($ million)
Chart on South America - Year-over-year growth 2025-2030 (%)
Data Table on South America - Year-over-year growth 2025-2030 (%)
Chart on Regional Comparison - South America
Data Table on Regional Comparison - South America

12.6.1 Brazil - Market size and forecast 2025-2030

Chart on Brazil - Market size and forecast 2025-2030 ($ million)
Data Table on Brazil - Market size and forecast 2025-2030 ($ million)
Chart on Brazil - Year-over-year growth 2025-2030 (%)
Data Table on Brazil - Year-over-year growth 2025-2030 (%)

12.6.2 Argentina - Market size and forecast 2025-2030

Chart on Argentina - Market size and forecast 2025-2030 ($ million)
Data Table on Argentina - Market size and forecast 2025-2030 ($ million)
Chart on Argentina - Year-over-year growth 2025-2030 (%)
Data Table on Argentina - Year-over-year growth 2025-2030 (%)

12.6.3 Chile - Market size and forecast 2025-2030

Chart on Chile - Market size and forecast 2025-2030 ($ million)
Data Table on Chile - Market size and forecast 2025-2030 ($ million)
Chart on Chile - Year-over-year growth 2025-2030 (%)
Data Table on Chile - Year-over-year growth 2025-2030 (%)

12.7 Middle East and Africa - Market size and forecast 2025-2030

Chart on Middle East and Africa - Market size and forecast 2025-2030 ($ million)
Data Table on Middle East and Africa - Market size and forecast 2025-2030 ($ million)
Chart on Middle East and Africa - Year-over-year growth 2025-2030 (%)
Data Table on Middle East and Africa - Year-over-year growth 2025-2030 (%)
Chart on Regional Comparison - Middle East and Africa
Data Table on Regional Comparison - Middle East and Africa

12.7.1 Saudi Arabia - Market size and forecast 2025-2030

Chart on Saudi Arabia - Market size and forecast 2025-2030 ($ million)
Data Table on Saudi Arabia - Market size and forecast 2025-2030 ($ million)
Chart on Saudi Arabia - Year-over-year growth 2025-2030 (%)
Data Table on Saudi Arabia - Year-over-year growth 2025-2030 (%)

12.7.2 UAE - Market size and forecast 2025-2030

Chart on UAE - Market size and forecast 2025-2030 ($ million)
Data Table on UAE - Market size and forecast 2025-2030 ($ million)
Chart on UAE - Year-over-year growth 2025-2030 (%)
Data Table on UAE - Year-over-year growth 2025-2030 (%)

12.7.3 South Africa - Market size and forecast 2025-2030

Chart on South Africa - Market size and forecast 2025-2030 ($ million)
Data Table on South Africa - Market size and forecast 2025-2030 ($ million)
Chart on South Africa - Year-over-year growth 2025-2030 (%)
Data Table on South Africa - Year-over-year growth 2025-2030 (%)

12.7.4 Israel - Market size and forecast 2025-2030

Chart on Israel - Market size and forecast 2025-2030 ($ million)
Data Table on Israel - Market size and forecast 2025-2030 ($ million)
Chart on Israel - Year-over-year growth 2025-2030 (%)
Data Table on Israel - Year-over-year growth 2025-2030 (%)

12.7.5 Turkey - Market size and forecast 2025-2030

Chart on Turkey - Market size and forecast 2025-2030 ($ million)
Data Table on Turkey - Market size and forecast 2025-2030 ($ million)
Chart on Turkey - Year-over-year growth 2025-2030 (%)
Data Table on Turkey - Year-over-year growth 2025-2030 (%)

12.8 Market opportunity by geography

Market opportunity by geography ($ million)
Data Tables on Market opportunity by geography ($ million)

13. Drivers, Challenges, and Opportunity

13.1 Market drivers

Increasing adoption of advanced driver-assistance systems and vehicle safety technologies
Expansion of industrial automation and condition-monitoring infrastructure
Growing integration of motion sensing in consumer electronics and wearable devices

13.2 Market challenges

Complex calibration and performance validation requirements
Stringent compliance and certification burdens
Supply-chain dependence and raw material volatility

13.3 Impact of drivers and challenges

Impact of drivers and challenges in 2025 and 2030

13.4 Market opportunities

Shift toward sensor fusion and multi-functional motion sensing platforms
Movement toward edge-enabled intelligent sensing architectures
Rising focus on application-specific accelerometer design strategies

14. Competitive Landscape

14.1 Overview

14.2

Overview on criticality of inputs and factors of differentiation

14.3 Landscape disruption

Overview on factors of disruption

14.4 Industry risks

Impact of key risks on business

15. Competitive Analysis

15.1 Companies profiled

Companies covered

15.2 Company ranking index

15.3 Market positioning of companies

Matrix on companies position and classification

15.4 Analog Devices Inc.

Analog Devices Inc. - Overview
Analog Devices Inc. - Business segments
Analog Devices Inc. - Key offerings
Analog Devices Inc. - Segment focus
SWOT

15.5 Hansford Sensors Ltd.

Hansford Sensors Ltd. - Overview
Hansford Sensors Ltd. - Product / Service
Hansford Sensors Ltd. - Key offerings
SWOT

15.6 Honeywell International Inc.

Honeywell International Inc. - Overview
Honeywell International Inc. - Business segments
Honeywell International Inc. - Key news
Honeywell International Inc. - Key offerings
Honeywell International Inc. - Segment focus
SWOT

15.7 Hottinger Bruel and Kjaer GmbH

Hottinger Bruel and Kjaer GmbH - Overview
Hottinger Bruel and Kjaer GmbH - Product / Service
Hottinger Bruel and Kjaer GmbH - Key offerings
SWOT

15.8 Kistler Group

Kistler Group - Overview
Kistler Group - Product / Service
Kistler Group - Key offerings
SWOT

15.9 MEMSIC Semiconductor Co. Ltd.

MEMSIC Semiconductor Co. Ltd. - Overview
MEMSIC Semiconductor Co. Ltd. - Product / Service
MEMSIC Semiconductor Co. Ltd. - Key offerings
SWOT

15.10 Murata Manufacturing Co. Ltd.

Murata Manufacturing Co. Ltd. - Overview
Murata Manufacturing Co. Ltd. - Business segments
Murata Manufacturing Co. Ltd. - Key offerings
Murata Manufacturing Co. Ltd. - Segment focus
SWOT

15.11 NXP Semiconductors NV

NXP Semiconductors NV - Overview
NXP Semiconductors NV - Business segments
NXP Semiconductors NV - Key news
NXP Semiconductors NV - Key offerings
NXP Semiconductors NV - Segment focus
SWOT

15.12 PCB Piezotronics Inc.

PCB Piezotronics Inc. - Overview
PCB Piezotronics Inc. - Product / Service
PCB Piezotronics Inc. - Key offerings
SWOT

15.13 Robert Bosch GmbH

Robert Bosch GmbH - Overview
Robert Bosch GmbH - Product / Service
Robert Bosch GmbH - Key offerings
SWOT

15.14 ROHM Co. Ltd.

ROHM Co. Ltd. - Overview
ROHM Co. Ltd. - Business segments
ROHM Co. Ltd. - Key news
ROHM Co. Ltd. - Key offerings
ROHM Co. Ltd. - Segment focus
SWOT

15.15 Silicon Sensing Systems Ltd.

Silicon Sensing Systems Ltd. - Overview
Silicon Sensing Systems Ltd. - Product / Service
Silicon Sensing Systems Ltd. - Key offerings
SWOT

15.16 STMicroelectronics NV

STMicroelectronics NV - Overview
STMicroelectronics NV - Business segments
STMicroelectronics NV - Key news
STMicroelectronics NV - Key offerings
STMicroelectronics NV - Segment focus
SWOT

15.17 TDK Corp.

TDK Corp. - Overview
TDK Corp. - Business segments
TDK Corp. - Key offerings
TDK Corp. - Segment focus
SWOT

15.18 TE Connectivity plc

TE Connectivity plc - Overview
TE Connectivity plc - Business segments
TE Connectivity plc - Key offerings
TE Connectivity plc - Segment focus
SWOT

16. Appendix

16.1 Scope of the report

Market definition
Objectives
Notes and caveats

16.2 Inclusions and exclusions checklist

Inclusions checklist
Exclusions checklist

16.3 Currency conversion rates for US$

16.4 Research methodology

16.5 Data procurement

Information sources

16.6 Data validation

16.7 Validation techniques employed for market sizing

16.8 Data synthesis

16.9 360 degree market analysis

16.10 List of abbreviations

Research Methodology

Technavio presents a detailed picture of the market by way of study, synthesis, and summation of data from multiple sources. The analysts have presented the various facets of the market with a particular focus on identifying the key industry influencers. The data thus presented is comprehensive, reliable, and the result of extensive research, both primary and secondary.

INFORMATION SOURCES

Primary sources

  • Manufacturers and suppliers
  • Channel partners
  • Industry experts
  • Strategic decision makers

Secondary sources

  • Industry journals and periodicals
  • Government data
  • Financial reports of key industry players
  • Historical data
  • Press releases

DATA ANALYSIS

Data Synthesis

  • Collation of data
  • Estimation of key figures
  • Analysis of derived insights

Data Validation

  • Triangulation with data models
  • Reference against proprietary databases
  • Corroboration with industry experts

REPORT WRITING

Qualitative

  • Market drivers
  • Market challenges
  • Market trends
  • Five forces analysis

Quantitative

  • Market size and forecast
  • Market segmentation
  • Geographical insights
  • Competitive landscape

Interested in this report?

Get your sample now to see our research methodology and insights!

Download Now

Frequently Asked Questions

Accelerometers market growth will increase by USD 1026.8 million during 2026-2030.

The Accelerometers market is expected to grow at a CAGR of 5.1% during 2026-2030.

Accelerometers market is segmented by End-user (Industrial, Automotive, Consumer electronics, Aerospace and defense, Others) Technology (Capacitive, Piezoelectric, Piezoresistive, MEMS, Others) Product type (Tri-axis, Inertial measurement units, Dual-axis, Single-axis)

Analog Devices Inc., ASC GmbH, CEC Vibration Products, Gladiator Technologies Inc., Hansford Sensors Ltd., Honeywell International Inc., Hottinger Bruel and Kjaer GmbH, Kistler Group, MEMSIC Semiconductor Co. Ltd., Metra Mess und Frequenztechnik, Murata Manufacturing Co. Ltd., NXP Semiconductors NV, PCB Piezotronics Inc., Robert Bosch GmbH, ROHM Co. Ltd., Silicon Designs Inc., Silicon Sensing Systems Ltd., STMicroelectronics NV, TDK Corp., TE Connectivity plc, Wilcoxon Sensing Technologies are a few of the key vendors in the Accelerometers market.

North America will register the highest growth rate of 39% among the other regions. Therefore, the Accelerometers market in North America is expected to garner significant business opportunities for the vendors during the forecast period.

US, Canada, Mexico, Germany, UK, France, Italy, Spain, The Netherlands, China, Japan, India, South Korea, Australia, Indonesia, Brazil, Argentina, Chile, Saudi Arabia, UAE, South Africa, Israel, Turkey

  • Increasing adoption of advanced driver-assistance systems and vehicle safety technologies is the driving factor this market.

The Accelerometers market vendors should focus on grabbing business opportunities from the End-user segment as it accounted for the largest market share in the base year.
RIA - Research AI Assistant
Ask RIA
