Access Control Solutions Market Analysis, Size, and Forecast 2024-2028: North America (US and Canada), Europe (France, Germany, Italy, and UK), Middle East and Africa (Egypt, KSA, Oman, and UAE), APAC (China, India, and Japan), South America (Argentina and Brazil), and Rest of World (ROW)

Access Control Solutions Market Analysis, Size, and Forecast 2024-2028:
North America (US and Canada), Europe (France, Germany, Italy, and UK), Middle East and Africa (Egypt, KSA, Oman, and UAE), APAC (China, India, and Japan), South America (Argentina and Brazil), and Rest of World (ROW)

Published: Nov 2023 165 Pages SKU: IRTNTR76824

Market Overview at a Glance

$2.94 B
Market Opportunity
7.77%
CAGR
7.49
YoY growth 2023-2024(%)

Access Control Solutions Market Size 2024-2028

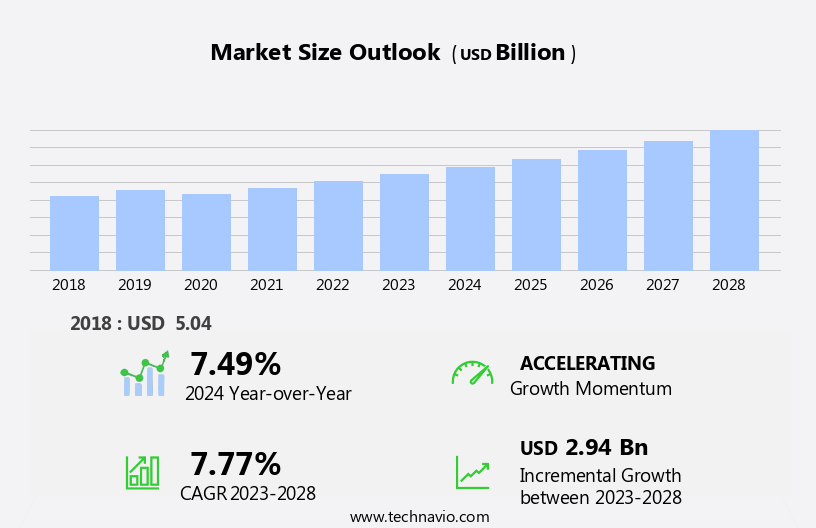
The access control solutions market size is forecast to increase by USD 2.94 billion, at a CAGR of 7.77% between 2023 and 2028.

  • The market is witnessing significant growth, driven by the increasing awareness of sophisticated data security threats. With the digital transformation of businesses and the proliferation of IoT devices, the need for robust access control systems has become paramount. Furthermore, governments worldwide are initiating projects to implement biometric access control systems, adding impetus to the market's expansion. However, the market faces challenges as well. The lack of technological awareness among organizations about access control solutions may hinder market penetration. Companies must invest in marketing efforts and education to increase market reach and address this challenge effectively.
  • The market is poised for growth, fueled by heightened security concerns and government initiatives, while facing challenges related to technological awareness. Companies seeking to capitalize on market opportunities must focus on marketing efforts and education to overcome these challenges and meet the evolving access control needs of businesses and governments.

What will be the Size of the Access Control Solutions Market during the forecast period?

Access Control Solutions Market Size

Explore in-depth regional segment analysis with market size data - historical 2018-2022 and forecasts 2024-2028 - in the full report.  
Request Free Sample

The market continues to evolve, with dynamic market activities unfolding across various sectors. Remote management capabilities enable organizations to monitor and manage access permissions from anywhere, while fingerprint scanning and biometric authentication add an extra layer of security. Centralized management systems allow for efficient control of multiple access points, and wireless access control and RFID tags offer convenience and flexibility. Access control integration with alarm systems, reporting and analytics, and mobile access control enhances security and facilitates real-time monitoring. Perimeter security solutions, multi-factor authentication, and threat detection further strengthen security measures. Access control policies, Physical Security, and audit trails ensure compliance with regulations and provide valuable data for risk assessment.

Security cameras, door controllers, and access control panels offer additional layers of protection, while support services, network access control, user management, and installation services ensure seamless implementation and maintenance. Authentication protocols, voice recognition, Bluetooth beacons, and incident response capabilities further enhance the functionality of access control systems. Door hardware, smart cards, proximity readers, deadbolt locks, security software, Iris Recognition, Facial Recognition, and card readers are integral components of comprehensive access control solutions. Compliance regulations continue to evolve, emphasizing the importance of ongoing adaptation and innovation in the market.

How is this Access Control Solutions Industry segmented?

The access control solutions industry research report provides comprehensive data (region-wise segment analysis), with forecasts and estimates in "USD billion" for the period 2024-2028, as well as historical data from 2018-2022 for the following segments.

  • Application
    • Accounts management and identity synchronization
    • Unified authentication
    • Others
  • End-user
    • Government
    • BFSI
    • Healthcare
    • Transportation
  • Component
    • Hardware (Readers, Controllers, Locks, Biometrics)
    • Software (Management Software, Analytics)
    • Services (Installation, Maintenance, Integration)
  • Technology
    • Biometric (Fingerprint, Facial, Iris, Voice)
    • Card-based (Proximity, Smart Card)
    • Keypad-based
    • Mobile-based
  • Deployment Model
    • On-Premise
    • Cloud-Based (ACaaS)
  • Geography
    • North America
      • US
      • Canada
    • Europe
      • France
      • Germany
      • Italy
      • UK
    • Middle East and Africa
      • Egypt
      • KSA
      • Oman
      • UAE
    • APAC
      • China
      • India
      • Japan
    • South America
      • Argentina
      • Brazil
    • Rest of World (ROW)

By Application Insights

The accounts management and identity synchronization segment is estimated to witness significant growth during the forecast period.

End-users in sectors such as government, healthcare, and financial services are increasingly focusing on managing access to confidential information and applications dispersed across internal and external systems. In response to this need, enterprises are embracing multi-channel user access, including cloud, social, and mobile platforms. Simultaneously, they must address business requirements like compliance and audit reporting. Access control solutions play a crucial role in mitigating risk and ensuring compliance by monitoring and securing user access in multi-perimeter environments. These solutions provide essential features like automated account provisioning, access request fulfillment, password management, and user access control to target systems.

Furthermore, advanced access control solutions offer capabilities such as biometric authentication, Video Surveillance, risk assessment, and centralized management. Access control systems employ various authentication protocols, including two-factor authentication and single sign-on, to enhance security. Additionally, network access control, user management, and access control integration are critical components of comprehensive access control solutions. Access control panels, support services, and installation services ensure seamless implementation and maintenance. Access control policies, door controllers, proximity readers, and smart cards are integral components of these systems. Compliance regulations mandate incident response, maintenance services, and access control training to maintain security and mitigate potential threats.

Access control solutions also integrate with alarm systems, perimeter security, and Threat Detection Systems to provide a holistic security approach. Wireless access control, RFID tags, Bluetooth beacons, and voice recognition are emerging technologies enhancing access control capabilities. In summary, access control solutions are essential for enterprises to secure their valuable applications and data, enforce security policies, and ensure business-driven identity governance in today's complex IT environments.

Access Control Solutions Market Size

Request Free Sample

The Accounts management and identity synchronization segment was valued at USD 2.14 billion in 2018 and showed a gradual increase during the forecast period.

Regional Analysis

Europe is estimated to contribute 35% to the growth of the global market during the forecast period.Technavio's analysts have elaborately explained the regional trends and drivers that shape the market during the forecast period.

Access Control Solutions Market Share by Geography

 Request Free Sample

The market in Europe is experiencing significant growth, driven by the early adoption of advanced technologies and a well-established end-user base. Advanced economies, such as Germany, France, and the United Kingdom, currently dominate the market due to their robust industrial sectors and high demand for security solutions. However, emerging economies, including Poland, Romania, and the Czech Republic, are poised to contribute significantly to the market's growth in the future. Technological innovations, such as cloud-based access control, biometric authentication, and remote management, are transforming the access control landscape. Two-factor authentication, video surveillance, and alarm systems provide an additional layer of security, while access control policies and compliance regulations ensure data privacy and security.

Centralized management systems, wireless access control, and mobile access control offer flexibility and convenience. Physical security measures, such as electric strikes, magnetic locks, and deadbolt locks, continue to be essential components of access control systems. Access control panels, door controllers, and authentication protocols ensure seamless integration of various security components. User management, incident response, and maintenance services ensure optimal system performance and user experience. Network access control, threat detection, and reporting and analytics provide valuable insights into system performance and potential vulnerabilities. Proximity readers, RFID tags, and smart cards offer contactless access control solutions. Multi-factor authentication, voice recognition, and facial recognition provide enhanced security and convenience.

The market in Europe is expected to witness high growth due to the increasing adoption of these advanced technologies across various industries, including BFSI, healthcare, and manufacturing. Compliance regulations, such as GDPR and HIPAA, are driving the demand for access control solutions that offer robust data encryption, audit trails, and incident response capabilities. Installation services and support services ensure seamless implementation and maintenance of access control solutions.

Market Dynamics

The Access Control Solutions Market is booming, driven by biometric access control and RFID access control for secure access solutions. Cloud-based access control and facial recognition systems enhance efficiency in the commercial access control market and healthcare access control market. Touchless access control and AI-driven access security cater to modern safety needs, while mobile-based access control and GDPR-compliant access solutions ensure flexibility and compliance. Key phrases like biometric access control for commercial buildings, RFID access control for data centers, cloud-based access control for smart cities, facial recognition systems for airport security, touchless access control for healthcare facilities, AI-driven access security for government buildings, mobile-based access control for residential properties, scalable access control systems for industrial facilities, GDPR-compliant access solutions for European businesses, and cost-effective access control for small businesses 2025 shape the industry's future.

Our researchers analyzed the data with 2023 as the base year, along with the key drivers, trends, and challenges. A holistic analysis of drivers will help companies refine their marketing strategies to gain a competitive advantage.

What are the key market drivers leading to the rise in the adoption of Access Control Solutions Industry?

  • The increasing recognition of complex data security risks serves as the primary catalyst for market growth. 
  • The market is witnessing significant growth due to the increasing threat of cyber-attacks and data breaches. As businesses increasingly rely on digital data and applications, securing access to these assets has become a top priority. Access control solutions offer a secure and convenient way to manage access to digital assets, providing businesses with expert security capabilities and technologies without the need for extensive investment and management of their own infrastructure. Two essential components of access control solutions are electric strikes and magnetic locks, which ensure physical security by controlling access to buildings and rooms. Additionally, intrusion detection systems, video surveillance, biometric authentication, and two-factor authentication provide an extra layer of security against unauthorized access.
  • Access control policies and audit trails help businesses maintain regulatory compliance and monitor access activity. Cloud-based access control solutions offer flexibility and scalability, allowing businesses to manage access to their digital assets from anywhere, at any time. Data encryption and audit trails ensure data security and compliance, while video surveillance provides an additional layer of security against potential threats. The market is expected to continue growing as businesses seek to mitigate the risks associated with digital data and applications.

What are the market trends shaping the Access Control Solutions Industry?

  • The implementation of biometric access control systems is becoming increasingly mandated by government initiatives, making it a prominent market trend. This shift towards advanced security measures is a professional and effective solution for enhancing access control and security.
  • Access control solutions have gained significant importance in securing facilities and enhancing operational efficiency. Remote management of these systems has become increasingly popular, enabling administrators to control access permissions from anywhere. Biometric technologies, such as fingerprint scanning and facial recognition, offer enhanced security by providing unique identification for each individual. Centralized management of access control systems allows for wireless access control using RFID tags and mobile devices, providing convenience and flexibility. Integration of access control systems with security cameras, alarm systems, and reporting and analytics tools enhances security and facilitates comprehensive monitoring. Perimeter security measures, including multi-factor authentication, add an extra layer of protection against unauthorized access.
  • The market is driven by the need for advanced security solutions and the increasing adoption of technology in various industries. Governments have prioritized the use of biometric access control systems for heightened security checks, particularly in airports, due to their ability to verify individuals based on behavioral and physiological characteristics. These systems offer a more reliable and efficient solution compared to traditional access control methods, ensuring a harmonious balance between security and productivity.

What challenges does the Access Control Solutions Industry face during its growth?

  • The absence of technological awareness regarding access control solutions poses a significant challenge to the industry's growth. Companies and organizations may struggle to implement effective security measures without understanding the latest advancements and benefits of access control technologies. This lack of knowledge can hinder progress and limit the potential for innovation within the industry. 
  • The market has faced challenges in the past due to limited awareness among end-users, resulting in slow adoption rates. Advanced access control systems, such as authentication protocols, access control panels, network access control, user management, voice recognition, Bluetooth beacons, single sign-on, and threat detection, were not widely recognized in various industries and organizations. This trend was more pronounced in emerging economies. However, as technology advances, the market is poised for growth during the forecast period. A common misconception exists regarding the implementation and management costs of these systems. Despite the benefits of enhanced security and improved user experience, some organizations have been hesitant to invest in access control solutions due to perceived high costs.
  • However, as technology continues to evolve and become more cost-effective, the market is expected to expand and offer significant value to businesses worldwide. Access control systems, including door controllers and proximity readers, play a crucial role in securing facilities and protecting valuable assets. By implementing these solutions, organizations can streamline their security processes, minimize risks, and ensure the safety of their employees and customers.

Exclusive Customer Landscape

The access control solutions market forecasting report includes the adoption lifecycle of the market, covering from the innovator's stage to the laggard's stage. It focuses on adoption rates in different regions based on penetration. Furthermore, the access control solutions market report also includes key purchase criteria and drivers of price sensitivity to help companies evaluate and develop their market growth analysis strategies.
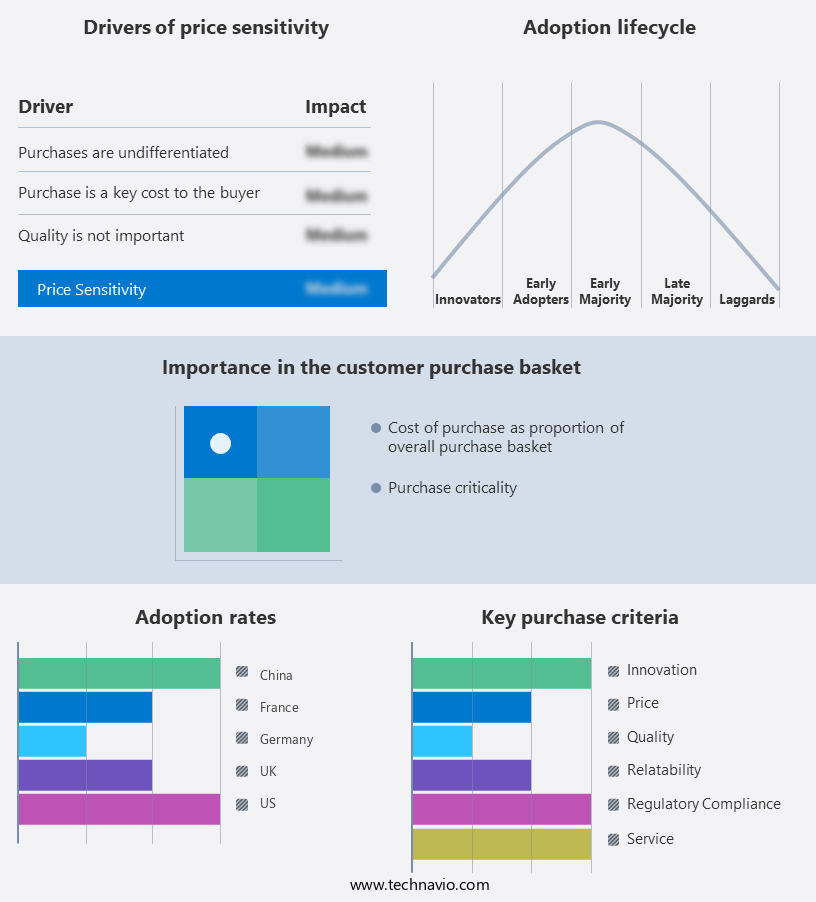
Access Control Solutions Market Share by Geography

 Customer Landscape

Key Companies & Market Insights

Companies are implementing various strategies, such as strategic alliances, access control solutions market forecast, partnerships, mergers and acquisitions, geographical expansion, and product/service launches, to enhance their presence in the industry.

ASSA ABLOY AB - This company specializes in access control systems, providing innovative solutions such as Cliq, SMARTair, Incedo Business, and Aperio. Their offerings ensure secure and efficient entry management for various industries. The solutions are designed to integrate seamlessly with diverse business environments, enhancing security and convenience.

The industry research and growth report includes detailed analyses of the competitive landscape of the market and information about key companies, including:

  • ASSA ABLOY AB
  • Brivo Inc.
  • Broadcom Inc.
  • Centrify Corp.
  • Cisco Systems Inc.
  • Cloudastructure Inc.
  • Datawatch Systems Inc.
  • dormakaba Holding AG
  • Feenics Inc.
  • Honeywell International Inc.
  • International Business Machines Corp.
  • M3T Corp.
  • Microsoft Corp.
  • Motorola Solutions Inc.
  • Okta Inc.
  • Oracle Corp.
  • Ping Identity Corp.
  • SecureAuth Corp.
  • Thales Group
  • Vector Security Inc.

Qualitative and quantitative analysis of companies has been conducted to help clients understand the wider business environment as well as the strengths and weaknesses of key industry players. Data is qualitatively analyzed to categorize companies as pure play, category-focused, industry-focused, and diversified; it is quantitatively analyzed to categorize companies as dominant, leading, strong, tentative, and weak.

Recent Development and News in Access Control Solutions Market

  • In January 2024, HID Global, a leading provider of trusted identity solutions, announced the launch of its new Seos-enabled access control readers, expanding its Seos platform's capabilities to include contactless smart card technology (HID Global Press Release, 2024). This development aimed to meet the growing demand for touchless access control systems in response to the COVID-19 pandemic.
  • In March 2024, Tyco International plc, a leading provider of security products and services, entered into a strategic partnership with Bosch Building Technologies to offer integrated security and building automation solutions. The collaboration aimed to provide customers with a more comprehensive and efficient security solution, combining access control, video surveillance, and building management systems (Tyco International Press Release, 2024).
  • In May 2024, LenelS2, a global leader in advanced security systems, raised USD100 million in a funding round led by Blackstone Growth. The investment will support LenelS2's continued growth and product development, particularly in the areas of cloud services and artificial intelligence (LenelS2 Press Release, 2024).
  • In January 2025, the European Union Agency for Cybersecurity (ENISA) published new guidelines for secure implementation of access control systems in critical infrastructure. The guidelines aim to strengthen cybersecurity measures and protect against potential threats, including insider attacks and cyber-physical risks (ENISA Press Release, 2025).

Research Analyst Overview

  • In the dynamic market, various technologies and trends are shaping the industry's future. Blockchain technology is revolutionizing access control by providing secure, decentralized solutions for managing identities and permissions. Remote monitoring and real-time analytics enable organizations to detect and respond to security threats in real-time. APIs facilitate seamless integration with other systems, such as inventory management and data analytics. Multi-tenant access control caters to the needs of organizations with multiple clients or departments, while asset tracking ensures accountability and security. User behavior analytics and AI-powered access control provide advanced security features, including predictive analytics and tailgate detection.
  • Open standards and IoT integration enable interoperability and connectivity across various systems, from parking access control and elevator access to man-trap systems and boom gates. Security audits, Penetration Testing, vulnerability assessments, and incident management are essential components of a comprehensive access control strategy. Role-based access control and employee management streamline access and permissions for workforce members, while emergency response and visitor management ensure safety and compliance. Zone-based access control and time-based access control offer granular control and flexibility for organizations. Behavioral biometrics and predictive analytics enhance security by identifying anomalous user behavior and potential threats.

Dive into Technavio's robust research methodology, blending expert interviews, extensive data synthesis, and validated models for unparalleled Access Control Solutions Market insights. See full methodology.

Market Scope

Report Coverage

Details

Page number

165

Base year

2023

Historic period

2018-2022

Forecast period

2024-2028

Growth momentum & CAGR

Accelerate at a CAGR of 7.77%

Market growth 2024-2028

USD 2.94 billion

Market structure

Fragmented

YoY growth 2023-2024(%)

7.49

Key countries

US, Canada, Germany, UK, Italy, France, China, India, Japan, Brazil, Egypt, UAE, Oman, Argentina, KSA, UAE, Brazil, and Rest of World (ROW)

Competitive landscape

Leading Companies, Market Positioning of Companies, Competitive Strategies, and Industry Risks

Request Free Sample

What are the Key Data Covered in this Access Control Solutions Market Research and Growth Report?

  • CAGR of the Access Control Solutions industry during the forecast period
  • Detailed information on factors that will drive the growth and forecasting between 2024 and 2028
  • Precise estimation of the size of the market and its contribution of the industry in focus to the parent market
  • Accurate predictions about upcoming growth and trends and changes in consumer behaviour
  • Growth of the market across Europe, North America, APAC, Middle East and Africa, and South America
  • Thorough analysis of the market's competitive landscape and detailed information about companies
  • Comprehensive analysis of factors that will challenge the access control solutions market growth of industry companies

We can help! Our analysts can customize this access control solutions market research report to meet your requirements.

Get in touch

1 Executive Summary

  • 1.1 Market overview
    • Exhibit 01: Executive Summary – Chart on Market Overview
    • Exhibit 02: Executive Summary – Data Table on Market Overview
    • Exhibit 03: Executive Summary – Chart on Global Market Characteristics
    • Exhibit 04: Executive Summary – Chart on Market by Geography
    • Exhibit 05: Executive Summary – Chart on Market Segmentation by Application
    • Exhibit 06: Executive Summary – Chart on Market Segmentation by End-user
    • Exhibit 07: Executive Summary – Chart on Incremental Growth
    • Exhibit 08: Executive Summary – Data Table on Incremental Growth
    • Exhibit 09: Executive Summary – Chart on Vendor Market Positioning

2 Market Landscape

  • 2.1 Market ecosystem
    • Exhibit 10: Parent market
    • Exhibit 11: Market Characteristics

3 Market Sizing

  • 3.1 Market definition
    • Exhibit 12: Offerings of vendors included in the market definition
  • 3.2 Market segment analysis
    • Exhibit 13: Market segments
  • 3.3 Market size 2023
    • 3.4 Market outlook: Forecast for 2023-2028
      • Exhibit 14: Chart on Global - Market size and forecast 2023-2028 ($ million)
      • Exhibit 15: Data Table on Global - Market size and forecast 2023-2028 ($ million)
      • Exhibit 16: Chart on Global Market: Year-over-year growth 2023-2028 (%)
      • Exhibit 17: Data Table on Global Market: Year-over-year growth 2023-2028 (%)

    4 Historic Market Size

    • 4.1 Global access control solutions market 2018 - 2022
      • Exhibit 18: Historic Market Size – Data Table on global access control solutions market 2018 - 2022 ($ million)
    • 4.2 Application Segment Analysis 2018 - 2022
      • Exhibit 19: Historic Market Size – Application Segment 2018 - 2022 ($ million)
    • 4.3 End-user Segment Analysis 2018 - 2022
      • Exhibit 20: Historic Market Size – End-user Segment 2018 - 2022 ($ million)
    • 4.4 Geography Segment Analysis 2018 - 2022
      • Exhibit 21: Historic Market Size – Geography Segment 2018 - 2022 ($ million)
    • 4.5 Country Segment Analysis 2018 - 2022
      • Exhibit 22: Historic Market Size – Country Segment 2018 - 2022 ($ million)

    5 Five Forces Analysis

    • 5.1 Five forces summary
      • Exhibit 23: Five forces analysis - Comparison between 2023 and 2028
    • 5.2 Bargaining power of buyers
      • Exhibit 24: Chart on Bargaining power of buyers – Impact of key factors 2023 and 2028
    • 5.3 Bargaining power of suppliers
      • Exhibit 25: Bargaining power of suppliers – Impact of key factors in 2023 and 2028
    • 5.4 Threat of new entrants
      • Exhibit 26: Threat of new entrants – Impact of key factors in 2023 and 2028
    • 5.5 Threat of substitutes
      • Exhibit 27: Threat of substitutes – Impact of key factors in 2023 and 2028
    • 5.6 Threat of rivalry
      • Exhibit 28: Threat of rivalry – Impact of key factors in 2023 and 2028
    • 5.7 Market condition
      • Exhibit 29: Chart on Market condition - Five forces 2023 and 2028

    6 Market Segmentation by Application

    • 6.1 Market segments
      • Chart on Application - Market share (2023-2028) (%)
      • Data Table on Application - Market share (2023-2028) (%)
    • 6.2 Comparison by Application
      • Chart on Comparison by Application
      • Data Table on Comparison by Application
    • 6.3 Accounts management and identity synchronization - Market size and forecast (2023-2028)
      • Chart on Accounts management and identity synchronization - Market size and forecast (2023-2028) ($ million)
      • Data Table on Accounts management and identity synchronization - Market size and forecast (2023-2028) ($ million)
      • Chart on Accounts management and identity synchronization - Year-over-year growth (2023-2028) (%)
      • Data Table on Accounts management and identity synchronization - Year-over-year growth (2023-2028) (%)
    • 6.4 Unified authentication - Market size and forecast (2023-2028)
      • Chart on Unified authentication - Market size and forecast (2023-2028) ($ million)
      • Data Table on Unified authentication - Market size and forecast (2023-2028) ($ million)
      • Chart on Unified authentication - Year-over-year growth (2023-2028) (%)
      • Data Table on Unified authentication - Year-over-year growth (2023-2028) (%)
    • 6.5 Others - Market size and forecast (2023-2028)
      • Chart on Others - Market size and forecast (2023-2028) ($ million)
      • Data Table on Others - Market size and forecast (2023-2028) ($ million)
      • Chart on Others - Year-over-year growth (2023-2028) (%)
      • Data Table on Others - Year-over-year growth (2023-2028) (%)
    • 6.6 Market opportunity by Application
      • Market opportunity by Application ($ million)
      • Data Table on Market opportunity by Application ($ million)

    7 Market Segmentation by End-user

    • 7.1 Market segments
      • Chart on End-user - Market share (2023-2028) (%)
      • Data Table on End-user - Market share (2023-2028) (%)
    • 7.2 Comparison by End-user
      • Chart on Comparison by End-user
      • Data Table on Comparison by End-user
    • 7.3 Government - Market size and forecast (2023-2028)
      • Chart on Government - Market size and forecast (2023-2028) ($ million)
      • Data Table on Government - Market size and forecast (2023-2028) ($ million)
      • Chart on Government - Year-over-year growth (2023-2028) (%)
      • Data Table on Government - Year-over-year growth (2023-2028) (%)
    • 7.4 BFSI - Market size and forecast (2023-2028)
      • Chart on BFSI - Market size and forecast (2023-2028) ($ million)
      • Data Table on BFSI - Market size and forecast (2023-2028) ($ million)
      • Chart on BFSI - Year-over-year growth (2023-2028) (%)
      • Data Table on BFSI - Year-over-year growth (2023-2028) (%)
    • 7.5 Healthcare - Market size and forecast (2023-2028)
      • Chart on Healthcare - Market size and forecast (2023-2028) ($ million)
      • Data Table on Healthcare - Market size and forecast (2023-2028) ($ million)
      • Chart on Healthcare - Year-over-year growth (2023-2028) (%)
      • Data Table on Healthcare - Year-over-year growth (2023-2028) (%)
    • 7.6 Transportation - Market size and forecast (2023-2028)
      • Chart on Transportation - Market size and forecast (2023-2028) ($ million)
      • Data Table on Transportation - Market size and forecast (2023-2028) ($ million)
      • Chart on Transportation - Year-over-year growth (2023-2028) (%)
      • Data Table on Transportation - Year-over-year growth (2023-2028) (%)
    • 7.7 Market opportunity by End-user
      • Market opportunity by End-user ($ million)
      • Data Table on Market opportunity by End-user ($ million)

    8 Market Segmentation by Component

    • 8.1 Market segments
      • Chart on Component - Market share (2023-2028) (%)
      • Data Table on Component - Market share (2023-2028) (%)
    • 8.2 Comparison by Component
      • Chart on Comparison by Component
      • Data Table on Comparison by Component
    • 8.3 Hardware (Readers, Controllers, Locks, Biometrics) - Market size and forecast (2023-2028)
      • Chart on Hardware (Readers, Controllers, Locks, Biometrics) - Market size and forecast (2023-2028) ($ million)
      • Data Table on Hardware (Readers, Controllers, Locks, Biometrics) - Market size and forecast (2023-2028) ($ million)
      • Chart on Hardware (Readers, Controllers, Locks, Biometrics) - Year-over-year growth (2023-2028) (%)
      • Data Table on Hardware (Readers, Controllers, Locks, Biometrics) - Year-over-year growth (2023-2028) (%)
    • 8.4 Software (Management Software, Analytics) - Market size and forecast (2023-2028)
      • Chart on Software (Management Software, Analytics) - Market size and forecast (2023-2028) ($ million)
      • Data Table on Software (Management Software, Analytics) - Market size and forecast (2023-2028) ($ million)
      • Chart on Software (Management Software, Analytics) - Year-over-year growth (2023-2028) (%)
      • Data Table on Software (Management Software, Analytics) - Year-over-year growth (2023-2028) (%)
    • 8.5 Services (Installation, Maintenance, Integration) - Market size and forecast (2023-2028)
      • Chart on Services (Installation, Maintenance, Integration) - Market size and forecast (2023-2028) ($ million)
      • Data Table on Services (Installation, Maintenance, Integration) - Market size and forecast (2023-2028) ($ million)
      • Chart on Services (Installation, Maintenance, Integration) - Year-over-year growth (2023-2028) (%)
      • Data Table on Services (Installation, Maintenance, Integration) - Year-over-year growth (2023-2028) (%)
    • 8.6 Market opportunity by Component
      • Market opportunity by Component ($ million)
      • Data Table on Market opportunity by Component ($ million)

    9 Market Segmentation by Technology

    • 9.1 Market segments
      • Chart on Technology - Market share (2023-2028) (%)
      • Data Table on Technology - Market share (2023-2028) (%)
    • 9.2 Comparison by Technology
      • Chart on Comparison by Technology
      • Data Table on Comparison by Technology
    • 9.3 Biometric (Fingerprint, Facial, Iris, Voice) - Market size and forecast (2023-2028)
      • Chart on Biometric (Fingerprint, Facial, Iris, Voice) - Market size and forecast (2023-2028) ($ million)
      • Data Table on Biometric (Fingerprint, Facial, Iris, Voice) - Market size and forecast (2023-2028) ($ million)
      • Chart on Biometric (Fingerprint, Facial, Iris, Voice) - Year-over-year growth (2023-2028) (%)
      • Data Table on Biometric (Fingerprint, Facial, Iris, Voice) - Year-over-year growth (2023-2028) (%)
    • 9.4 Card-based (Proximity, Smart Card) - Market size and forecast (2023-2028)
      • Chart on Card-based (Proximity, Smart Card) - Market size and forecast (2023-2028) ($ million)
      • Data Table on Card-based (Proximity, Smart Card) - Market size and forecast (2023-2028) ($ million)
      • Chart on Card-based (Proximity, Smart Card) - Year-over-year growth (2023-2028) (%)
      • Data Table on Card-based (Proximity, Smart Card) - Year-over-year growth (2023-2028) (%)
    • 9.5 Keypad-based - Market size and forecast (2023-2028)
      • Chart on Keypad-based - Market size and forecast (2023-2028) ($ million)
      • Data Table on Keypad-based - Market size and forecast (2023-2028) ($ million)
      • Chart on Keypad-based - Year-over-year growth (2023-2028) (%)
      • Data Table on Keypad-based - Year-over-year growth (2023-2028) (%)
    • 9.6 Mobile-based - Market size and forecast (2023-2028)
      • Chart on Mobile-based - Market size and forecast (2023-2028) ($ million)
      • Data Table on Mobile-based - Market size and forecast (2023-2028) ($ million)
      • Chart on Mobile-based - Year-over-year growth (2023-2028) (%)
      • Data Table on Mobile-based - Year-over-year growth (2023-2028) (%)
    • 9.7 Market opportunity by Technology
      • Market opportunity by Technology ($ million)
      • Data Table on Market opportunity by Technology ($ million)

    10 Market Segmentation by Deployment Model

    • 10.1 Market segments
      • Chart on Deployment Model - Market share (2023-2028) (%)
      • Data Table on Deployment Model - Market share (2023-2028) (%)
    • 10.2 Comparison by Deployment Model
      • Chart on Comparison by Deployment Model
      • Data Table on Comparison by Deployment Model
    • 10.3 On-Premise - Market size and forecast (2023-2028)
      • Chart on On-Premise - Market size and forecast (2023-2028) ($ million)
      • Data Table on On-Premise - Market size and forecast (2023-2028) ($ million)
      • Chart on On-Premise - Year-over-year growth (2023-2028) (%)
      • Data Table on On-Premise - Year-over-year growth (2023-2028) (%)
    • 10.4 Cloud-Based (ACaaS) - Market size and forecast (2023-2028)
      • Chart on Cloud-Based (ACaaS) - Market size and forecast (2023-2028) ($ million)
      • Data Table on Cloud-Based (ACaaS) - Market size and forecast (2023-2028) ($ million)
      • Chart on Cloud-Based (ACaaS) - Year-over-year growth (2023-2028) (%)
      • Data Table on Cloud-Based (ACaaS) - Year-over-year growth (2023-2028) (%)
    • 10.5 Market opportunity by Deployment Model
      • Market opportunity by Deployment Model ($ million)
      • Data Table on Market opportunity by Deployment Model ($ million)

    8 Customer Landscape

    • 8.1 Customer landscape overview
      • Exhibit 70: Analysis of price sensitivity, lifecycle, customer purchase basket, adoption rates, and purchase criteria

    9 Geographic Landscape

    • 9.1 Geographic segmentation
      • Exhibit 71: Chart on Market share by geography 2023-2028 (%)
      • Exhibit 72: Data Table on Market share by geography 2023-2028 (%)
    • 9.2 Geographic comparison
      • Exhibit 73: Chart on Geographic comparison
      • Exhibit 74: Data Table on Geographic comparison
    • 9.3 Europe - Market size and forecast 2023-2028
      • Exhibit 75: Chart on Europe - Market size and forecast 2023-2028 ($ million)
      • Exhibit 76: Data Table on Europe - Market size and forecast 2023-2028 ($ million)
      • Exhibit 77: Chart on Europe - Year-over-year growth 2023-2028 (%)
      • Exhibit 78: Data Table on Europe - Year-over-year growth 2023-2028 (%)
    • 9.4 North America - Market size and forecast 2023-2028
      • Exhibit 79: Chart on North America - Market size and forecast 2023-2028 ($ million)
      • Exhibit 80: Data Table on North America - Market size and forecast 2023-2028 ($ million)
      • Exhibit 81: Chart on North America - Year-over-year growth 2023-2028 (%)
      • Exhibit 82: Data Table on North America - Year-over-year growth 2023-2028 (%)
    • 9.5 APAC - Market size and forecast 2023-2028
      • Exhibit 83: Chart on APAC - Market size and forecast 2023-2028 ($ million)
      • Exhibit 84: Data Table on APAC - Market size and forecast 2023-2028 ($ million)
      • Exhibit 85: Chart on APAC - Year-over-year growth 2023-2028 (%)
      • Exhibit 86: Data Table on APAC - Year-over-year growth 2023-2028 (%)
    • 9.6 Middle East and Africa - Market size and forecast 2023-2028
      • Exhibit 87: Chart on Middle East and Africa - Market size and forecast 2023-2028 ($ million)
      • Exhibit 88: Data Table on Middle East and Africa - Market size and forecast 2023-2028 ($ million)
      • Exhibit 89: Chart on Middle East and Africa - Year-over-year growth 2023-2028 (%)
      • Exhibit 90: Data Table on Middle East and Africa - Year-over-year growth 2023-2028 (%)
    • 9.7 South America - Market size and forecast 2023-2028
      • Exhibit 91: Chart on South America - Market size and forecast 2023-2028 ($ million)
      • Exhibit 92: Data Table on South America - Market size and forecast 2023-2028 ($ million)
      • Exhibit 93: Chart on South America - Year-over-year growth 2023-2028 (%)
      • Exhibit 94: Data Table on South America - Year-over-year growth 2023-2028 (%)
    • 9.8 US - Market size and forecast 2023-2028
      • Exhibit 95: Chart on US - Market size and forecast 2023-2028 ($ million)
      • Exhibit 96: Data Table on US - Market size and forecast 2023-2028 ($ million)
      • Exhibit 97: Chart on US - Year-over-year growth 2023-2028 (%)
      • Exhibit 98: Data Table on US - Year-over-year growth 2023-2028 (%)
    • 9.9 Germany - Market size and forecast 2023-2028
      • Exhibit 99: Chart on Germany - Market size and forecast 2023-2028 ($ million)
      • Exhibit 100: Data Table on Germany - Market size and forecast 2023-2028 ($ million)
      • Exhibit 101: Chart on Germany - Year-over-year growth 2023-2028 (%)
      • Exhibit 102: Data Table on Germany - Year-over-year growth 2023-2028 (%)
    • 9.10 China - Market size and forecast 2023-2028
      • Exhibit 103: Chart on China - Market size and forecast 2023-2028 ($ million)
      • Exhibit 104: Data Table on China - Market size and forecast 2023-2028 ($ million)
      • Exhibit 105: Chart on China - Year-over-year growth 2023-2028 (%)
      • Exhibit 106: Data Table on China - Year-over-year growth 2023-2028 (%)
    • 9.11 France - Market size and forecast 2023-2028
      • Exhibit 107: Chart on France - Market size and forecast 2023-2028 ($ million)
      • Exhibit 108: Data Table on France - Market size and forecast 2023-2028 ($ million)
      • Exhibit 109: Chart on France - Year-over-year growth 2023-2028 (%)
      • Exhibit 110: Data Table on France - Year-over-year growth 2023-2028 (%)
    • 9.12 UK - Market size and forecast 2023-2028
      • Exhibit 111: Chart on UK - Market size and forecast 2023-2028 ($ million)
      • Exhibit 112: Data Table on UK - Market size and forecast 2023-2028 ($ million)
      • Exhibit 113: Chart on UK - Year-over-year growth 2023-2028 (%)
      • Exhibit 114: Data Table on UK - Year-over-year growth 2023-2028 (%)
    • 9.13 Market opportunity by geography
      • Exhibit 115: Market opportunity by geography ($ million)
      • Exhibit 116: Data Tables on Market opportunity by geography ($ million)
    • 12.14 Canada - Market size and forecast (2023-2028)
      • Chart on Canada - Market size and forecast (2023-2028) ($ million)
      • Data Table on Canada - Market size and forecast (2023-2028) ($ million)
      • Chart on Canada - Year-over-year growth (2023-2028) (%)
      • Data Table on Canada - Year-over-year growth (2023-2028) (%)
    • 12.15 Italy - Market size and forecast (2023-2028)
      • Chart on Italy - Market size and forecast (2023-2028) ($ million)
      • Data Table on Italy - Market size and forecast (2023-2028) ($ million)
      • Chart on Italy - Year-over-year growth (2023-2028) (%)
      • Data Table on Italy - Year-over-year growth (2023-2028) (%)
    • 12.16 India - Market size and forecast (2023-2028)
      • Chart on India - Market size and forecast (2023-2028) ($ million)
      • Data Table on India - Market size and forecast (2023-2028) ($ million)
      • Chart on India - Year-over-year growth (2023-2028) (%)
      • Data Table on India - Year-over-year growth (2023-2028) (%)
    • 12.17 Japan - Market size and forecast (2023-2028)
      • Chart on Japan - Market size and forecast (2023-2028) ($ million)
      • Data Table on Japan - Market size and forecast (2023-2028) ($ million)
      • Chart on Japan - Year-over-year growth (2023-2028) (%)
      • Data Table on Japan - Year-over-year growth (2023-2028) (%)
    • 12.18 Brazil - Market size and forecast (2023-2028)
      • Chart on Brazil - Market size and forecast (2023-2028) ($ million)
      • Data Table on Brazil - Market size and forecast (2023-2028) ($ million)
      • Chart on Brazil - Year-over-year growth (2023-2028) (%)
      • Data Table on Brazil - Year-over-year growth (2023-2028) (%)
    • 12.19 Egypt - Market size and forecast (2023-2028)
      • Chart on Egypt - Market size and forecast (2023-2028) ($ million)
      • Data Table on Egypt - Market size and forecast (2023-2028) ($ million)
      • Chart on Egypt - Year-over-year growth (2023-2028) (%)
      • Data Table on Egypt - Year-over-year growth (2023-2028) (%)
    • 12.20 UAE - Market size and forecast (2023-2028)
      • Chart on UAE - Market size and forecast (2023-2028) ($ million)
      • Data Table on UAE - Market size and forecast (2023-2028) ($ million)
      • Chart on UAE - Year-over-year growth (2023-2028) (%)
      • Data Table on UAE - Year-over-year growth (2023-2028) (%)
    • 12.21 Oman - Market size and forecast (2023-2028)
      • Chart on Oman - Market size and forecast (2023-2028) ($ million)
      • Data Table on Oman - Market size and forecast (2023-2028) ($ million)
      • Chart on Oman - Year-over-year growth (2023-2028) (%)
      • Data Table on Oman - Year-over-year growth (2023-2028) (%)
    • 12.22 Argentina - Market size and forecast (2023-2028)
      • Chart on Argentina - Market size and forecast (2023-2028) ($ million)
      • Data Table on Argentina - Market size and forecast (2023-2028) ($ million)
      • Chart on Argentina - Year-over-year growth (2023-2028) (%)
      • Data Table on Argentina - Year-over-year growth (2023-2028) (%)
    • 12.23 KSA - Market size and forecast (2023-2028)
      • Chart on KSA - Market size and forecast (2023-2028) ($ million)
      • Data Table on KSA - Market size and forecast (2023-2028) ($ million)
      • Chart on KSA - Year-over-year growth (2023-2028) (%)
      • Data Table on KSA - Year-over-year growth (2023-2028) (%)
    • 12.24 Rest of World (ROW) - Market size and forecast (2023-2028)
      • Chart on Rest of World (ROW) - Market size and forecast (2023-2028) ($ million)
      • Data Table on Rest of World (ROW) - Market size and forecast (2023-2028) ($ million)
      • Chart on Rest of World (ROW) - Year-over-year growth (2023-2028) (%)
      • Data Table on Rest of World (ROW) - Year-over-year growth (2023-2028) (%)

    10 Drivers, Challenges, and Trends

    • 10.1 Market drivers
      • 10.2 Market challenges
        • 10.3 Impact of drivers and challenges
          • Exhibit 117: Impact of drivers and challenges in 2023 and 2028
        • 10.4 Market trends

          11 Vendor Landscape

          • 11.1 Overview
            • 11.2 Vendor landscape
              • Exhibit 118: Overview on Criticality of inputs and Factors of differentiation
            • 11.3 Landscape disruption
              • Exhibit 119: Overview on factors of disruption
            • 11.4 Industry risks
              • Exhibit 120: Impact of key risks on business

            12 Vendor Analysis

            • 12.1 Vendors covered
              • Exhibit 121: Vendors covered
            • 12.2 Market positioning of vendors
              • Exhibit 122: Matrix on vendor position and classification
            • 12.3 ASSA ABLOY AB
              • Exhibit 123: ASSA ABLOY AB - Overview
              • Exhibit 124: ASSA ABLOY AB - Business segments
              • Exhibit 125: ASSA ABLOY AB - Key news
              • Exhibit 126: ASSA ABLOY AB - Key offerings
              • Exhibit 127: ASSA ABLOY AB - Segment focus
            • 12.4 Brivo Inc.
              • Exhibit 128: Brivo Inc. - Overview
              • Exhibit 129: Brivo Inc. - Product / Service
              • Exhibit 130: Brivo Inc. - Key offerings
            • 12.5 Broadcom Inc.
              • Exhibit 131: Broadcom Inc. - Overview
              • Exhibit 132: Broadcom Inc. - Business segments
              • Exhibit 133: Broadcom Inc. - Key news
              • Exhibit 134: Broadcom Inc. - Key offerings
              • Exhibit 135: Broadcom Inc. - Segment focus
            • 12.6 Centrify Corp.
              • Exhibit 136: Centrify Corp. - Overview
              • Exhibit 137: Centrify Corp. - Product / Service
              • Exhibit 138: Centrify Corp. - Key offerings
            • 12.7 Cloudastructure Inc.
              • Exhibit 139: Cloudastructure Inc. - Overview
              • Exhibit 140: Cloudastructure Inc. - Product / Service
              • Exhibit 141: Cloudastructure Inc. - Key offerings
            • 12.8 Datawatch Systems Inc.
              • Exhibit 142: Datawatch Systems Inc. - Overview
              • Exhibit 143: Datawatch Systems Inc. - Product / Service
              • Exhibit 144: Datawatch Systems Inc. - Key offerings
            • 12.9 dormakaba Holding AG
              • Exhibit 145: dormakaba Holding AG - Overview
              • Exhibit 146: dormakaba Holding AG - Business segments
              • Exhibit 147: dormakaba Holding AG - Key offerings
              • Exhibit 148: dormakaba Holding AG - Segment focus
            • 12.10 Feenics Inc.
              • Exhibit 149: Feenics Inc. - Overview
              • Exhibit 150: Feenics Inc. - Product / Service
              • Exhibit 151: Feenics Inc. - Key offerings
            • 12.11 Honeywell International Inc.
              • Exhibit 152: Honeywell International Inc. - Overview
              • Exhibit 153: Honeywell International Inc. - Business segments
              • Exhibit 154: Honeywell International Inc. - Key news
              • Exhibit 155: Honeywell International Inc. - Key offerings
              • Exhibit 156: Honeywell International Inc. - Segment focus
            • 12.12 International Business Machines Corp.
              • Exhibit 157: International Business Machines Corp. - Overview
              • Exhibit 158: International Business Machines Corp. - Business segments
              • Exhibit 159: International Business Machines Corp. - Key news
              • Exhibit 160: International Business Machines Corp. - Key offerings
              • Exhibit 161: International Business Machines Corp. - Segment focus
            • 12.13 Microsoft Corp.
              • Exhibit 162: Microsoft Corp. - Overview
              • Exhibit 163: Microsoft Corp. - Business segments
              • Exhibit 164: Microsoft Corp. - Key news
              • Exhibit 165: Microsoft Corp. - Key offerings
              • Exhibit 166: Microsoft Corp. - Segment focus
            • 12.14 Motorola Solutions Inc.
              • Exhibit 167: Motorola Solutions Inc. - Overview
              • Exhibit 168: Motorola Solutions Inc. - Business segments
              • Exhibit 169: Motorola Solutions Inc. - Key offerings
              • Exhibit 170: Motorola Solutions Inc. - Segment focus
            • 12.15 Oracle Corp.
              • Exhibit 171: Oracle Corp. - Overview
              • Exhibit 172: Oracle Corp. - Business segments
              • Exhibit 173: Oracle Corp. - Key news
              • Exhibit 174: Oracle Corp. - Key offerings
              • Exhibit 175: Oracle Corp. - Segment focus
            • 12.16 Thales Group
              • Exhibit 176: Thales Group - Overview
              • Exhibit 177: Thales Group - Business segments
              • Exhibit 178: Thales Group - Key news
              • Exhibit 179: Thales Group - Key offerings
              • Exhibit 180: Thales Group - Segment focus
            • 12.17 Vector Security Inc.
              • Exhibit 181: Vector Security Inc. - Overview
              • Exhibit 182: Vector Security Inc. - Product / Service
              • Exhibit 183: Vector Security Inc. - Key offerings

            13 Appendix

            • 13.1 Scope of the report
              • 13.2 Inclusions and exclusions checklist
                • Exhibit 184: Inclusions checklist
                • Exhibit 185: Exclusions checklist
              • 13.3 Currency conversion rates for US$
                • Exhibit 186: Currency conversion rates for US$
              • 13.4 Research methodology
                • Exhibit 187: Research methodology
                • Exhibit 188: Validation techniques employed for market sizing
                • Exhibit 189: Information sources
              • 13.5 List of abbreviations
                • Exhibit 190: List of abbreviations

              Research Methodology

              Technavio presents a detailed picture of the market by way of study, synthesis, and summation of data from multiple sources. The analysts have presented the various facets of the market with a particular focus on identifying the key industry influencers. The data thus presented is comprehensive, reliable, and the result of extensive research, both primary and secondary.

              INFORMATION SOURCES

              Primary sources

              • Manufacturers and suppliers
              • Channel partners
              • Industry experts
              • Strategic decision makers

              Secondary sources

              • Industry journals and periodicals
              • Government data
              • Financial reports of key industry players
              • Historical data
              • Press releases

              DATA ANALYSIS

              Data Synthesis

              • Collation of data
              • Estimation of key figures
              • Analysis of derived insights

              Data Validation

              • Triangulation with data models
              • Reference against proprietary databases
              • Corroboration with industry experts

              REPORT WRITING

              Qualitative

              • Market drivers
              • Market challenges
              • Market trends
              • Five forces analysis

              Quantitative

              • Market size and forecast
              • Market segmentation
              • Geographical insights
              • Competitive landscape

              Interested in this report?

              Get your sample now to see our research methodology and insights!

              Download Now

              Frequently Asked Questions

              Access Control Solutions market growth will increase by $ 2.94 bn during 2024-2028.

              The Access Control Solutions market is expected to grow at a CAGR of 7.77% during 2024-2028.

              Access Control Solutions market is segmented by Application( Accounts management and identity synchronization, Unified authentication, Others) End-user( Government, BFSI, Healthcare, Transportation)

              ASSA ABLOY AB, Brivo Inc., Broadcom Inc., Centrify Corp., Cisco Systems Inc., Cloudastructure Inc., Datawatch Systems Inc., dormakaba Holding AG, Feenics Inc., Honeywell International Inc., International Business Machines Corp., M3T Corp., Microsoft Corp., Motorola Solutions Inc., Okta Inc., Oracle Corp., Ping Identity Corp., SecureAuth Corp., Thales Group, Vector Security Inc. are a few of the key vendors in the Access Control Solutions market.

              Europe will register the highest growth rate of 35% among the other regions. Therefore, the Access Control Solutions market in Europe is expected to garner significant business opportunities for the vendors during the forecast period.

              US, Canada, Germany, UK, Italy, France, China, India, Japan, Brazil, Egypt, UAE, Oman, Argentina, KSA, UAE, Brazil, Rest of World (ROW)

              • Growing awareness about sophisticated data security threatsThe growing awareness of sophisticated data security threats is indeed a key driver for the global access control solutions market. As businesses increasingly rely on digital data and applications is the driving factor this market.
              • the threat landscape for data security has become more complex and sophisticated. Cyber-attacks and data breaches can result in significant financial losses is the driving factor this market.
              • damage to reputation is the driving factor this market.
              • and legal consequences. The global access control solutions market provides businesses with a secure and convenient way to manage access to their digital assets such as applications is the driving factor this market.
              • data is the driving factor this market.
              • and networks. By outsourcing access control to a third-party provider is the driving factor this market.
              • businesses can benefit from expert security capabilities and technologies without having to invest in and manage their own infrastructure. Access control solutions offer several security features is the driving factor this market.
              • such as identity and access management is the driving factor this market.
              • multifactor authentication is the driving factor this market.
              • and threat detection and response. These solutions are designed to secure digital assets against both internal and external threats is the driving factor this market.
              • including unauthorized access is the driving factor this market.
              • hacking is the driving factor this market.
              • and phishing attacks. As businesses become more aware of the risks associated with data security is the driving factor this market.
              • there is an increasing demand for access control solutions. This is driving the growth of the global access control solutions market is the driving factor this market.
              • which is expected to continue during the forecast period. is the driving factor this market.

              The Access Control Solutions market vendors should focus on grabbing business opportunities from the Accounts management and identity synchronization segment as it accounted for the largest market share in the base year.