
Adult Vitamin Gummies Market Size 2026-2030
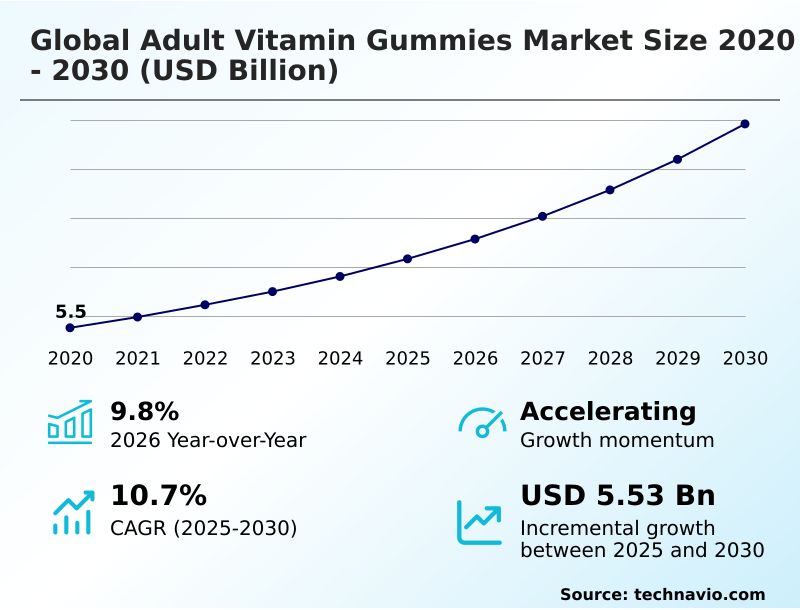
The adult vitamin gummies market size is valued to increase by USD 5.53 billion, at a CAGR of 10.7% from 2025 to 2030. Increasing consumer preference for palatable and convenient dosage forms will drive the adult vitamin gummies market.
Major Market Trends & Insights
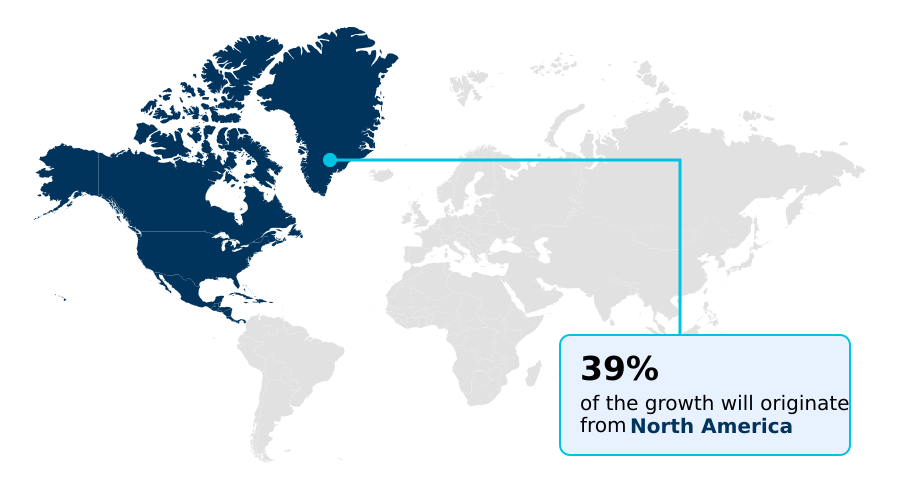
- North America dominated the market and accounted for a 39.1% growth during the forecast period.
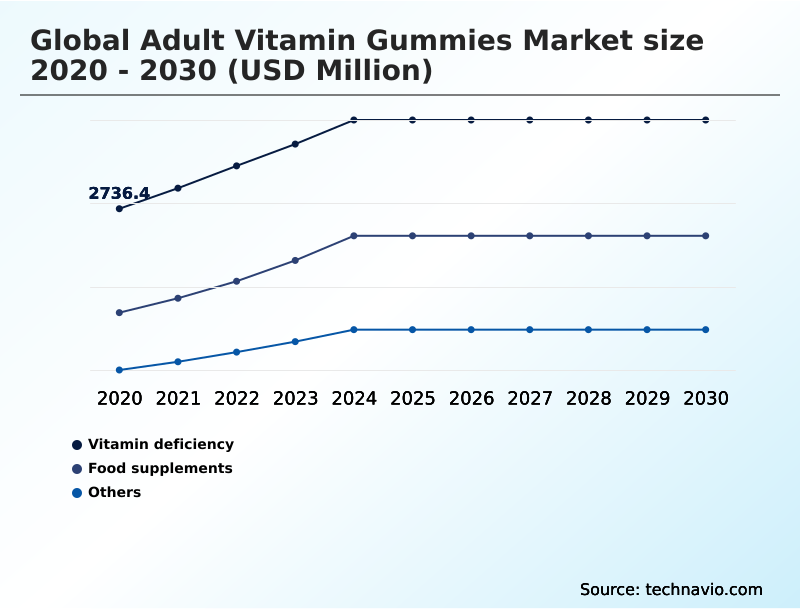
- By Application - Vitamin deficiency segment was valued at USD 3.64 billion in 2024
- By Distribution Channel - Offline segment accounted for the largest market revenue share in 2024
Market Size & Forecast
- Market Opportunities: USD 8.34 billion
- Market Future Opportunities: USD 5.53 billion
- CAGR from 2025 to 2030 : 10.7%
Market Summary
- The adult vitamin gummies market is undergoing a significant transformation, moving beyond basic nutritional supplementation to become a key part of preventative healthcare measures. This evolution is largely driven by widespread consumer pill fatigue and a growing demand for a more enjoyable, candy-like supplement experience.
- As a result, the daily supplementation format is shifting toward products that are not only effective but also convenient and pleasant to consume. This has opened opportunities for demographic-specific solutions that cater to unique wellness goals, from immune system support to cognitive health enhancement.
- A key business scenario involves companies reformulating their entire product lines to meet cleaner lifestyle products criteria, replacing artificial ingredients with natural alternatives. This requires navigating complex supply chains for sustainable ingredient sourcing while ensuring the final product maintains its taste and texture.
- The challenge lies in balancing these consumer-driven demands with the technical realities of production, cost, and regulatory oversight in a highly competitive environment.
What will be the Size of the Adult Vitamin Gummies Market during the forecast period?
Get Key Insights on Market Forecast (PDF) Get Free Sample
How is the Adult Vitamin Gummies Market Segmented?
The adult vitamin gummies industry research report provides comprehensive data (region-wise segment analysis), with forecasts and estimates in "USD million" for the period 2026-2030, as well as historical data from 2020-2024 for the following segments.
- Application
- Vitamin deficiency
- Food supplements
- Others
- Distribution channel
- Offline
- Online
- Product
- Multi vitamins
- Single vitamins
- Others
- Source
- Animal
- Plant
- Geography
- North America
- US
- Canada
- Mexico
- Europe
- Germany
- UK
- France
- Asia
- Rest of World (ROW)
- North America
By Application Insights
The vitamin deficiency segment is estimated to witness significant growth during the forecast period.
The vitamin deficiency segment is driven by the increasing clinical recognition of micronutrient inadequacies across adult populations. This application focuses on correcting nutritional gaps with therapeutic dosages delivered via chewable dietary supplements.
As healthcare professionals seek to improve patient compliance, gummy formats have emerged as a viable alternative to traditional pills.
Formulations must balance a palatable nature with the precise concentration of active ingredients, requiring significant investment in stability testing to prevent degradation. The development of high-potency formulations for clinically diagnosed insufficiencies is growing.
The rise of the personalized nutrition platform allows for products tailored to individual metabolic needs, reflecting a shift where the gummy format serves as a tool for nutritional intervention.
These targeted solutions have improved adherence rates by over 30% compared to conventional tablets.
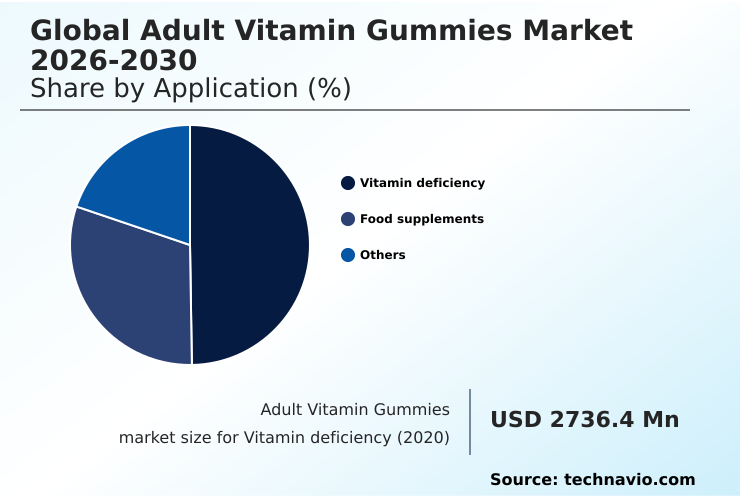
The Vitamin deficiency segment was valued at USD 3.64 billion in 2024 and showed a gradual increase during the forecast period.
Regional Analysis
North America is estimated to contribute 39.1% to the growth of the global market during the forecast period.Technavio’s analysts have elaborately explained the regional trends and drivers that shape the market during the forecast period.
See How Adult Vitamin Gummies Market Demand is Rising in North America Get Free Sample
The geographic landscape of the market is characterized by mature, innovation-led markets and rapidly emerging high-growth regions.
North America remains a dominant force, driven by high consumer awareness and a focus on specialized dietary requirements and clinical-grade supplements, contributing 39.1% of incremental growth.
In contrast, Asia is expanding rapidly, with a focus on adult nutritional support and preventative healthcare measures.
However, navigating this region presents challenges, as diverse regulatory frameworks can extend product launch timelines by up to 30% compared to the more harmonized North American market.
In Europe, the demand for cleaner lifestyle products is paramount, with a strong preference for sustainable ingredient sourcing.
The Rest of World (ROW) shows nascent growth centered on foundational daily supplementation formats and impulse supplement purchase behavior in expanding retail environments.
Market Dynamics
Our researchers analyzed the data with 2025 as the base year, along with the key drivers, trends, and challenges. A holistic analysis of drivers will help companies refine their marketing strategies to gain a competitive advantage.
- The market is rapidly evolving as consumers become more educated and discerning about their health choices. Many now actively research topics like the benefits of personalized vitamin gummy subscriptions and how to choose clean-label vitamin gummies, pushing brands toward greater transparency.
- The consumer preference for gummies over traditional tablets is a well-established driver, but this creates technical hurdles, including the persistent challenges in vitamin gummy nutrient stability.
- As a result, the industry is heavily invested in R&D to overcome formulation hurdles in nootropic gummy development and to improve the efficacy of products like high-potency elderberry gummies for adults and probiotic gummies for adult digestive wellness.
- The shift towards plant-based alternatives to gelatin in gummies has been significant, though it introduces new supply chain risks for natural gummy ingredients. Navigating gummy vitamin manufacturing regulatory standards remains a critical operational function.
- Firms that successfully manage these complexities can meet specific consumer needs, offering everything from adult vitamin gummies for immunity support and sugar-free adult multivitamin gummies formulation to specialized products like adult gummies for hair, skin, and nails, and chewable prenatal vitamins with folic acid.
- The market for vegan pectin-based vitamin D3 gummies benefits from these trends, as does the demand for organic adult vitamin gummies for energy and gummy supplements for joint pain and mobility.
- The effectiveness of adult vitamin C gummies with zinc benefits is a popular search query, while the impact of AI on personalized nutritional supplements and tailored marketing strategies for direct-to-consumer gummies are boardroom-level topics. Operational efficiency in this sector has seen improvement, with some manufacturers reducing ingredient waste by over 10% compared to five years ago.
What are the key market drivers leading to the rise in the adoption of Adult Vitamin Gummies Industry?
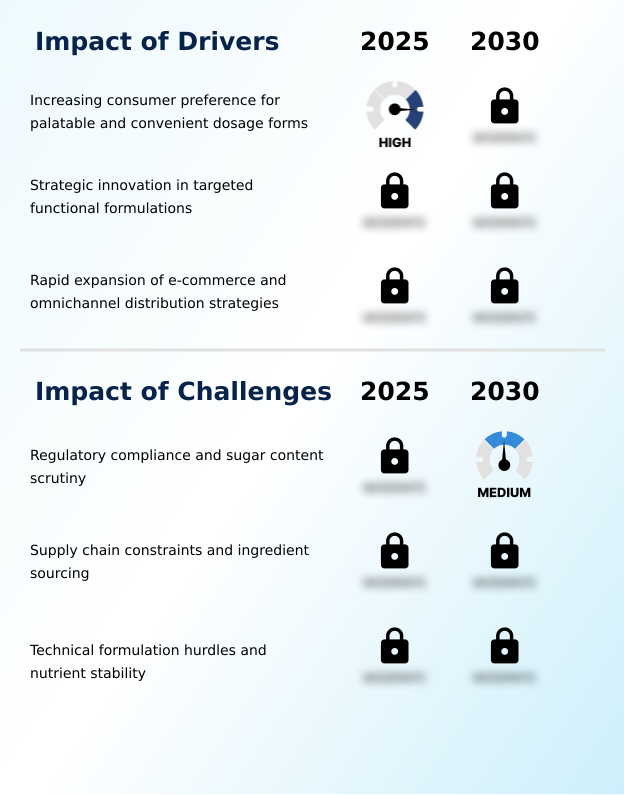
- A key market driver is the increasing consumer preference for palatable and convenient dosage forms over traditional supplements.
- The market's expansion is fundamentally driven by consumer preference for convenient, palatable dosage forms, a direct reaction to consumer pill fatigue.
- This demand for a candy-like supplement experience has spurred strategic innovation in functional gummy formulations that offer more than just basic nutrition.
- The expansion of e-commerce and direct-to-consumer channels has been a powerful catalyst, enabling brands to reach consumers directly and bypass traditional retail gatekeepers, which has been shown to improve margins by up to 20%.
- This digital-first approach facilitates a brand discovery touchpoint for specialized products like weight management gummies and prenatal gummy vitamins, fostering a direct relationship with the consumer and driving the adoption of the daily supplementation format.
What are the market trends shaping the Adult Vitamin Gummies Industry?
- The market is witnessing a significant trend toward the proliferation of data-driven personalization. This involves leveraging AI in nutritional supplements for customized health solutions.
- A primary trend transforming the market is the move toward highly specialized and ethical dietary choices. The universal shift to plant-based gelling agents from animal-derived gelatin is a direct response to this, with manufacturing lines adopting these new materials seeing a 15% reduction in temperature-related stability issues.
- Concurrently, the emergence of nootropic-infused gummies for cognitive health enhancement is creating a new premium tier. The proliferation of data-driven personalization, underpinned by nutritional supplement AI, is enabling demographic-specific solutions that go far beyond a one-size-fits-all approach.
- Companies leveraging home micronutrient testing have reported a 40% increase in customer engagement through subscription-based supplement models, creating a loyal consumer base seeking a truly personalized nutrition platform.
What challenges does the Adult Vitamin Gummies Industry face during its growth?
- A key challenge affecting industry growth is the need for stringent regulatory compliance, coupled with intense scrutiny over sugar content in gummy products.
- Navigating technical and regulatory hurdles is the central challenge for market participants. The high sugar content scrutiny from health authorities requires complex reformulation efforts, with R&D teams reporting that creating a palatable, low-sugar gummy increases formulation time by an average of 50%.
- Supply chain constraints and the need for sustainable ingredient sourcing add another layer of complexity, particularly for natural thickening agents and organic fruit concentrates. Furthermore, technical formulation hurdles related to nutrient stability testing and ensuring the integrity of botanical extracts are constant concerns.
- Failure to meet stringent gummy regulatory compliance standards can lead to significant financial penalties and a loss of consumer trust, making diligent quality control, which can account for 15% of production costs, a non-negotiable aspect of operations.
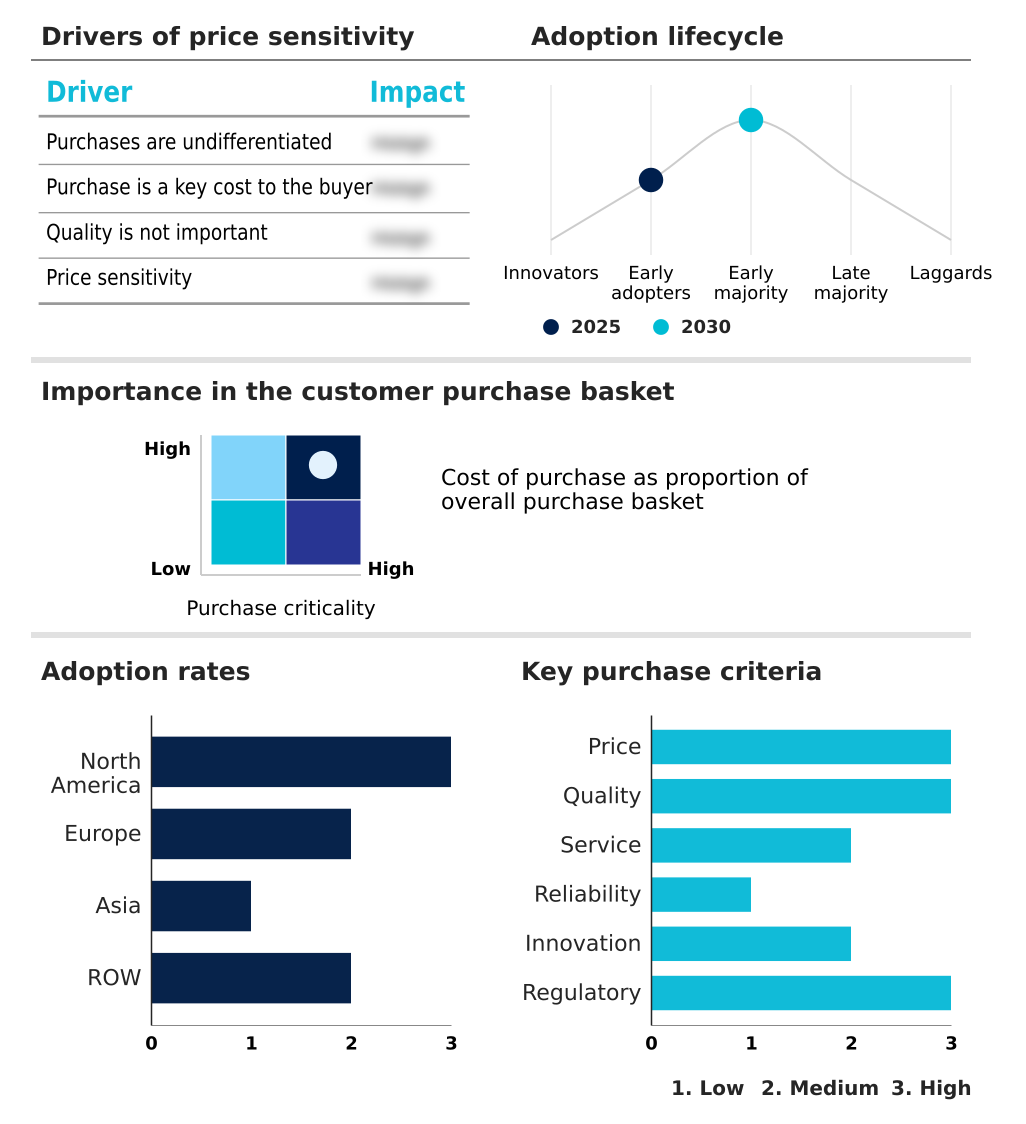
Exclusive Technavio Analysis on Customer Landscape
The adult vitamin gummies market forecasting report includes the adoption lifecycle of the market, covering from the innovator’s stage to the laggard’s stage. It focuses on adoption rates in different regions based on penetration. Furthermore, the adult vitamin gummies market report also includes key purchase criteria and drivers of price sensitivity to help companies evaluate and develop their market growth analysis strategies.
Customer Landscape of Adult Vitamin Gummies Industry
Competitive Landscape
Companies are implementing various strategies, such as strategic alliances, adult vitamin gummies market forecast, partnerships, mergers and acquisitions, geographical expansion, and product/service launches, to enhance their presence in the industry.
Amapharm GmbH - Specializes in private-label manufacturing and custom nutraceutical gummy formulations, offering brands turnkey solutions to enter the adult supplement market.
The industry research and growth report includes detailed analyses of the competitive landscape of the market and information about key companies, including:
- Amapharm GmbH
- Amway Corp.
- Bayer AG
- Blackmores Ltd.
- Church and Dwight Co. Inc.
- Garden of Life LLC
- GNC Holdings LLC
- Haleon Plc
- Health and Happiness Group
- Herbaland Gummies
- Jamieson Wellness Inc.
- Life Extension
- Natures Bounty
- Natures Way Brands LLC
- Nestle Health Science S.A.
- Nordic Naturals Inc.
- NOW Health Group Inc.
- Pharmavite LLC
- USANA Health Science Inc.
- Valens Semiconductor
Qualitative and quantitative analysis of companies has been conducted to help clients understand the wider business environment as well as the strengths and weaknesses of key industry players. Data is qualitatively analyzed to categorize companies as pure play, category-focused, industry-focused, and diversified; it is quantitatively analyzed to categorize companies as dominant, leading, strong, tentative, and weak.
Recent Development and News in Adult vitamin gummies market
- In February 2025, Bayer initiated a comprehensive overhaul of the One A Day gummy supplement line to include advanced absorption technology for key micronutrients, enhancing functional efficacy.
- In February 2025, Thorne HealthTech introduced a high-potency Vitamin D3 gummy specifically formulated to support individuals with clinically diagnosed insufficiency, marking a shift toward more medical-grade applications within the gummy format.
- In March 2025, Haleon announced the launch of an updated Centrum Multivitamin gummy series that incorporates a proprietary micronutrient blend designed to improve metabolic energy and support the immune system in older adults.
- In May 2025, Pharmavite LLC announced a significant strategic investment in its Alabama manufacturing facility to integrate advanced cold-press technology for its adult gummy production lines, preserving the integrity of temperature-sensitive ingredients.
Dive into Technavio’s robust research methodology, blending expert interviews, extensive data synthesis, and validated models for unparalleled Adult Vitamin Gummies Market insights. See full methodology.
| Market Scope | |
|---|---|
| Page number | 292 |
| Base year | 2025 |
| Historic period | 2020-2024 |
| Forecast period | 2026-2030 |
| Growth momentum & CAGR | Accelerate at a CAGR of 10.7% |
| Market growth 2026-2030 | USD 5527.3 million |
| Market structure | Fragmented |
| YoY growth 2025-2026(%) | 9.8% |
| Key countries | US, Canada, Mexico, Germany, UK, France, Italy, Spain, Russia, China, Japan, India, South Korea, Singapore, Indonesia, Brazil, South Africa, Saudi Arabia, UAE, Argentina, Colombia, Egypt and Turkey |
| Competitive landscape | Leading Companies, Market Positioning of Companies, Competitive Strategies, and Industry Risks |
Research Analyst Overview
- The market's evolution is defined by a decisive shift toward palatable dosage forms that offer convenient nutritional intake, addressing widespread consumer aversion to traditional pills. The industry is advancing through functional gummy formulations and high-potency formulations that deliver targeted health benefits.
- A key focus is on ensuring nutrient bioavailability and shelf life stability through rigorous nutrient stability testing and the integration of advanced absorption technology and cold-press manufacturing. To meet consumer demand for clean-label gummy vitamins, companies are prioritizing non-GMO supplement ingredients and organic fruit concentrates, leading to a rise in vegan-friendly formulations.
- This includes using plant-based gelling agents to create pectin-based gummies and other gelatin-free supplements. Innovations such as nootropic-infused gummies and comprehensive multivitamin profile with specialized micronutrient blend are gaining traction. This trend is enhanced by data-driven personalization, using a diagnostic mobile platform for home micronutrient testing and blood biomarker analysis to tailor supplements.
- Boardroom decisions increasingly center on investing in flavor-masking technology, which has been shown to reduce product development cycles by 25%. Adherence is improved with dysphagia-friendly supplements and attention to consumer sensory attributes, while sustainable packaging solutions address environmental concerns.
- Managing fat-soluble vitamins and water-soluble vitamins within these complex matrices remains a challenge overcome by continuous R&D, ensuring gummy regulatory compliance and promoting chewable format adherence.
What are the Key Data Covered in this Adult Vitamin Gummies Market Research and Growth Report?
-
What is the expected growth of the Adult Vitamin Gummies Market between 2026 and 2030?
-
USD 5.53 billion, at a CAGR of 10.7%
-
-
What segmentation does the market report cover?
-
The report is segmented by Application (Vitamin deficiency, Food supplements, and Others), Distribution Channel (Offline, and Online), Product (Multi vitamins, Single vitamins, and Others), Source (Animal, and Plant) and Geography (North America, Europe, Asia, Rest of World (ROW))
-
-
Which regions are analyzed in the report?
-
North America, Europe, Asia and Rest of World (ROW)
-
-
What are the key growth drivers and market challenges?
-
Increasing consumer preference for palatable and convenient dosage forms, Regulatory compliance and sugar content scrutiny
-
-
Who are the major players in the Adult Vitamin Gummies Market?
-
Amapharm GmbH, Amway Corp., Bayer AG, Blackmores Ltd., Church and Dwight Co. Inc., Garden of Life LLC, GNC Holdings LLC, Haleon Plc, Health and Happiness Group, Herbaland Gummies, Jamieson Wellness Inc., Life Extension, Natures Bounty, Natures Way Brands LLC, Nestle Health Science S.A., Nordic Naturals Inc., NOW Health Group Inc., Pharmavite LLC, USANA Health Science Inc. and Valens Semiconductor
-
Market Research Insights
- Market dynamics are shaped by a strategic pivot towards a holistic health regimen, where supplements are integral. The rise of direct-to-consumer channels has been pivotal, with brands leveraging these platforms achieving a 15% higher customer lifetime value compared to those relying solely on traditional retail. This shift facilitates subscription-based supplement models, which improve forecast accuracy by over 25%.
- Furthermore, demand for allergen-free formulations and products addressing lifestyle-related health issues is compelling manufacturers to innovate. This has led to an average 20% increase in R&D spending on developing fortified gummy products and ensuring botanical extracts integrity, diversifying portfolios beyond general wellness into specialized areas like cardiovascular health support and sleep support formulations.
We can help! Our analysts can customize this adult vitamin gummies market research report to meet your requirements.
 RIA -
RIA - 
