
Aerospace Artificial Intelligence (AI) Market Size 2026-2030
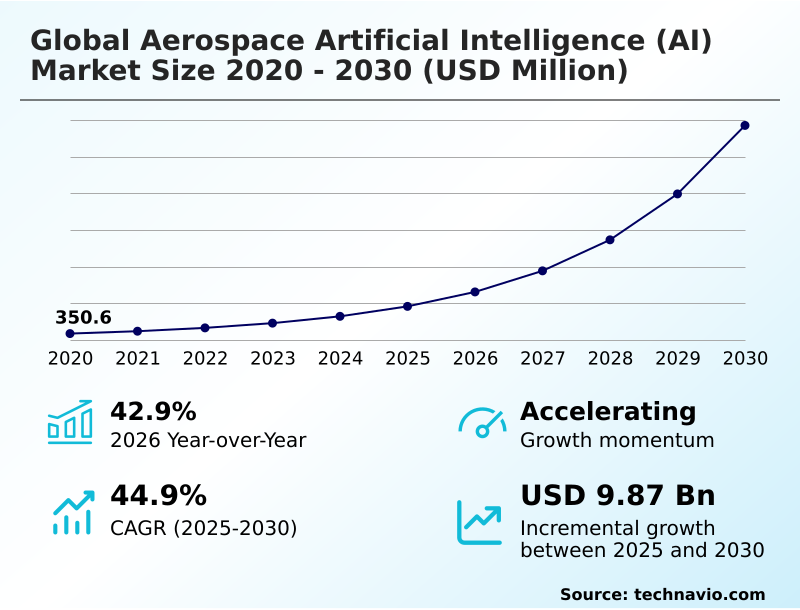
The aerospace artificial intelligence (ai) market size is valued to increase by USD 9.87 billion, at a CAGR of 44.9% from 2025 to 2030. Rising demand for autonomous operations and uncrewed systems will drive the aerospace artificial intelligence (ai) market.
Major Market Trends & Insights
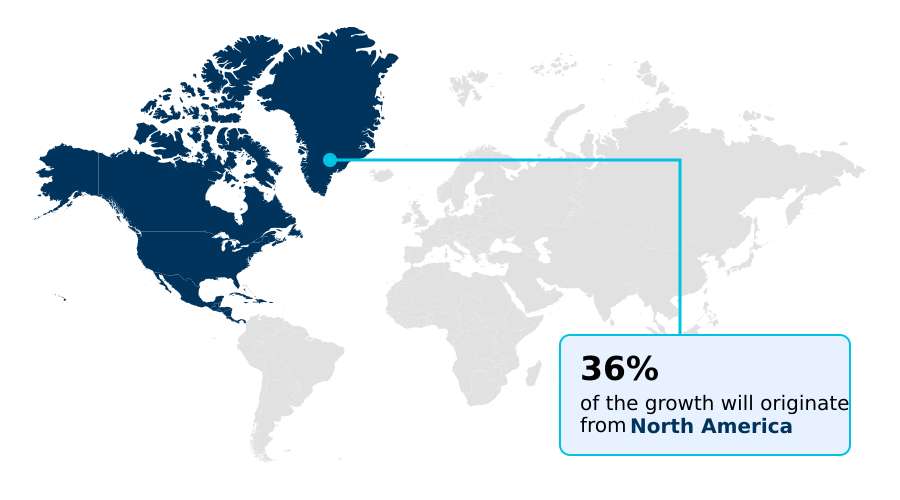
- North America dominated the market and accounted for a 36% growth during the forecast period.
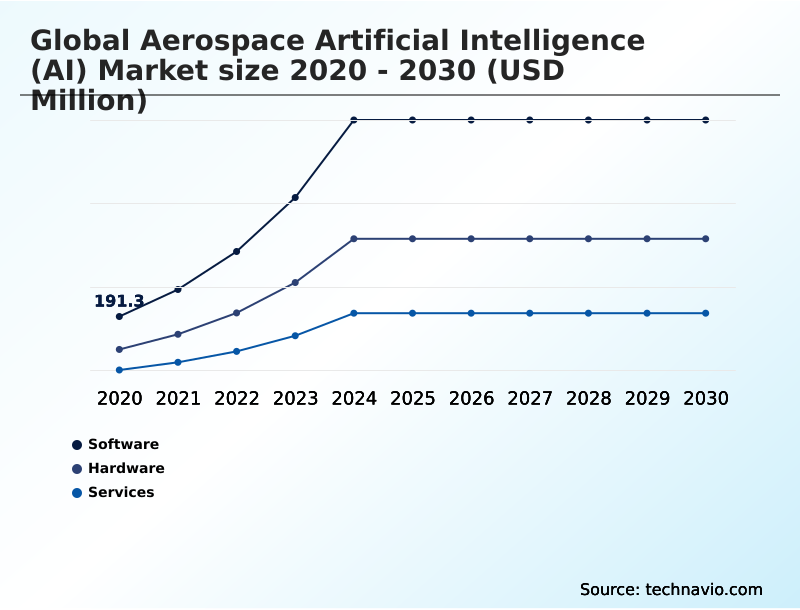
- By Component - Software segment was valued at USD 699.1 million in 2024
- By End-user - Defense and military segment accounted for the largest market revenue share in 2024
Market Size & Forecast
- Market Opportunities: USD 11.35 billion
- Market Future Opportunities: USD 9.87 billion
- CAGR from 2025 to 2030 : 44.9%
Market Summary
- The aerospace artificial intelligence (AI) market is undergoing a significant transformation, moving beyond theoretical applications to deep industrial integration. This evolution is driven by the imperative to enhance operational efficiency, safety, and capability in an increasingly complex environment. Key drivers include the rising demand for autonomous flight systems and uncrewed aerial vehicles in both defense and commercial sectors.
- Concurrently, trends such as the adoption of digital twin technology for predictive maintenance and AI-powered data analytics are reshaping manufacturing and fleet management.
- A core application involves using machine learning models to analyze real-time sensor data from an aircraft engine, allowing maintenance crews to predict component failures weeks in advance and schedule repairs proactively, thereby avoiding costly unplanned downtime and improving fleet readiness. However, progress is tempered by challenges, notably the stringent regulatory hurdles for certifying non-deterministic AI systems and persistent cybersecurity vulnerabilities.
- The industry's trajectory depends on balancing rapid technological innovation with the rigorous safety and security standards that govern aviation.
What will be the Size of the Aerospace Artificial Intelligence (AI) Market during the forecast period?
Get Key Insights on Market Forecast (PDF) Get Free Sample
How is the Aerospace Artificial Intelligence (AI) Market Segmented?
The aerospace artificial intelligence (ai) industry research report provides comprehensive data (region-wise segment analysis), with forecasts and estimates in "USD million" for the period 2026-2030, as well as historical data from 2020-2024 for the following segments.
- Component
- Software
- Hardware
- Services
- End-user
- Defense and military
- Commercial aviation
- Aircraft manufacturers
- Space exploration
- Airports
- Application
- Machine learning
- Natural language processing
- Computer vision
- Context awareness computing
- Geography
- North America
- US
- Canada
- Mexico
- Europe
- France
- Germany
- UK
- APAC
- China
- Japan
- India
- Middle East and Africa
- Saudi Arabia
- UAE
- Israel
- South America
- Brazil
- Argentina
- Rest of World (ROW)
- North America
By Component Insights
The software segment is estimated to witness significant growth during the forecast period.
The software segment is the core intelligence layer, where predictive maintenance algorithms and AI analytics toolkits enable advanced operational capabilities. This segment encompasses autonomous flight systems and the complex, verifiable and certifiable code required for deployment in mission-critical environments.
Through the adoption of software-defined aircraft architectures, operators are achieving new levels of flexibility and safety.
For instance, the integration of specialized computer vision inspection software has been shown to reduce manual inspection times by over 40% on certain assembly lines.
This shift toward intelligent software platforms is fundamental, transforming static hardware into dynamic, self-monitoring assets that facilitate proactive safety prediction, enhanced by robust aerospace digital twins and sophisticated asset performance optimization.
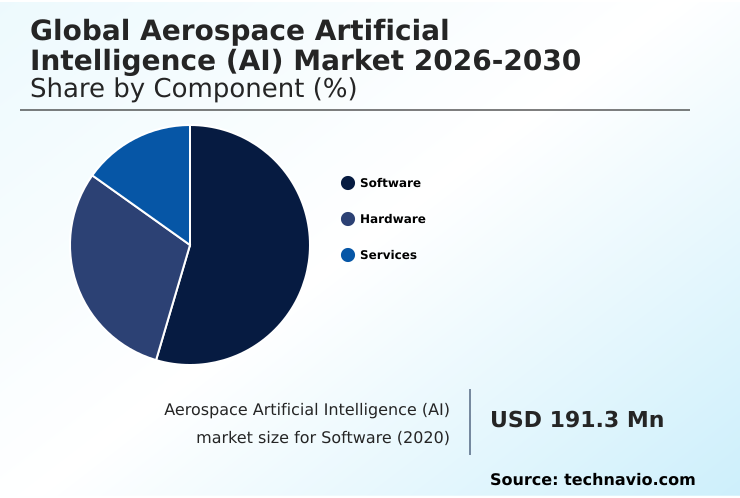
The Software segment was valued at USD 699.1 million in 2024 and showed a gradual increase during the forecast period.
Regional Analysis
North America is estimated to contribute 36% to the growth of the global market during the forecast period.Technavio’s analysts have elaborately explained the regional trends and drivers that shape the market during the forecast period.
See How Aerospace Artificial Intelligence (AI) Market Demand is Rising in North America Get Free Sample
The market's geographic landscape is led by North America, which accounts for over 42% of activity, primarily driven by substantial defense investments in agentic AI and swarming technology.
This region’s focus on tactical superiority through AI enabled mission systems contrasts with the APAC region, which is demonstrating the fastest growth.
In APAC, the push is toward smart manufacturing quality control and intelligent airport operations, where AI-powered predictive maintenance is enhancing efficiency. European developments center on collaborative projects to establish autonomy certification standards.
The global dynamic is shaped by these regional priorities, with some focusing on military applications of algorithmic warfare and others on improving commercial manufacturing, where the use of machine learning models has reduced certain production errors by up to 15%.
Market Dynamics
Our researchers analyzed the data with 2025 as the base year, along with the key drivers, trends, and challenges. A holistic analysis of drivers will help companies refine their marketing strategies to gain a competitive advantage.
- The strategic implementation of artificial intelligence is redefining aerospace capabilities from the factory floor to mission execution. The AI integration in aerospace manufacturing is a clear starting point, where computer vision for aircraft inspection and natural language processing for maintenance logs are streamlining complex workflows.
- This digital thread continues with AI-driven asset management systems, which are crucial for optimizing fleet sustainability with AI. For operational effectiveness, AI solutions for uncrewed systems are becoming standard, while machine learning in air traffic control promises to enhance airspace safety and efficiency.
- In parallel, AI platforms for aerospace digital twins are enabling high-fidelity simulations, with GPU acceleration in flight simulation providing realistic training environments. For military applications, autonomous systems for military aviation and the use of AI for mission planning are providing a significant tactical edge.
- This progress hinges on developing certifiable AI for aviation, a process guided by the emerging standardization for AI in aviation. The ecosystem is further supported by AI in spacecraft system management and advanced data analytics for flight safety. As these systems become more interconnected, addressing cybersecurity for aerospace AI systems is paramount.
- Meanwhile, in the cockpit, human-AI collaboration in cockpits is improving situational awareness, and in logistics, AI-driven flight schedule optimization has improved on-time performance by double-digit percentages compared to legacy systems, while agentic AI for supply chain resilience mitigates disruptions.
What are the key market drivers leading to the rise in the adoption of Aerospace Artificial Intelligence (AI) Industry?
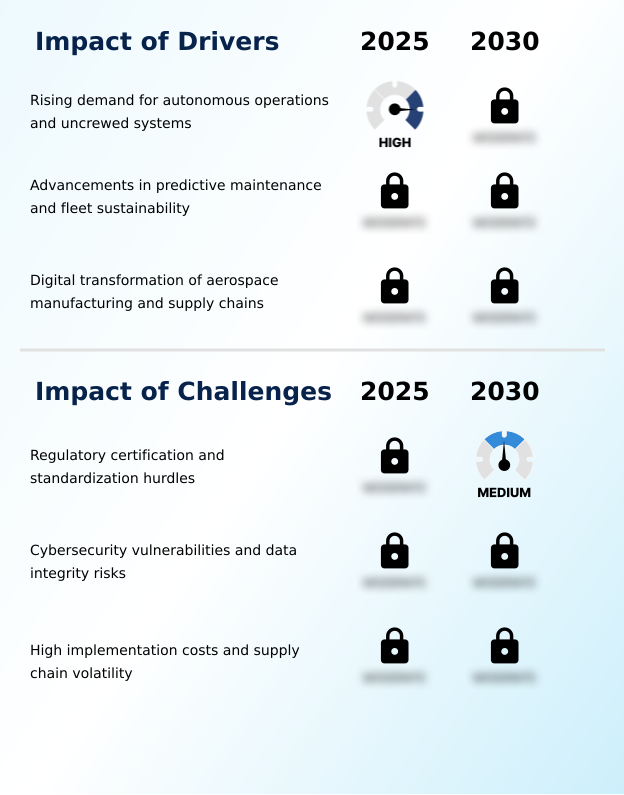
- The rising demand for autonomous operations and uncrewed systems is a key driver propelling growth in the aerospace artificial intelligence market.
- The market is primarily driven by the increasing demand for autonomous operations and enhanced predictive capabilities. The development of advanced air mobility solutions and intelligent cockpit assistants is accelerating the transition toward reduced crew operations and fully autonomous flight.
- In parallel, advancements in AI-powered predictive maintenance, using deep learning architectures, are delivering significant operational benefits. Some operators report a 60% earlier lead time in identifying required maintenance, which simultaneously cuts false alert rates in half.
- This capability is powered by sophisticated engine health monitoring and high-fidelity flight path analysis, optimizing both safety and fuel efficiency.
- The push for AI-enabled mission systems continues to be a strong driver in the defense sector, focusing on improving mission intelligence analytics.
What are the market trends shaping the Aerospace Artificial Intelligence (AI) Industry?
- The adoption of photo-driven AI and computer vision within smart manufacturing is an emerging market trend. This development is poised to significantly improve quality control and accelerate production cycles in the aerospace industry.
- Key market trends are centered on the industrial-scale adoption of intelligent automation and advanced analytics. The use of photo-driven AI, underpinned by optical character recognition, is transforming manufacturing by automating parts validation, leading to a reduction in inspection time of over 17 hours per aircraft in some implementations.
- This shift toward a digital thread manufacturing process enhances quality and accelerates production. Concurrently, the evolution of human-AI teaming and context awareness computing is reshaping cockpit and ground operations, improving decision-making under pressure. Innovations in detect-and-avoid systems are critical for the safe integration of uncrewed platforms into shared airspace.
- These advancements collectively push the industry toward greater efficiency, safety, and autonomy, leveraging high-performance AI-driven data integration.
What challenges does the Aerospace Artificial Intelligence (AI) Industry face during its growth?
- Regulatory certification and standardization hurdles present a key challenge affecting the industry's growth trajectory for artificial intelligence adoption.
- Significant challenges remain in the widespread deployment of aerospace AI, primarily revolving around regulation and security. The difficulty in achieving algorithmic safety verification for autonomous navigation suites creates substantial hurdles for regulatory bodies, potentially increasing development cycles by over 30% for novel systems. This lack of harmonized autonomy certification standards creates uncertainty for manufacturers.
- Furthermore, cybersecurity vulnerabilities in increasingly connected, software-defined aircraft pose a critical risk, where a single breach could compromise fleet-wide operations. The high cost and complexity of implementing resilient supply chains for specialized AI hardware, such as advanced processors, adds another layer of difficulty.
- These factors collectively temper the pace of innovation, requiring a concerted effort to build a secure and standardized data-driven framework.
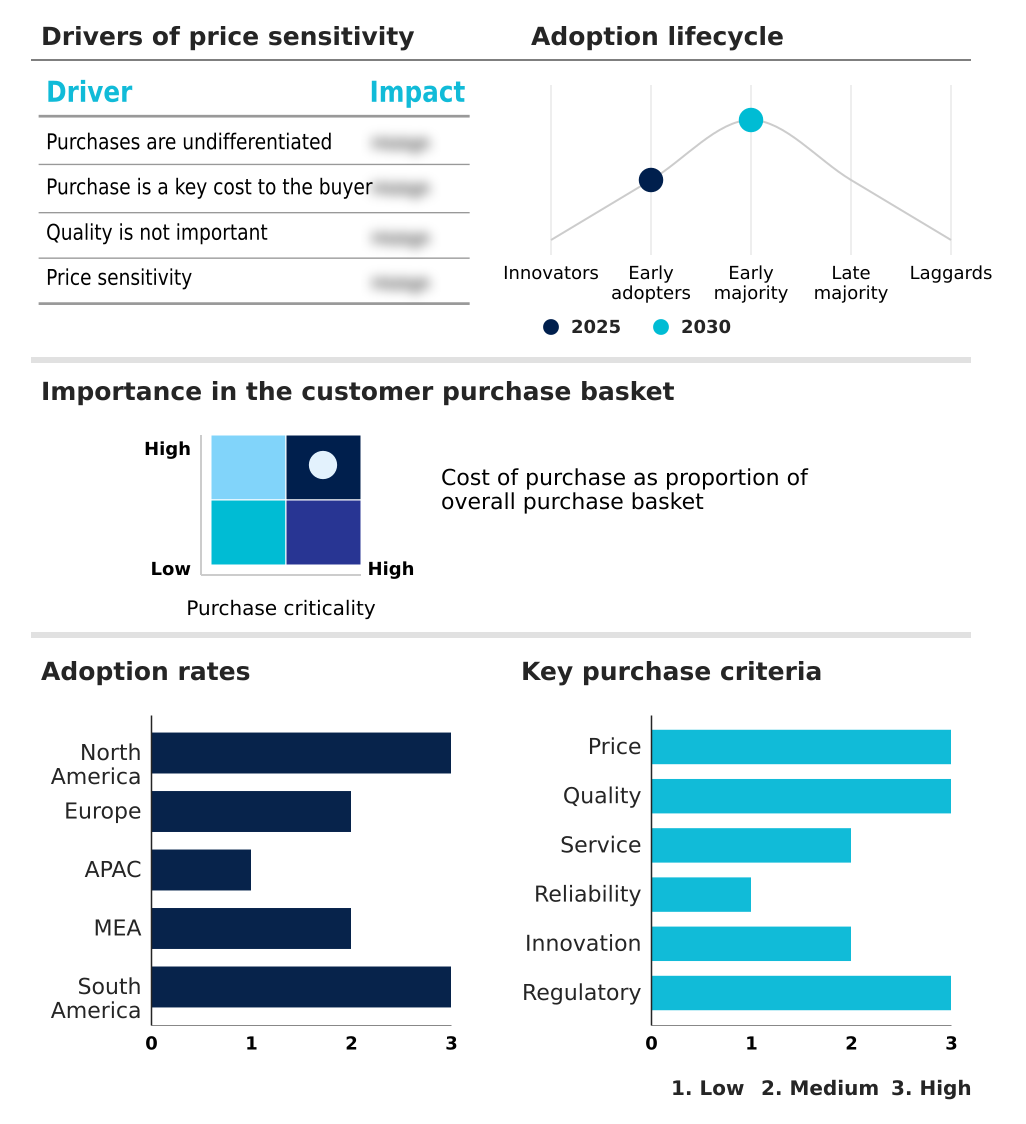
Exclusive Technavio Analysis on Customer Landscape
The aerospace artificial intelligence (ai) market forecasting report includes the adoption lifecycle of the market, covering from the innovator’s stage to the laggard’s stage. It focuses on adoption rates in different regions based on penetration. Furthermore, the aerospace artificial intelligence (ai) market report also includes key purchase criteria and drivers of price sensitivity to help companies evaluate and develop their market growth analysis strategies.
Customer Landscape of Aerospace Artificial Intelligence (AI) Industry
Competitive Landscape
Companies are implementing various strategies, such as strategic alliances, aerospace artificial intelligence (ai) market forecast, partnerships, mergers and acquisitions, geographical expansion, and product/service launches, to enhance their presence in the industry.
Advanced Micro Devices Inc. - Delivering intelligent platforms and analytical solutions to advance aerospace autonomy, predictive maintenance, and mission capabilities.
The industry research and growth report includes detailed analyses of the competitive landscape of the market and information about key companies, including:
- Advanced Micro Devices Inc.
- Airbus SE
- General Dynamics Corp.
- General Electric Co.
- Honeywell International Inc.
- IBM Corp.
- Indra Sistemas SA
- Intel Corp.
- Iris Automation Inc.
- Lockheed Martin Corp.
- Microsoft Corp.
- Northrop Grumman Corp.
- NVIDIA Corp.
- Palantir Technologies Inc.
- RTX Corp.
- Shield AI
- SITA
- SparkCognition Inc.
- Thales Group
- The Boeing Co.
Qualitative and quantitative analysis of companies has been conducted to help clients understand the wider business environment as well as the strengths and weaknesses of key industry players. Data is qualitatively analyzed to categorize companies as pure play, category-focused, industry-focused, and diversified; it is quantitatively analyzed to categorize companies as dominant, leading, strong, tentative, and weak.
Recent Development and News in Aerospace artificial intelligence (ai) market
- In March 2025, Palantir Technologies Inc. and Archer Aviation formalized a collaboration to utilize the Palantir Artificial Intelligence Platform, aiming to optimize aircraft manufacturing and develop next-generation software for air traffic control.
- In February 2025, The Boeing Co. committed to a $2.5 billion investment focused on enhancing its digital manufacturing capabilities through the integration of machine learning and digital twin technology across its commercial production lines.
- In September 2024, GE Aerospace announced a strategic partnership with Merlin to develop an autonomy core platform designed to bring advanced artificial intelligence capabilities to existing military and civil aircraft, targeting crew reduction and uncrewed flight.
- In August 2024, Odysight.ai initiated the first US flight tests of its specialized AI predictive maintenance system on the UH-60 Black Hawk helicopter, marking a critical step in validating real-time visual sensing for military hardware.
Dive into Technavio’s robust research methodology, blending expert interviews, extensive data synthesis, and validated models for unparalleled Aerospace Artificial Intelligence (AI) Market insights. See full methodology.
| Market Scope | |
|---|---|
| Page number | 308 |
| Base year | 2025 |
| Historic period | 2020-2024 |
| Forecast period | 2026-2030 |
| Growth momentum & CAGR | Accelerate at a CAGR of 44.9% |
| Market growth 2026-2030 | USD 9869.4 million |
| Market structure | Fragmented |
| YoY growth 2025-2026(%) | 42.9% |
| Key countries | US, Canada, Mexico, France, Germany, UK, Italy, Spain, The Netherlands, China, Japan, India, South Korea, Australia, Singapore, Saudi Arabia, UAE, Israel, South Africa, Qatar, Brazil, Chile and Argentina |
| Competitive landscape | Leading Companies, Market Positioning of Companies, Competitive Strategies, and Industry Risks |
Research Analyst Overview
- The aerospace industry's pivot toward intelligent systems marks a fundamental operational shift, built upon a new technological foundation. This includes the widespread integration of predictive maintenance algorithms and sophisticated machine learning models to enhance fleet readiness.
- The use of autonomous flight systems, guided by advanced AI analytics toolkits and edge AI processors, is transitioning from experimental to standard practice in both new and retrofitted platforms.
- A key boardroom-level consideration is the strategic investment required to navigate the complexities of non-deterministic machine learning, which necessitates the development of new verifiable and certifiable code to meet stringent safety protocols. Progress in this area is tangible; deep learning architectures are now capable of halving false alert rates in engine diagnostics.
- This evolution is further supported by technologies like digital twin technology, GPU accelerated AI for simulation, and real-time visual sensing, all contributing to a more autonomous and data-driven aerospace ecosystem.
What are the Key Data Covered in this Aerospace Artificial Intelligence (AI) Market Research and Growth Report?
-
What is the expected growth of the Aerospace Artificial Intelligence (AI) Market between 2026 and 2030?
-
USD 9.87 billion, at a CAGR of 44.9%
-
-
What segmentation does the market report cover?
-
The report is segmented by Component (Software, Hardware, and Services), End-user (Defense and military, Commercial aviation, Aircraft manufacturers, Space exploration, and Airports), Application (Machine learning, Natural language processing, Computer vision, and Context awareness computing) and Geography (North America, Europe, APAC, Middle East and Africa, South America)
-
-
Which regions are analyzed in the report?
-
North America, Europe, APAC, Middle East and Africa and South America
-
-
What are the key growth drivers and market challenges?
-
Rising demand for autonomous operations and uncrewed systems, Regulatory certification and standardization hurdles
-
-
Who are the major players in the Aerospace Artificial Intelligence (AI) Market?
-
Advanced Micro Devices Inc., Airbus SE, General Dynamics Corp., General Electric Co., Honeywell International Inc., IBM Corp., Indra Sistemas SA, Intel Corp., Iris Automation Inc., Lockheed Martin Corp., Microsoft Corp., Northrop Grumman Corp., NVIDIA Corp., Palantir Technologies Inc., RTX Corp., Shield AI, SITA, SparkCognition Inc., Thales Group and The Boeing Co.
-
Market Research Insights
- The integration of intelligent systems is yielding tangible results across the aerospace sector, creating a new paradigm for operational efficiency. The use of advanced machine learning models is enabling a 60% earlier lead time for predictive maintenance recommendations, effectively halving false alert rates and boosting fleet availability.
- In manufacturing, the deployment of computer vision tools has resulted in a reduction of manual inspection times by over 40% in certain applications, enhancing throughput and accuracy. This data-driven transformation allows for the continuous optimization of flight operations and supply chain resilience, fundamentally altering how aerospace assets are designed, built, and maintained.
- The focus remains on converting analytical insights into measurable performance gains and a competitive advantage.
We can help! Our analysts can customize this aerospace artificial intelligence (ai) market research report to meet your requirements.
 RIA -
RIA - 
