Agricultural Pesticides Market Analysis, Size, and Forecast 2026-2030: APAC (China, Japan, and India), South America (Brazil and Argentina), Europe (Germany, France, and UK), North America (US, Canada, and Mexico), Middle East and Africa (South Africa, Saudi Arabia, and Turkey), and Rest of World (ROW)

Agricultural Pesticides Market Analysis, Size, and Forecast 2026-2030:
APAC (China, Japan, and India), South America (Brazil and Argentina), Europe (Germany, France, and UK), North America (US, Canada, and Mexico), Middle East and Africa (South Africa, Saudi Arabia, and Turkey), and Rest of World (ROW)

Published: Mar 2026 300 Pages SKU: IRTNTR43805

Market Overview at a Glance

$25.92 B
Market Opportunity
4.2%
CAGR 2025 - 2030
38.9%
APAC Growth
$51.16 B
Herbicides segment 2024

Agricultural Pesticides Market Size 2026-2030

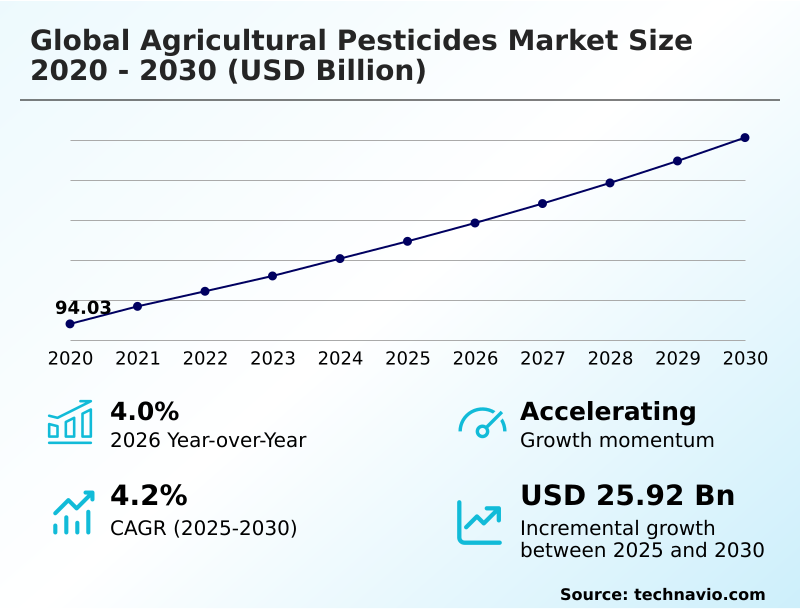
The agricultural pesticides market size is valued to increase by USD 25.92 billion, at a CAGR of 4.2% from 2025 to 2030. Shift toward sustainable, eco‑friendly formulations will drive the agricultural pesticides market.

Major Market Trends & Insights

  • APAC dominated the market and accounted for a 38.9% growth during the forecast period.
  • By Type - Herbicides segment was valued at USD 51.16 billion in 2024
  • By Product - Synthetic pesticides segment accounted for the largest market revenue share in 2024

Market Size & Forecast

  • Market Opportunities: USD 46.57 billion
  • Market Future Opportunities: USD 25.92 billion
  • CAGR from 2025 to 2030 : 4.2%

Market Summary

  • The agricultural pesticides market is fundamentally shaped by the critical need to safeguard crop yields against a backdrop of rising global food demand and intensifying climate variability. This sector is undergoing a significant transformation, moving from a reliance on conventional, broad-spectrum chemicals to more sophisticated and sustainable crop protection strategies.
  • Key trends include the rapid adoption of biopesticides, derived from natural sources, and the integration of digital agriculture tools that enable precision application, minimizing environmental impact. A central business scenario involves the strategic recalibration of supply chains for active ingredients to navigate geopolitical disruptions and ensure consistent manufacturing of both synthetic and biological formulations.
  • However, the industry grapples with persistent challenges, including the development of pest resistance to existing treatments and the high cost of regulatory compliance for new products. This dynamic environment compels continuous innovation in formulations and application technologies to balance agricultural productivity with ecological stewardship, ensuring the long-term viability of food production systems worldwide.

What will be the Size of the Agricultural Pesticides Market during the forecast period?

Get Key Insights on Market Forecast (PDF) Request Free Sample

How is the Agricultural Pesticides Market Segmented?

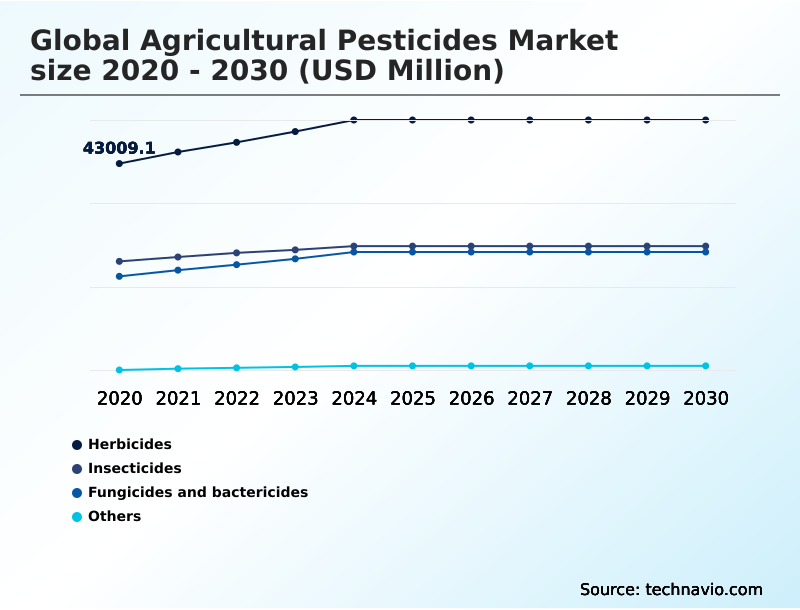
The agricultural pesticides industry research report provides comprehensive data (region-wise segment analysis), with forecasts and estimates in "USD million" for the period 2026-2030, as well as historical data from 2020-2024 for the following segments.

  • Type
    • Herbicides
    • Insecticides
    • Fungicides and bactericides
    • Others
  • Product
    • Synthetic pesticides
    • Biopesticides
  • Formulation
    • Liquid
    • Emulsifiable concentrate
    • Granular
    • Wettable powder
  • Geography
    • APAC
      • China
      • Japan
      • India
    • South America
      • Brazil
      • Argentina
    • Europe
      • Germany
      • France
      • UK
    • North America
      • US
      • Canada
      • Mexico
    • Middle East and Africa
      • South Africa
      • Saudi Arabia
      • Turkey
    • Rest of World (ROW)

By Type Insights

The herbicides segment is estimated to witness significant growth during the forecast period.

The herbicides segment is central to the global agricultural pesticides market 2026-2030, driven by the need for effective weed management solutions. This category, accounting for nearly 40% of the total market, is evolving beyond traditional synthetic pesticides.

The focus is shifting toward developing novel chemical active ingredients and bio-herbicides to combat resistance and meet demand from organic farming methods. This evolution in crop protection products is critical for sustainable farming practices.

Integrated pest management protocols now favor targeted, variable-rate methods over broadcast spraying, leveraging precision agriculture technology.

Manufacturers are prioritizing pre-emergence and specialty formulations, including those for regenerative farming, to offer long-term residual control, thus protecting seedlings and supporting soil health improvement while ensuring consistent agricultural input performance.

Request Free Sample

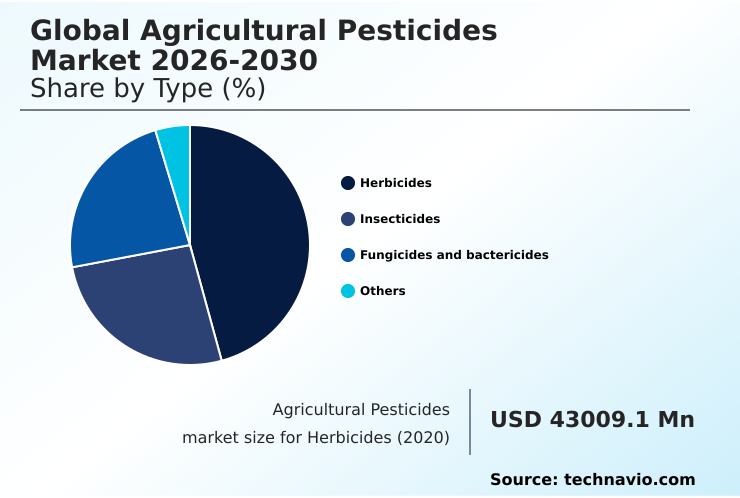
The Herbicides segment was valued at USD 51.16 billion in 2024 and showed a gradual increase during the forecast period.

Request Free Sample

Regional Analysis

APAC is estimated to contribute 38.9% to the growth of the global market during the forecast period.Technavio’s analysts have elaborately explained the regional trends and drivers that shape the market during the forecast period.

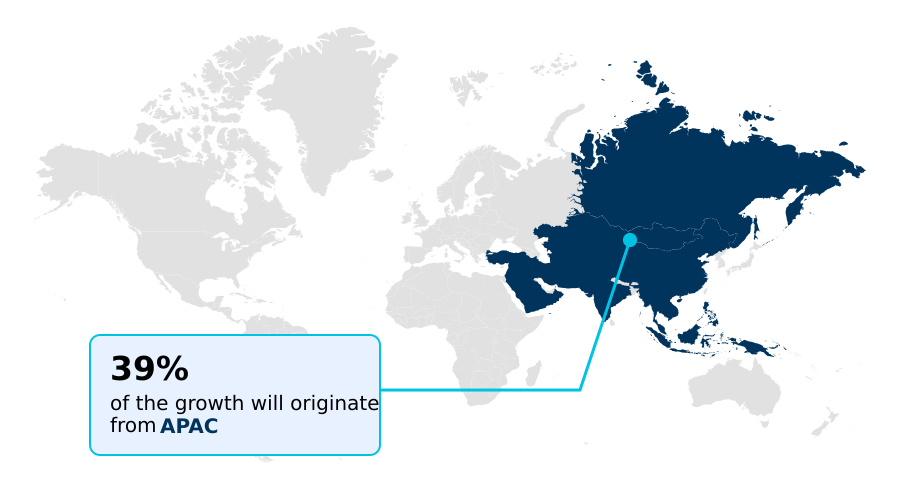
See How Agricultural Pesticides Market Demand is Rising in APAC Request Free Sample

The geographic landscape of the agricultural pesticides market is led by APAC, which accounts for nearly 39% of incremental growth, driven by agricultural intensification and food security initiatives in countries like China and India.

In this region, regulatory shifts, such as China's digital certificate policy for agricultural chemical registration, enhance supply chain traceability for nematicides and other crop protection chemicals.

This contrasts with mature markets like Europe, where stringent environmental regulations and a focus on low-toxicity formulations are paramount. South America remains a critical hub for commodity crops, where effective pest control performance is essential.

The demand for targeted pesticide application and advanced seed treatments is a common thread, pushing regional players toward more sophisticated and sustainable crop protection strategies to maintain global competitiveness and meet commercial-scale agriculture demands.

Market Dynamics

Our researchers analyzed the data with 2025 as the base year, along with the key drivers, trends, and challenges. A holistic analysis of drivers will help companies refine their marketing strategies to gain a competitive advantage.

  • Strategic decision-making in the global agricultural pesticides market 2026-2030 requires a nuanced understanding of product efficacy and operational resilience. The debate over synthetic versus biological insecticide efficacy continues, with choices depending on crop type, pest pressure, and regulatory context. The impact of biopesticides on the soil microbiome is a growing consideration, influencing integrated pest management in organic farming.
  • For high-value crops, the specific use of fungicides is critical for quality and yield, while the cost of pesticide regulatory compliance shapes R&D pipelines for all new chemistries. Formulators are focused on developing broad-spectrum herbicide formulations and selective insecticide chemistry to tackle resistant weeds and pests. Precision spraying technology for herbicides is enhancing the effectiveness of these products.
  • Operationally, managing pesticide supply chain risk has become a boardroom priority. Firms that diversified sourcing for key intermediates saw a 40% lower risk of production delays compared to those with concentrated sourcing.
  • The impact of climate on pest cycles necessitates adaptable solutions, where the effectiveness of nano-insecticide delivery systems and the impact of adjuvants on pesticide efficacy are key research areas.
  • Decisions around post-patent glyphosate alternative options, systemic fungicide application for cereals, nematicide effectiveness in sandy soils, plant growth regulator application timing, and seed treatment for early pest control are all shaped by these intersecting market forces.

What are the key market drivers leading to the rise in the adoption of Agricultural Pesticides Industry?

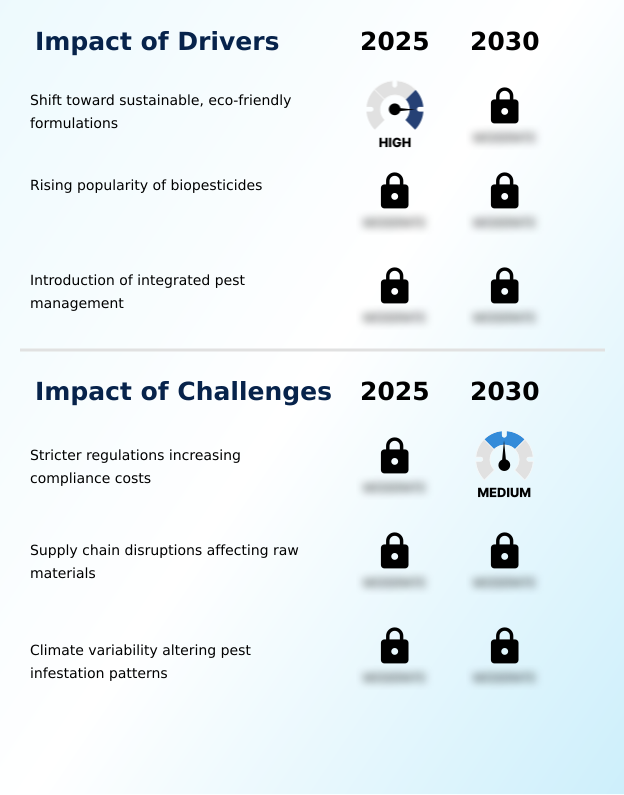
  • A key driver for the market is the industry-wide shift toward sustainable and eco-friendly formulations that minimize environmental impact.

  • Market growth is significantly influenced by a structural shift toward sustainability and integrated agricultural practices. The rising popularity of biopesticides, a cornerstone of climate-smart agriculture and eco-friendly formulations, is a primary driver.
  • The adoption of Integrated Pest Management (IPM) programs can reduce reliance on conventional fungicides by 30-50% in certain high-value crops, contributing to soil health improvement.
  • Furthermore, regulatory bodies are increasingly offering fast-track approval pathways for these biological control agents, with review times being up to 24 months shorter than for new synthetic molecules.
  • This policy support, combined with consumer demand for residue-free food production, is accelerating investment in microbial pesticides and botanical extracts, fundamentally altering crop protection portfolios and promoting environmental stewardship.

What are the market trends shaping the Agricultural Pesticides Industry?

  • A primary trend shaping the market is the increasing demand for pesticides, driven by the continuous rise in global food requirements. This necessity to protect crop yields underpins market momentum.

  • Key trends are reshaping the global agricultural pesticides market 2026-2030, driven by the need for greater efficiency and sustainability. The growing adoption of precision spraying technologies, including drone-based systems, can increase application accuracy by over 40% in complex terrains, optimizing the use of insecticides. This aligns with a broader shift toward sustainable farming practices and crop management solutions.
  • Concurrently, the emergence of nano-insecticide innovations is significant, with research indicating that these advanced delivery systems can reduce the required volume of active ingredients by up to 50% while maintaining high efficacy.
  • This trend addresses both environmental impact reduction and the challenge of pesticide resistance, representing a transformative step in agricultural input technology and supporting both organic farming methods and conventional agriculture.

What challenges does the Agricultural Pesticides Industry face during its growth?

  • A significant challenge impacting the industry involves increasingly stringent regulations, which elevate compliance costs for market participants.

  • The global agricultural pesticides market 2026-2030 faces significant hurdles from stringent regulations and volatile supply chains. Regulatory compliance costs are a major factor, with the expense of bringing a new chemical active ingredient to market rising substantially; compliance now accounts for over 30% of total R&D expenditure. This financial pressure is compounded by supply chain disruptions for essential intermediates.
  • Price volatility for these materials has led to cost spikes exceeding 200% during periods of disruption, impacting the production of broad-spectrum herbicides. These challenges are forcing a strategic pivot toward post-patent crop protection, diversifying sourcing, and investing in less regulated but effective plant growth regulators to ensure stability and manage pest infestation patterns.

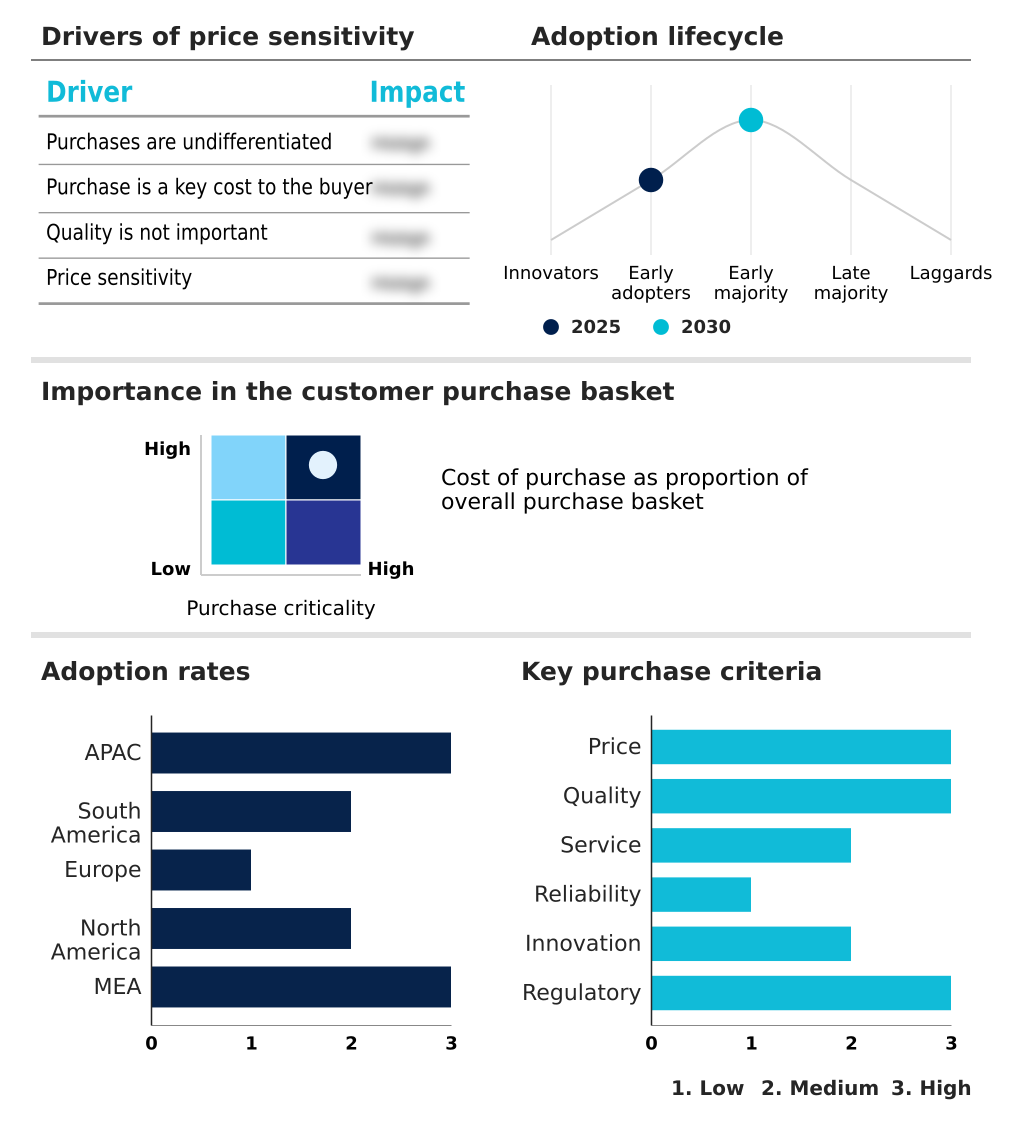
Exclusive Technavio Analysis on Customer Landscape

The agricultural pesticides market forecasting report includes the adoption lifecycle of the market, covering from the innovator’s stage to the laggard’s stage. It focuses on adoption rates in different regions based on penetration. Furthermore, the agricultural pesticides market report also includes key purchase criteria and drivers of price sensitivity to help companies evaluate and develop their market growth analysis strategies.

Customer Landscape of Agricultural Pesticides Industry

Competitive Landscape

Companies are implementing various strategies, such as strategic alliances, agricultural pesticides market forecast, partnerships, mergers and acquisitions, geographical expansion, and product/service launches, to enhance their presence in the industry.

ADAMA Ltd. - Offers a comprehensive portfolio of crop protection solutions, including herbicides, insecticides, and fungicides, designed to control pests and enhance agricultural yields.

The industry research and growth report includes detailed analyses of the competitive landscape of the market and information about key companies, including:

  • ADAMA Ltd.
  • Albaugh LLC
  • AMVAC Chemical Corp.
  • BASF SE
  • Bayer AG
  • Coromandel International Ltd.
  • Corteva Inc.
  • Dhanuka Agritech Ltd.
  • FMC Corp.
  • Gowan Co.
  • HELM AG
  • KUMIAI CHEMICAL INDUSTRY CO.
  • Mitsui Chemicals Inc.
  • Nissan Chemical Corp.
  • Nufarm Ltd.
  • PI Industries Ltd.
  • Rallis India Ltd.
  • Syngenta Crop Protection AG
  • UPL Ltd.
  • Wynca Group

Qualitative and quantitative analysis of companies has been conducted to help clients understand the wider business environment as well as the strengths and weaknesses of key industry players. Data is qualitatively analyzed to categorize companies as pure play, category-focused, industry-focused, and diversified; it is quantitatively analyzed to categorize companies as dominant, leading, strong, tentative, and weak.

Recent Development and News in Agricultural pesticides market

  • In August 2024, Corteva Agriscience launched Ligate in Argentina, a specialized herbicide designed to address complex weed management challenges that have hindered productivity.
  • In February 2025, BASF SE initiated the registration process for Prexio Active, a novel insecticide specifically designed to manage rice hopper species in the Asia-Pacific region.
  • In March 2025, FMC Corp. and Bayer AG entered into a strategic partnership to introduce the Isoflex active herbicide technology to European markets for cereal crops.
  • In May 2025, BioWorks launched PRINCIPLE WP, a bioinsecticide based on the fungus Beauveria bassiana, into the United States market for horticultural applications.

Dive into Technavio’s robust research methodology, blending expert interviews, extensive data synthesis, and validated models for unparalleled Agricultural Pesticides Market insights. See full methodology.

Market Scope
Page number 300
Base year 2025
Historic period 2020-2024
Forecast period 2026-2030
Growth momentum & CAGR Accelerate at a CAGR of 4.2%
Market growth 2026-2030 USD 25923.1 million
Market structure Fragmented
YoY growth 2025-2026(%) 4.0%
Key countries China, Japan, India, South Korea, Australia, Indonesia, Brazil, Argentina, Chile, Germany, France, UK, Italy, Spain, The Netherlands, US, Canada, Mexico, South Africa, Saudi Arabia, Turkey, UAE and Israel
Competitive landscape Leading Companies, Market Positioning of Companies, Competitive Strategies, and Industry Risks

Request Free Sample

Research Analyst Overview

  • The agricultural pesticides market is evolving from a reliance on high-volume synthetic pesticides toward a sophisticated ecosystem of targeted solutions. This transition is driven by the dual imperatives of enhancing crop yield protection and adhering to stringent environmental standards.
  • The core of this shift lies in advanced agricultural biotechnology, which enables the development of selective insecticides, systemic fungicides, and specialized seed treatments. Innovations in chemical active ingredient synthesis and nano-insecticide formulation are improving pest control performance while facilitating chemical residue reduction.
  • The rising adoption of biopesticides and biological insect control methods is compelling executive boards to reallocate R&D budgets toward microbial pesticide development and sustainable crop protection. Companies leveraging precision agriculture technology have reported up to a 35% improvement in application efficiency, a key metric for demonstrating ROI.
  • This focus on efficiency and sustainability is essential for navigating the complex landscape of pesticide resistance management and achieving long-term growth.

What are the Key Data Covered in this Agricultural Pesticides Market Research and Growth Report?

  • What is the expected growth of the Agricultural Pesticides Market between 2026 and 2030?

    • USD 25.92 billion, at a CAGR of 4.2%

  • What segmentation does the market report cover?

    • The report is segmented by Type (Herbicides, Insecticides, Fungicides and bactericides, and Others), Product (Synthetic pesticides, and Biopesticides), Formulation (Liquid, Emulsifiable concentrate, Granular, and Wettable powder) and Geography (APAC, South America, Europe, North America, Middle East and Africa)

  • Which regions are analyzed in the report?

    • APAC, South America, Europe, North America and Middle East and Africa

  • What are the key growth drivers and market challenges?

    • Shift toward sustainable, eco‑friendly formulations, Stricter regulations increasing compliance costs

  • Who are the major players in the Agricultural Pesticides Market?

    • ADAMA Ltd., Albaugh LLC, AMVAC Chemical Corp., BASF SE, Bayer AG, Coromandel International Ltd., Corteva Inc., Dhanuka Agritech Ltd., FMC Corp., Gowan Co., HELM AG, KUMIAI CHEMICAL INDUSTRY CO., Mitsui Chemicals Inc., Nissan Chemical Corp., Nufarm Ltd., PI Industries Ltd., Rallis India Ltd., Syngenta Crop Protection AG, UPL Ltd. and Wynca Group

Market Research Insights

  • The agricultural pesticides market is defined by a dynamic interplay between productivity mandates and sustainability goals, driving significant agrochemical innovation. The adoption of precision spraying technologies has demonstrated an ability to reduce chemical runoff by up to 60%, directly supporting environmental stewardship.
  • Concurrently, adherence to integrated pest management (IPM) protocols has been linked to a 25% improvement in market acceptance for export crops due to lower chemical residues, a critical factor for producers targeting residue-free food production. This shift compels a focus on a diversified crop protection portfolio, including biological control agents and advanced formulations.
  • As a result, sustainable production systems are becoming the standard, aligning with consumer demand for chemical-free produce and stricter phytosanitary regulations across global supply chains.

We can help! Our analysts can customize this agricultural pesticides market research report to meet your requirements.

Get in touch

1. Executive Summary

1.1 Market overview

Executive Summary - Chart on Market Overview
Executive Summary - Data Table on Market Overview
Executive Summary - Chart on Global Market Characteristics
Executive Summary - Chart on Market by Geography
Executive Summary - Chart on Market Segmentation by Type
Executive Summary - Chart on Market Segmentation by Product
Executive Summary - Chart on Market Segmentation by Formulation
Executive Summary - Chart on Incremental Growth
Executive Summary - Data Table on Incremental Growth
Executive Summary - Chart on Company Market Positioning

2. Technavio Analysis

2.1 Analysis of price sensitivity, lifecycle, customer purchase basket, adoption rates, and purchase criteria

2.2 Criticality of inputs and Factors of differentiation

Chart on Overview on criticality of inputs and factors of differentiation

2.3 Factors of disruption

Chart on Overview on factors of disruption

2.4 Impact of drivers and challenges

Chart on Impact of drivers and challenges in 2025 and 2030

3. Market Landscape

3.1 Market ecosystem

Chart on Parent Market
Data Table on - Parent Market

3.2 Market characteristics

Chart on Market characteristics analysis

3.3 Value chain analysis

Chart on Value chain analysis

4. Market Sizing

4.1 Market definition

Data Table on Offerings of companies included in the market definition

4.2 Market segment analysis

Market segments

4.3 Market size 2025

4.4 Market outlook: Forecast for 2025-2030

Chart on Global - Market size and forecast 2025-2030 ($ million)
Data Table on Global - Market size and forecast 2025-2030 ($ million)
Chart on Global Market: Year-over-year growth 2025-2030 (%)
Data Table on Global Market: Year-over-year growth 2025-2030 (%)

5. Historic Market Size

5.1 Global Agricultural Pesticides Market 2020 - 2024

Historic Market Size - Data Table on Global Agricultural Pesticides Market 2020 - 2024 ($ million)

5.2 Type segment analysis 2020 - 2024

Historic Market Size - Type Segment 2020 - 2024 ($ million)

5.3 Product segment analysis 2020 - 2024

Historic Market Size - Product Segment 2020 - 2024 ($ million)

5.4 Formulation segment analysis 2020 - 2024

Historic Market Size - Formulation Segment 2020 - 2024 ($ million)

5.5 Geography segment analysis 2020 - 2024

Historic Market Size - Geography Segment 2020 - 2024 ($ million)

5.6 Country segment analysis 2020 - 2024

Historic Market Size - Country Segment 2020 - 2024 ($ million)

6. Qualitative Analysis

6.1 The AI Impact on Global Agricultural Pesticides Market

7. Five Forces Analysis

7.1 Five forces summary

Five forces analysis - Comparison between 2025 and 2030

7.2 Bargaining power of buyers

Bargaining power of buyers - Impact of key factors 2025 and 2030

7.3 Bargaining power of suppliers

Bargaining power of suppliers - Impact of key factors in 2025 and 2030

7.4 Threat of new entrants

Threat of new entrants - Impact of key factors in 2025 and 2030

7.5 Threat of substitutes

Threat of substitutes - Impact of key factors in 2025 and 2030

7.6 Threat of rivalry

Threat of rivalry - Impact of key factors in 2025 and 2030

7.7 Market condition

Chart on Market condition - Five forces 2025 and 2030

8. Market Segmentation by Type

8.1 Market segments

Chart on Type - Market share 2025-2030 (%)
Data Table on Type - Market share 2025-2030 (%)

8.2 Comparison by Type

Chart on Comparison by Type
Data Table on Comparison by Type

8.3 Herbicides - Market size and forecast 2025-2030

Chart on Herbicides - Market size and forecast 2025-2030 ($ million)
Data Table on Herbicides - Market size and forecast 2025-2030 ($ million)
Chart on Herbicides - Year-over-year growth 2025-2030 (%)
Data Table on Herbicides - Year-over-year growth 2025-2030 (%)

8.4 Insecticides - Market size and forecast 2025-2030

Chart on Insecticides - Market size and forecast 2025-2030 ($ million)
Data Table on Insecticides - Market size and forecast 2025-2030 ($ million)
Chart on Insecticides - Year-over-year growth 2025-2030 (%)
Data Table on Insecticides - Year-over-year growth 2025-2030 (%)

8.5 Fungicides and bactericides - Market size and forecast 2025-2030

Chart on Fungicides and bactericides - Market size and forecast 2025-2030 ($ million)
Data Table on Fungicides and bactericides - Market size and forecast 2025-2030 ($ million)
Chart on Fungicides and bactericides - Year-over-year growth 2025-2030 (%)
Data Table on Fungicides and bactericides - Year-over-year growth 2025-2030 (%)

8.6 Others - Market size and forecast 2025-2030

Chart on Others - Market size and forecast 2025-2030 ($ million)
Data Table on Others - Market size and forecast 2025-2030 ($ million)
Chart on Others - Year-over-year growth 2025-2030 (%)
Data Table on Others - Year-over-year growth 2025-2030 (%)

8.7 Market opportunity by Type

Market opportunity by Type ($ million)
Data Table on Market opportunity by Type ($ million)

9. Market Segmentation by Product

9.1 Market segments

Chart on Product - Market share 2025-2030 (%)
Data Table on Product - Market share 2025-2030 (%)

9.2 Comparison by Product

Chart on Comparison by Product
Data Table on Comparison by Product

9.3 Synthetic pesticides - Market size and forecast 2025-2030

Chart on Synthetic pesticides - Market size and forecast 2025-2030 ($ million)
Data Table on Synthetic pesticides - Market size and forecast 2025-2030 ($ million)
Chart on Synthetic pesticides - Year-over-year growth 2025-2030 (%)
Data Table on Synthetic pesticides - Year-over-year growth 2025-2030 (%)

9.4 Biopesticides - Market size and forecast 2025-2030

Chart on Biopesticides - Market size and forecast 2025-2030 ($ million)
Data Table on Biopesticides - Market size and forecast 2025-2030 ($ million)
Chart on Biopesticides - Year-over-year growth 2025-2030 (%)
Data Table on Biopesticides - Year-over-year growth 2025-2030 (%)

9.5 Market opportunity by Product

Market opportunity by Product ($ million)
Data Table on Market opportunity by Product ($ million)

10. Market Segmentation by Formulation

10.1 Market segments

Chart on Formulation - Market share 2025-2030 (%)
Data Table on Formulation - Market share 2025-2030 (%)

10.2 Comparison by Formulation

Chart on Comparison by Formulation
Data Table on Comparison by Formulation

10.3 Liquid - Market size and forecast 2025-2030

Chart on Liquid - Market size and forecast 2025-2030 ($ million)
Data Table on Liquid - Market size and forecast 2025-2030 ($ million)
Chart on Liquid - Year-over-year growth 2025-2030 (%)
Data Table on Liquid - Year-over-year growth 2025-2030 (%)

10.4 Emulsifiable concentrate - Market size and forecast 2025-2030

Chart on Emulsifiable concentrate - Market size and forecast 2025-2030 ($ million)
Data Table on Emulsifiable concentrate - Market size and forecast 2025-2030 ($ million)
Chart on Emulsifiable concentrate - Year-over-year growth 2025-2030 (%)
Data Table on Emulsifiable concentrate - Year-over-year growth 2025-2030 (%)

10.5 Granular - Market size and forecast 2025-2030

Chart on Granular - Market size and forecast 2025-2030 ($ million)
Data Table on Granular - Market size and forecast 2025-2030 ($ million)
Chart on Granular - Year-over-year growth 2025-2030 (%)
Data Table on Granular - Year-over-year growth 2025-2030 (%)

10.6 Wettable powder - Market size and forecast 2025-2030

Chart on Wettable powder - Market size and forecast 2025-2030 ($ million)
Data Table on Wettable powder - Market size and forecast 2025-2030 ($ million)
Chart on Wettable powder - Year-over-year growth 2025-2030 (%)
Data Table on Wettable powder - Year-over-year growth 2025-2030 (%)

10.7 Market opportunity by Formulation

Market opportunity by Formulation ($ million)
Data Table on Market opportunity by Formulation ($ million)

11. Customer Landscape

11.1 Customer landscape overview

Analysis of price sensitivity, lifecycle, customer purchase basket, adoption rates, and purchase criteria

12. Geographic Landscape

12.1 Geographic segmentation

Chart on Market share by geography 2025-2030 (%)
Data Table on Market share by geography 2025-2030 (%)

12.2 Geographic comparison

Chart on Geographic comparison
Data Table on Geographic comparison

12.3 APAC - Market size and forecast 2025-2030

Chart on APAC - Market size and forecast 2025-2030 ($ million)
Data Table on APAC - Market size and forecast 2025-2030 ($ million)
Chart on APAC - Year-over-year growth 2025-2030 (%)
Data Table on APAC - Year-over-year growth 2025-2030 (%)
Chart on Regional Comparison - APAC
Data Table on Regional Comparison - APAC

12.3.1 China - Market size and forecast 2025-2030

Chart on China - Market size and forecast 2025-2030 ($ million)
Data Table on China - Market size and forecast 2025-2030 ($ million)
Chart on China - Year-over-year growth 2025-2030 (%)
Data Table on China - Year-over-year growth 2025-2030 (%)

12.3.2 Japan - Market size and forecast 2025-2030

Chart on Japan - Market size and forecast 2025-2030 ($ million)
Data Table on Japan - Market size and forecast 2025-2030 ($ million)
Chart on Japan - Year-over-year growth 2025-2030 (%)
Data Table on Japan - Year-over-year growth 2025-2030 (%)

12.3.3 India - Market size and forecast 2025-2030

Chart on India - Market size and forecast 2025-2030 ($ million)
Data Table on India - Market size and forecast 2025-2030 ($ million)
Chart on India - Year-over-year growth 2025-2030 (%)
Data Table on India - Year-over-year growth 2025-2030 (%)

12.3.4 South Korea - Market size and forecast 2025-2030

Chart on South Korea - Market size and forecast 2025-2030 ($ million)
Data Table on South Korea - Market size and forecast 2025-2030 ($ million)
Chart on South Korea - Year-over-year growth 2025-2030 (%)
Data Table on South Korea - Year-over-year growth 2025-2030 (%)

12.3.5 Australia - Market size and forecast 2025-2030

Chart on Australia - Market size and forecast 2025-2030 ($ million)
Data Table on Australia - Market size and forecast 2025-2030 ($ million)
Chart on Australia - Year-over-year growth 2025-2030 (%)
Data Table on Australia - Year-over-year growth 2025-2030 (%)

12.3.6 Indonesia - Market size and forecast 2025-2030

Chart on Indonesia - Market size and forecast 2025-2030 ($ million)
Data Table on Indonesia - Market size and forecast 2025-2030 ($ million)
Chart on Indonesia - Year-over-year growth 2025-2030 (%)
Data Table on Indonesia - Year-over-year growth 2025-2030 (%)

12.4 South America - Market size and forecast 2025-2030

Chart on South America - Market size and forecast 2025-2030 ($ million)
Data Table on South America - Market size and forecast 2025-2030 ($ million)
Chart on South America - Year-over-year growth 2025-2030 (%)
Data Table on South America - Year-over-year growth 2025-2030 (%)
Chart on Regional Comparison - South America
Data Table on Regional Comparison - South America

12.4.1 Brazil - Market size and forecast 2025-2030

Chart on Brazil - Market size and forecast 2025-2030 ($ million)
Data Table on Brazil - Market size and forecast 2025-2030 ($ million)
Chart on Brazil - Year-over-year growth 2025-2030 (%)
Data Table on Brazil - Year-over-year growth 2025-2030 (%)

12.4.2 Argentina - Market size and forecast 2025-2030

Chart on Argentina - Market size and forecast 2025-2030 ($ million)
Data Table on Argentina - Market size and forecast 2025-2030 ($ million)
Chart on Argentina - Year-over-year growth 2025-2030 (%)
Data Table on Argentina - Year-over-year growth 2025-2030 (%)

12.4.3 Chile - Market size and forecast 2025-2030

Chart on Chile - Market size and forecast 2025-2030 ($ million)
Data Table on Chile - Market size and forecast 2025-2030 ($ million)
Chart on Chile - Year-over-year growth 2025-2030 (%)
Data Table on Chile - Year-over-year growth 2025-2030 (%)

12.5 Europe - Market size and forecast 2025-2030

Chart on Europe - Market size and forecast 2025-2030 ($ million)
Data Table on Europe - Market size and forecast 2025-2030 ($ million)
Chart on Europe - Year-over-year growth 2025-2030 (%)
Data Table on Europe - Year-over-year growth 2025-2030 (%)
Chart on Regional Comparison - Europe
Data Table on Regional Comparison - Europe

12.5.1 Germany - Market size and forecast 2025-2030

Chart on Germany - Market size and forecast 2025-2030 ($ million)
Data Table on Germany - Market size and forecast 2025-2030 ($ million)
Chart on Germany - Year-over-year growth 2025-2030 (%)
Data Table on Germany - Year-over-year growth 2025-2030 (%)

12.5.2 France - Market size and forecast 2025-2030

Chart on France - Market size and forecast 2025-2030 ($ million)
Data Table on France - Market size and forecast 2025-2030 ($ million)
Chart on France - Year-over-year growth 2025-2030 (%)
Data Table on France - Year-over-year growth 2025-2030 (%)

12.5.3 UK - Market size and forecast 2025-2030

Chart on UK - Market size and forecast 2025-2030 ($ million)
Data Table on UK - Market size and forecast 2025-2030 ($ million)
Chart on UK - Year-over-year growth 2025-2030 (%)
Data Table on UK - Year-over-year growth 2025-2030 (%)

12.5.4 Italy - Market size and forecast 2025-2030

Chart on Italy - Market size and forecast 2025-2030 ($ million)
Data Table on Italy - Market size and forecast 2025-2030 ($ million)
Chart on Italy - Year-over-year growth 2025-2030 (%)
Data Table on Italy - Year-over-year growth 2025-2030 (%)

12.5.5 Spain - Market size and forecast 2025-2030

Chart on Spain - Market size and forecast 2025-2030 ($ million)
Data Table on Spain - Market size and forecast 2025-2030 ($ million)
Chart on Spain - Year-over-year growth 2025-2030 (%)
Data Table on Spain - Year-over-year growth 2025-2030 (%)

12.5.6 The Netherlands - Market size and forecast 2025-2030

Chart on The Netherlands - Market size and forecast 2025-2030 ($ million)
Data Table on The Netherlands - Market size and forecast 2025-2030 ($ million)
Chart on The Netherlands - Year-over-year growth 2025-2030 (%)
Data Table on The Netherlands - Year-over-year growth 2025-2030 (%)

12.6 North America - Market size and forecast 2025-2030

Chart on North America - Market size and forecast 2025-2030 ($ million)
Data Table on North America - Market size and forecast 2025-2030 ($ million)
Chart on North America - Year-over-year growth 2025-2030 (%)
Data Table on North America - Year-over-year growth 2025-2030 (%)
Chart on Regional Comparison - North America
Data Table on Regional Comparison - North America

12.6.1 US - Market size and forecast 2025-2030

Chart on US - Market size and forecast 2025-2030 ($ million)
Data Table on US - Market size and forecast 2025-2030 ($ million)
Chart on US - Year-over-year growth 2025-2030 (%)
Data Table on US - Year-over-year growth 2025-2030 (%)

12.6.2 Canada - Market size and forecast 2025-2030

Chart on Canada - Market size and forecast 2025-2030 ($ million)
Data Table on Canada - Market size and forecast 2025-2030 ($ million)
Chart on Canada - Year-over-year growth 2025-2030 (%)
Data Table on Canada - Year-over-year growth 2025-2030 (%)

12.6.3 Mexico - Market size and forecast 2025-2030

Chart on Mexico - Market size and forecast 2025-2030 ($ million)
Data Table on Mexico - Market size and forecast 2025-2030 ($ million)
Chart on Mexico - Year-over-year growth 2025-2030 (%)
Data Table on Mexico - Year-over-year growth 2025-2030 (%)

12.7 Middle East and Africa - Market size and forecast 2025-2030

Chart on Middle East and Africa - Market size and forecast 2025-2030 ($ million)
Data Table on Middle East and Africa - Market size and forecast 2025-2030 ($ million)
Chart on Middle East and Africa - Year-over-year growth 2025-2030 (%)
Data Table on Middle East and Africa - Year-over-year growth 2025-2030 (%)
Chart on Regional Comparison - Middle East and Africa
Data Table on Regional Comparison - Middle East and Africa

12.7.1 South Africa - Market size and forecast 2025-2030

Chart on South Africa - Market size and forecast 2025-2030 ($ million)
Data Table on South Africa - Market size and forecast 2025-2030 ($ million)
Chart on South Africa - Year-over-year growth 2025-2030 (%)
Data Table on South Africa - Year-over-year growth 2025-2030 (%)

12.7.2 Saudi Arabia - Market size and forecast 2025-2030

Chart on Saudi Arabia - Market size and forecast 2025-2030 ($ million)
Data Table on Saudi Arabia - Market size and forecast 2025-2030 ($ million)
Chart on Saudi Arabia - Year-over-year growth 2025-2030 (%)
Data Table on Saudi Arabia - Year-over-year growth 2025-2030 (%)

12.7.3 Turkey - Market size and forecast 2025-2030

Chart on Turkey - Market size and forecast 2025-2030 ($ million)
Data Table on Turkey - Market size and forecast 2025-2030 ($ million)
Chart on Turkey - Year-over-year growth 2025-2030 (%)
Data Table on Turkey - Year-over-year growth 2025-2030 (%)

12.7.4 UAE - Market size and forecast 2025-2030

Chart on UAE - Market size and forecast 2025-2030 ($ million)
Data Table on UAE - Market size and forecast 2025-2030 ($ million)
Chart on UAE - Year-over-year growth 2025-2030 (%)
Data Table on UAE - Year-over-year growth 2025-2030 (%)

12.7.5 Israel - Market size and forecast 2025-2030

Chart on Israel - Market size and forecast 2025-2030 ($ million)
Data Table on Israel - Market size and forecast 2025-2030 ($ million)
Chart on Israel - Year-over-year growth 2025-2030 (%)
Data Table on Israel - Year-over-year growth 2025-2030 (%)

12.8 Market opportunity by geography

Market opportunity by geography ($ million)
Data Tables on Market opportunity by geography ($ million)

13. Drivers, Challenges, and Opportunity

13.1 Market drivers

Shift toward sustainable, eco‑friendly formulations
Rising popularity of biopesticides
Introduction of integrated pest management

13.2 Market challenges

Stricter regulations increasing compliance costs
Supply chain disruptions affecting raw materials
Climate variability altering pest infestation patterns

13.3 Impact of drivers and challenges

Impact of drivers and challenges in 2025 and 2030

13.4 Market opportunities

Rising food demand driving pesticide usage
Growing adoption of precision spraying technologies
Rapid emergence of nano‑insecticide innovations

14. Competitive Landscape

14.1 Overview

14.2

Overview on criticality of inputs and factors of differentiation

14.3 Landscape disruption

Overview on factors of disruption

14.4 Industry risks

Impact of key risks on business

15. Competitive Analysis

15.1 Companies profiled

Companies covered

15.2 Company ranking index

15.3 Market positioning of companies

Matrix on companies position and classification

15.4 ADAMA Ltd.

ADAMA Ltd. - Overview
ADAMA Ltd. - Product / Service
ADAMA Ltd. - Key offerings
SWOT

15.5 AMVAC Chemical Corp.

AMVAC Chemical Corp. - Overview
AMVAC Chemical Corp. - Product / Service
AMVAC Chemical Corp. - Key offerings
SWOT

15.6 BASF SE

BASF SE - Overview
BASF SE - Business segments
BASF SE - Key news
BASF SE - Key offerings
BASF SE - Segment focus
SWOT

15.7 Bayer AG

Bayer AG - Overview
Bayer AG - Business segments
Bayer AG - Key news
Bayer AG - Key offerings
Bayer AG - Segment focus
SWOT

15.8 Coromandel International Ltd.

Coromandel International Ltd. - Overview
Coromandel International Ltd. - Business segments
Coromandel International Ltd. - Key news
Coromandel International Ltd. - Key offerings
Coromandel International Ltd. - Segment focus
SWOT

15.9 Corteva Inc.

Corteva Inc. - Overview
Corteva Inc. - Business segments
Corteva Inc. - Key news
Corteva Inc. - Key offerings
Corteva Inc. - Segment focus
SWOT

15.10 Dhanuka Agritech Ltd.

Dhanuka Agritech Ltd. - Overview
Dhanuka Agritech Ltd. - Product / Service
Dhanuka Agritech Ltd. - Key offerings
SWOT

15.11 FMC Corp.

FMC Corp. - Overview
FMC Corp. - Product / Service
FMC Corp. - Key offerings
SWOT

15.12 Gowan Co.

Gowan Co. - Overview
Gowan Co. - Product / Service
Gowan Co. - Key offerings
SWOT

15.13 KUMIAI CHEMICAL INDUSTRY CO.

KUMIAI CHEMICAL INDUSTRY CO. - Overview
KUMIAI CHEMICAL INDUSTRY CO. - Product / Service
KUMIAI CHEMICAL INDUSTRY CO. - Key offerings
SWOT

15.14 Mitsui Chemicals Inc.

Mitsui Chemicals Inc. - Overview
Mitsui Chemicals Inc. - Business segments
Mitsui Chemicals Inc. - Key offerings
Mitsui Chemicals Inc. - Segment focus
SWOT

15.15 Nissan Chemical Corp.

Nissan Chemical Corp. - Overview
Nissan Chemical Corp. - Business segments
Nissan Chemical Corp. - Key offerings
Nissan Chemical Corp. - Segment focus
SWOT

15.16 Nufarm Ltd.

Nufarm Ltd. - Overview
Nufarm Ltd. - Business segments
Nufarm Ltd. - Key offerings
Nufarm Ltd. - Segment focus
SWOT

15.17 Syngenta Crop Protection AG

Syngenta Crop Protection AG - Overview
Syngenta Crop Protection AG - Product / Service
Syngenta Crop Protection AG - Key offerings
SWOT

15.18 UPL Ltd.

UPL Ltd. - Overview
UPL Ltd. - Business segments
UPL Ltd. - Key offerings
UPL Ltd. - Segment focus
SWOT

16. Appendix

16.1 Scope of the report

Market definition
Objectives
Notes and caveats

16.2 Inclusions and exclusions checklist

Inclusions checklist
Exclusions checklist

16.3 Currency conversion rates for US$

16.4 Research methodology

16.5 Data procurement

Information sources

16.6 Data validation

16.7 Validation techniques employed for market sizing

16.8 Data synthesis

16.9 360 degree market analysis

16.10 List of abbreviations

Research Methodology

Technavio presents a detailed picture of the market by way of study, synthesis, and summation of data from multiple sources. The analysts have presented the various facets of the market with a particular focus on identifying the key industry influencers. The data thus presented is comprehensive, reliable, and the result of extensive research, both primary and secondary.

INFORMATION SOURCES

Primary sources

  • Manufacturers and suppliers
  • Channel partners
  • Industry experts
  • Strategic decision makers

Secondary sources

  • Industry journals and periodicals
  • Government data
  • Financial reports of key industry players
  • Historical data
  • Press releases

DATA ANALYSIS

Data Synthesis

  • Collation of data
  • Estimation of key figures
  • Analysis of derived insights

Data Validation

  • Triangulation with data models
  • Reference against proprietary databases
  • Corroboration with industry experts

REPORT WRITING

Qualitative

  • Market drivers
  • Market challenges
  • Market trends
  • Five forces analysis

Quantitative

  • Market size and forecast
  • Market segmentation
  • Geographical insights
  • Competitive landscape

Interested in this report?

Get your sample now to see our research methodology and insights!

Download Now

Frequently Asked Questions

Agricultural Pesticides market growth will increase by USD 25923.1 million during 2026-2030.

The Agricultural Pesticides market is expected to grow at a CAGR of 4.2% during 2026-2030.

Agricultural Pesticides market is segmented by Type (Herbicides, Insecticides, Fungicides and bactericides, Others) Product (Synthetic pesticides, Biopesticides) Formulation (Liquid, Emulsifiable concentrate, Granular, Wettable powder)

ADAMA Ltd., Albaugh LLC, AMVAC Chemical Corp., BASF SE, Bayer AG, Coromandel International Ltd., Corteva Inc., Dhanuka Agritech Ltd., FMC Corp., Gowan Co., HELM AG, KUMIAI CHEMICAL INDUSTRY CO., Mitsui Chemicals Inc., Nissan Chemical Corp., Nufarm Ltd., PI Industries Ltd., Rallis India Ltd., Syngenta Crop Protection AG, UPL Ltd., Wynca Group are a few of the key vendors in the Agricultural Pesticides market.

APAC will register the highest growth rate of 38.9% among the other regions. Therefore, the Agricultural Pesticides market in APAC is expected to garner significant business opportunities for the vendors during the forecast period.

China, Japan, India, South Korea, Australia, Indonesia, Brazil, Argentina, Chile, Germany, France, UK, Italy, Spain, The Netherlands, US, Canada, Mexico, South Africa, Saudi Arabia, Turkey, UAE, Israel

  • Shift toward sustainable, eco‑friendly formulations is the driving factor this market.

The Agricultural Pesticides market vendors should focus on grabbing business opportunities from the Type segment as it accounted for the largest market share in the base year.