Agrivoltaics Market Size 2024-2028
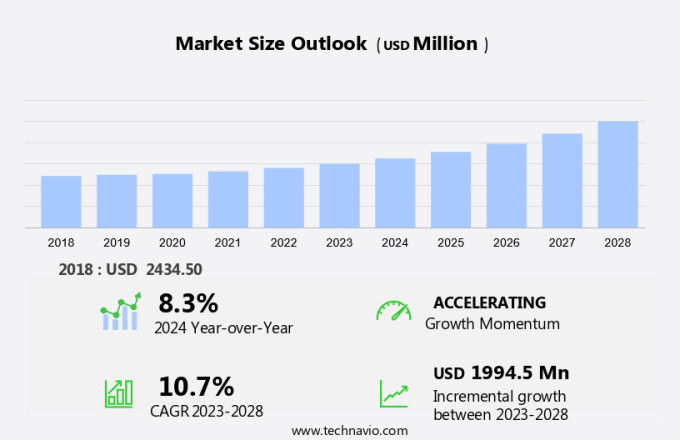
The agrivoltaics market size is forecast to increase by USD 1.99 billion at a CAGR of 10.7% between 2023 and 2028. Agrivoltaics, the integration of agriculture and photovoltaics, is gaining traction as a sustainable solution for energy production and farming. This approach allows for the co-location of solar panels and agricultural production, maximizing land use efficiency. Dynamic agrivoltaics, a system that adjusts solar panel angles to optimize solar energy capture and plant growth, is particularly promising. Microcrystalline, polycrystalline, and monocrystalline solar panels (solar panels market) are commonly used in agrivoltaics projects. Vegetables and fruits are popular crops grown under these systems due to their compatibility with the intermittent nature of solar power. The energy transition and the need for sustainable farming practices are driving the growth of the market. Additionally, the integration of agrivoltaics with grazing livestock can enhance biodiversity and improve overall farm productivity. However, the market for agrivoltaics is still in its infancy, with limited commercial reach. Despite this, the benefits of this innovative approach to energy production and agriculture are compelling, making it an area of significant potential for future growth. The integration of agrivoltaics into farming operations can lead to reduced greenhouse gas emissions, increased energy independence, and improved agricultural yields. As the world continues to seek sustainable solutions for energy production and food production, agrivoltaics is poised to play an increasingly important role.
In conclusion, the market is experiencing steady growth due to its ability to provide sustainable energy and agricultural solutions. The integration of dynamic agrivoltaics systems, such as those that adjust solar panel angles for optimal energy capture and plant growth, is particularly promising. Vegetables, fruits, and even grazing livestock can thrive under these systems, making agrivoltaics an attractive option for farmers and energy producers alike. While the market still faces challenges related to commercialization, the long-term benefits of this innovative approach make it a worthwhile investment for those seeking to contribute to the energy transition and sustainable farming practices.
What will be the Size of the Market During the Forecast Period?
Solar energy and agriculture are two essential sectors that have the potential to significantly contribute to mitigating climate change and addressing food security challenges. Agrivoltaics, an innovative approach that combines solar energy production and agricultural practices, is gaining traction as a promising solution for enhancing crop yields, improving land usage, and reducing greenhouse gas emissions. Agrivoltaics: A Winning Combination: Agrivoltaics refers to the integration of solar panels into agricultural land, allowing for the simultaneous production of solar energy and crops. This approach offers several benefits, including increased land efficiency, enhanced crop yields, and reduced environmental impact.
Additionally, the integration of solar panels into agricultural land does not negatively affect crop yields. In fact, research suggests that certain crops, such as root crops, can benefit from the shade provided by solar panels during the hottest hours of the day. Furthermore, the microclimate created by the solar panels can help retain soil moisture and improve water retention, leading to better crop production. Utility-Scale Solar Farms and Ground-Mounted PV Plants: Agrivoltaics is not limited to small-scale solar installations. Utility-scale solar farms and ground-mounted PV plants can also be configured as agrivoltaic systems. By integrating agriculture into these large-scale solar projects, land usage becomes more efficient, and the environmental impact is reduced.
Also, the array configuration plays a crucial role in the success of agrivoltaics. Fixed arrays and single-axis tracking systems can be used, depending on the specific agricultural practices and solar energy production goals. Monofacial solar panels are commonly used in agrivoltaics due to their lower cost and ease of installation. Environmental Benefits: Agrivoltaics offers several environmental benefits. By producing solar energy on agricultural land, the need for new land clearance for solar farms is reduced. Additionally, the use of organic fertilizers(organic fertilizers market) and rainwater harvesting (Rainwater harvesting market) can help mitigate the environmental impact of solar energy production. Addressing Climate Change and Food Crisis: Agrivoltaics is an essential step towards a sustainable future.
By producing renewable energy and crops on the same land, we can address the challenges of climate change and the potential food crisis. The integration of solar panels into agricultural practices not only increases land efficiency but also reduces greenhouse gas emissions, contributing to a more sustainable and resilient food system. Conclusion: Agrivoltaics represents a promising solution for the future of solar energy and agriculture. By combining the production of solar energy and crops on the same land, we can increase land efficiency, enhance crop yields, and reduce greenhouse gas emissions. As the world faces the challenges of climate change and food security, agrivoltaics offers a sustainable and innovative approach to meeting these challenges.
Market Segmentation
The market research report provides comprehensive data (region-wise segment analysis), with forecasts and estimates in "USD billion" for the period 2024-2028, as well as historical data from 2018-2022 for the following segments.
- Type
- Fixed panel
- Dynamic panel
- Application
- Outdoor farming
- Indoor farming
- Others
- Geography
- North America
- US
- Europe
- Germany
- France
- APAC
- China
- Japan
- Middle East and Africa
- South America
- North America
By Type Insights
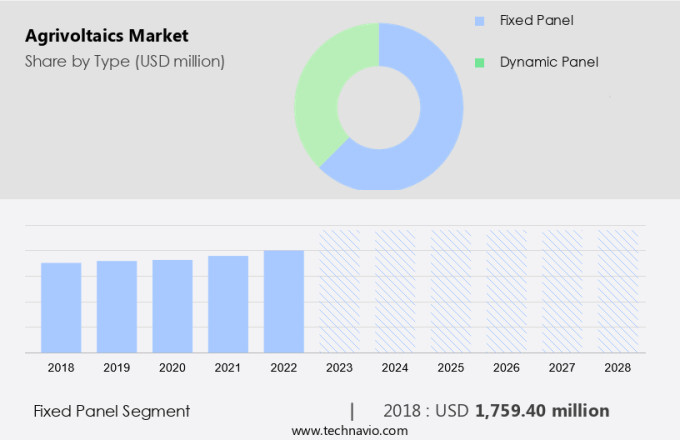
The fixed panel segment is estimated to witness significant growth during the forecast period. Agrivoltaics, the integration of solar energy production and agriculture, is gaining traction in the US market. This innovative approach involves mounting solar panels, either monofacial or bifacial, above agricultural lands, enabling continued farming activities below. Monofacial solar panels capture solar energy from one side, while bifacial panels generate power from both sides, increasing efficiency. Translucent photovoltaic technology is another advancement in this field, allowing sunlight to penetrate the panels and reach the crops beneath. This setup benefits various agricultural activities, including grassland farming, horticulture, and indoor farming(indoor farming market), while also providing pollinator habitats and contributing to carbon sequestration. Fixed panel agrivoltaics, with panels installed at a consistent angle, are popular in large-scale projects exceeding 5 MW.
Additionally, these systems offer dual-revenue streams from both energy production and agriculture. Proper planning is crucial to ensure crops receive adequate sunlight. The integration of renewable energy and agriculture in a single system not only reduces carbon emissions but also enhances agricultural productivity. Fixed panel installations contribute to animal welfare by providing shade and support the growth of permanent flora and grassland. This symbiotic relationship between solar energy and agriculture is a significant step towards sustainable farming practices and energy production in the US.
Get a glance at the market share of various segments Request Free Sample
The fixed panel segment accounted for USD 1.76 billion in 2018 and showed a gradual increase during the forecast period.
Regional Insights
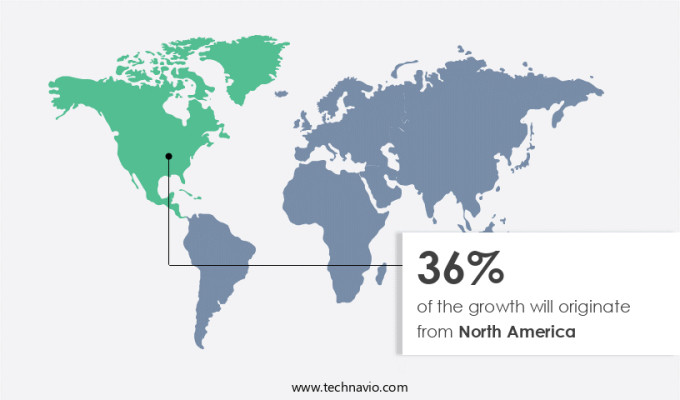
North America is estimated to contribute 36% to the growth of the global market during the forecast period. Technavio's analysts have elaborately explained the regional trends and drivers that shape the market during the forecast period.
For more insights on the market share of various regions Request Free Sample
The market in North America is witnessing notable expansion as solar panels are increasingly integrated into agricultural practices. Federal agencies in the region, such as the United States Department of Agriculture (USDA) and the United States Department of Energy (DOE), have been instrumental in advancing this sector. Notably, DOE's funding for agrivoltaics projects saw a substantial increase from 2021 to 2022, with a USD 8 million initiative dedicated to investigating the advantages of agrivoltaics for farmers and rural communities. In parallel, USDA allocated USD 10 million for agrivoltaics research through the National Institute of Food and Agriculture in 2021, followed by an additional USD 2 million in the same year.
Additionally, these investments reflect the growing recognition of the potential synergies between renewable capacity and agricultural output. Agrivoltaics, also known as dual-use solar, involves the co-location ofsolar photovoltaics (PVs) market systems and agricultural activities. This approach offers numerous benefits, including increased energy production, improved land utilization, and potential crop enhancement through the use of tracking equipment, soil sensors, and data analytics. The choice of crop types and agricultural landscapes can significantly influence the success of agrivoltaics projects. As the market continues to evolve, it is essential to closely monitor trends and developments to maximize the potential of this innovative approach to renewable energy and agriculture.
Our researchers analyzed the data with 2023 as the base year, along with the key drivers, trends, and challenges. A holistic analysis of drivers will help companies refine their marketing strategies to gain a competitive advantage.
Market Driver
Benefits of agrivoltaics is the key driver of the market. Agrivoltaics, the integration of solar panels into crop production, presents a promising solution for addressing both food and power crises in the United States. This innovative approach offers numerous benefits, including improved soil moisture retention and water harvesting capabilities. By installing fixed solar panels above crops, farmers can maximize the use of available land, increasing overall productivity. In semi-arid regions, where soil degradation poses a significant challenge to traditional farming, agrivoltaics offers a viable alternative.
Furthermore, the use of organic fertilizers in agrivoltaic systems can reduce the reliance on chemical fertilizers, contributing to sustainable agricultural practices. The implementation of agrivoltaics can lead to enhanced crop growth and forage quality, making it an attractive option for farmers seeking to optimize their land use. This dual-use approach to agriculture and renewable energy production is gaining traction in the US market, offering a potential solution to the ongoing challenges of food and energy scarcity.
Market Trends
Rising opportunities for agrivoltaics energy projects is the upcoming trend in the market. The market in the United States is experiencing significant growth due to government initiatives and financial investments. France, a pioneer in this sector, has passed legislation enabling solar power projects on farmlands, ensuring agricultural productivity remains unhindered. This legislation, known as the Act APER, was enacted in March 2023 and is a key component of France's national renewable energy strategy.
By 2050, France aims to generate 100 gigawatts of solar energy, with agrivoltaics systems playing a pivotal role alongside traditional solar projects. This integration of agriculture and renewable energy is a strategic move to meet increasing food demand and reduce carbon emissions. The US market is expected to follow suit, with the potential for substantial growth in the coming years.
Market Challenge
Limited commercial reach of agrivoltaics is a key challenge affecting market growth. Agrivoltaics, the integration of agriculture and solar energy, is gaining attention in the energy transition towards sustainability. However, the market's expansion is hindered by the limited range of crops and agricultural conditions tested in dynamic agrivoltaics projects. For instance, in India, most pilots concentrate on specific crops and farming scenarios. To expand the knowledge base, it is essential to design more comprehensive pilots with rigorous testing methods. A primary concern for farmers is the potential decrease in crop yield due to solar panel shading. Although some pilots have reported enhanced yields for certain crops like medicinal herbs and leafy vegetables, overall farmer acceptance of agrivoltaics remains cautious.
To address this concern, research and development efforts are underway to optimize solar panel placement and design, ensuring minimal crop yield loss. Solar panels and vegetable or fruit farming can coexist, offering mutual benefits. Agrivoltaics can provide farmers with additional income through solar energy generation, while solar panels protect crops from extreme weather conditions and reduce evaporation. Furthermore, agrivoltaics can contribute to biodiversity and sustainable farming practices by allowing grazing under solar panels and reducing the need for monoculture farming. In conclusion, the market's growth depends on expanding the range of tested crops and agricultural conditions, optimizing solar panel placement, and addressing farmers' concerns regarding crop yield loss. By addressing these challenges, agrivoltaics can contribute significantly to the energy transition while supporting sustainable farming practices.
Exclusive Customer Landscape
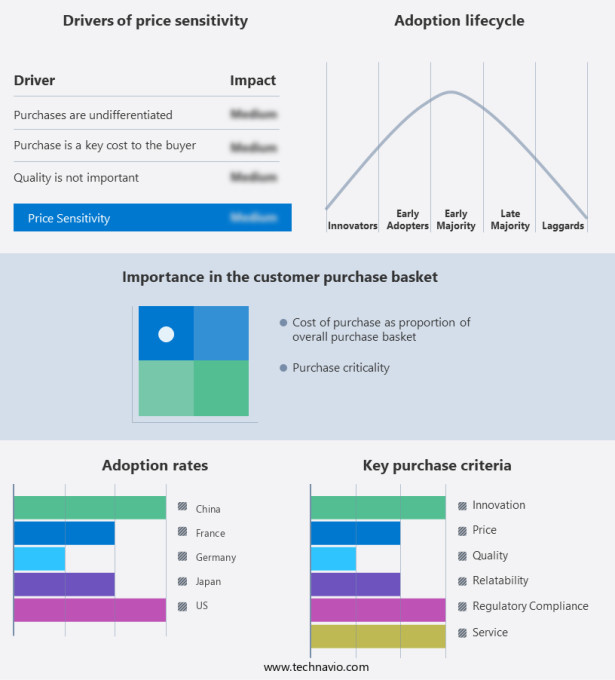
The market forecasting report includes the adoption lifecycle of the market, covering from the innovator's stage to the laggard's stage. It focuses on adoption rates in different regions based on penetration. Furthermore, the report also includes key purchase criteria and drivers of price sensitivity to help companies evaluate and develop their market growth analysis strategies.
Customer Landscape
Key Companies & Market Insights
Companies are implementing various strategies, such as strategic alliances, partnerships, mergers and acquisitions, geographical expansion, and product/service launches, to enhance their presence in the market.
BayWa r.e. AG - The company offers agrivoltaic systems that maximize power while protecting crops from the effects of climate change.
The market research and growth report includes detailed analyses of the competitive landscape of the market and information about key companies, including:
- Enel SPA
- Insolight
- Jacks Solar Garden
- JinkoSolar Holding Co. Ltd.
- Mackin Energy Japan Co. Ltd.
- Mirai Solar
- Next2Sun
- Ombrea SAS
- REM TEC srl
- sandbox solar llc
- SunAgri
- Svea Solar
- Tse Energy Ltd
- ZIMMERMANN PV-Agri
Qualitative and quantitative analysis of companies has been conducted to help clients understand the wider business environment as well as the strengths and weaknesses of key market players. Data is qualitatively analyzed to categorize companies as pure play, category-focused, industry-focused, and diversified; it is quantitatively analyzed to categorize companies as dominant, leading, strong, tentative, and weak.
Research Analyst Overview
Solar energy is increasingly becoming an essential part of agricultural practices as the world transitions to renewable energy sources. Agrivoltaics, a concept that combines solar energy generation with agricultural productivity, is gaining popularity due to its potential to enhance land efficiency and provide dual-revenue streams. Utility-scale solar farms and ground-mounted PV plants are common configurations for agrivoltaics, with array configurations ranging from fixed to single-axis tracking. Monofacial and bifacial solar panels are used in agrivoltaics, with the latter offering the advantage of energy production from both sides. Translucent photovoltaic technology is another innovation that allows for light penetration, benefiting crops below.
Additionally, agrivoltaics can be applied to various agricultural landscapes, including grassland farming, horticulture, and indoor farming(indoor farming market). Agrivoltaics also offers environmental benefits, such as carbon sequestration, reduced greenhouse gas emissions, and environmental conservation. Droughts, a significant challenge for agriculture, can be mitigated through rainwater harvesting(precision agriculture market) and irrigation solutions. Agrivoltaics also provides crop protection, with soil sensors and data analytics used to optimize crop types and soil moisture levels. The market for agrivoltaics is growing as the world faces the challenges of food and power crises, soil degradation, and climate change. Renewable capacity expansion and agricultural output growth are driving the demand for energy-efficient and sustainable farming practices. Tracking equipment, soil sensors, and data analytics are essential components of dynamic agrivoltaics, which optimizes energy production and crop efficiency. Agrivoltaics is a promising solution for the future of agriculture and renewable energy.
|
Market Scope |
|
|
Report Coverage |
Details |
|
Page number |
196 |
|
Base year |
2023 |
|
Historic period |
2018-2022 |
|
Forecast period |
2024-2028 |
|
Growth momentum & CAGR |
Accelerate at a CAGR of 10.7% |
|
Market growth 2024-2028 |
USD 1.99 billion |
|
Market structure |
Concentrated |
|
YoY growth 2023-2024(%) |
8.3 |
|
Regional analysis |
North America, Europe, APAC, Middle East and Africa, and South America |
|
Performing market contribution |
North America at 36% |
|
Key countries |
US, Germany, China, France, and Japan |
|
Competitive landscape |
Leading Companies, Market Positioning of Companies, Competitive Strategies, and Industry Risks |
|
Key companies profiled |
BayWa r.e. AG, Enel SPA, Insolight, Jacks Solar Garden, JinkoSolar Holding Co. Ltd., Mackin Energy Japan Co. Ltd., Mirai Solar, Next2Sun, Ombrea SAS, REM TEC srl, sandbox solar llc, SunAgri, Svea Solar, Tse Energy Ltd, and ZIMMERMANN PV-Agri |
|
Market dynamics |
Parent market analysis, market growth inducers and obstacles, market forecast, fast-growing and slow-growing segment analysis, COVID-19 impact and recovery analysis and future consumer dynamics, market condition analysis for the forecast period |
|
Customization purview |
If our market report has not included the data that you are looking for, you can reach out to our analysts and get segments customized. |
What are the Key Data Covered in this Market Research and Growth Report?
- CAGR of the market during the forecast period
- Detailed information on factors that will drive the market growth and forecasting between 2024 and 2028
- Precise estimation of the size of the market and its contribution of the market in focus to the parent market
- Accurate predictions about upcoming market growth and trends and changes in consumer behaviour
- Growth of the market across North America, Europe, APAC, Middle East and Africa, and South America
- Thorough analysis of the market's competitive landscape and detailed information about companies
- Comprehensive analysis of factors that will challenge the growth of market companies
We can help! Our analysts can customize this market research report to meet your requirements. Get in touch


