Air Charter Services Market Analysis, Size, and Forecast 2026-2030: North America (US, Canada, and Mexico), Europe (Germany, UK, and France), APAC (China, Japan, and India), South America (Brazil and Argentina), Middle East and Africa (Saudi Arabia, UAE, and South Africa), and Rest of World (ROW)

Air Charter Services Market Analysis, Size, and Forecast 2026-2030:
North America (US, Canada, and Mexico), Europe (Germany, UK, and France), APAC (China, Japan, and India), South America (Brazil and Argentina), Middle East and Africa (Saudi Arabia, UAE, and South Africa), and Rest of World (ROW)

Published: Mar 2026 293 Pages SKU: IRTNTR40516

Market Overview at a Glance

$10.05 B
Market Opportunity
5.3%
CAGR 2025 - 2030
38.7%
North America Growth
$19.81 B
Charter passenger segment 2024

Air Charter Services Market Size 2026-2030

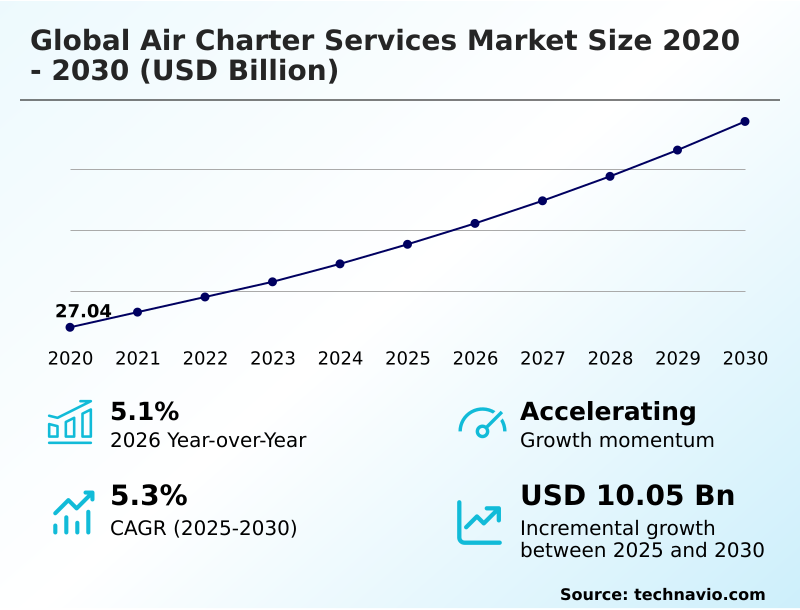
The air charter services market size is valued to increase by USD 10.05 billion, at a CAGR of 5.3% from 2025 to 2030. Expansion of medical and emergency air services will drive the air charter services market.

Major Market Trends & Insights

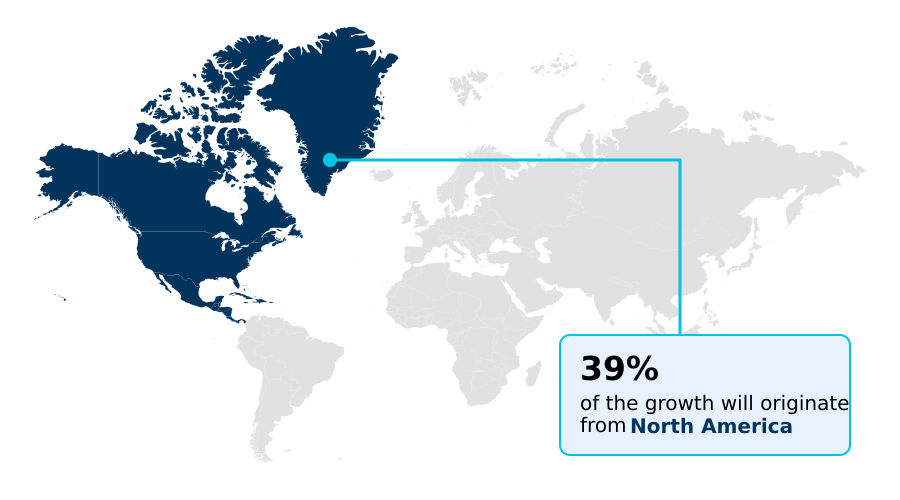
  • North America dominated the market and accounted for a 38.7% growth during the forecast period.
  • By Application - Charter passenger segment was valued at USD 19.81 billion in 2024
  • By Type - Business charter services segment accounted for the largest market revenue share in 2024

Market Size & Forecast

  • Market Opportunities: USD 16.84 billion
  • Market Future Opportunities: USD 10.05 billion
  • CAGR from 2025 to 2030 : 5.3%

Market Summary

  • The air charter services market continues its evolution from a niche luxury to a vital component of global business and logistics. This shift is powered by a growing corporate emphasis on executive productivity, supply chain resilience, and geopolitical risk mitigation.
  • Private aviation, including on-demand charter and jet card programs, allows enterprises to maintain operational continuity through direct access to secondary airports and flexible scheduling, a capability that commercial aviation cannot match.
  • For instance, a manufacturer can dispatch an engineering team and critical parts via a cargo charter to a remote facility, preventing costly production shutdowns and achieving a 95% reduction in potential downtime. Concurrently, the industry is navigating the dual pressures of fleet modernization to enhance efficiency and the integration of sustainable aviation fuel (SAF) to meet stringent environmental mandates.
  • Digital platforms featuring dynamic pricing models and real-time flight tracking are also democratizing access, expanding the user base beyond traditional high-net-worth individuals to mid-market companies seeking agile travel solutions. The rise of specialized missions, such as aeromedical evacuation and humanitarian aid logistics, further diversifies revenue streams and underscores the sector's critical role in the global mobility ecosystem.

What will be the Size of the Air Charter Services Market during the forecast period?

Get Key Insights on Market Forecast (PDF) Request Free Sample

How is the Air Charter Services Market Segmented?

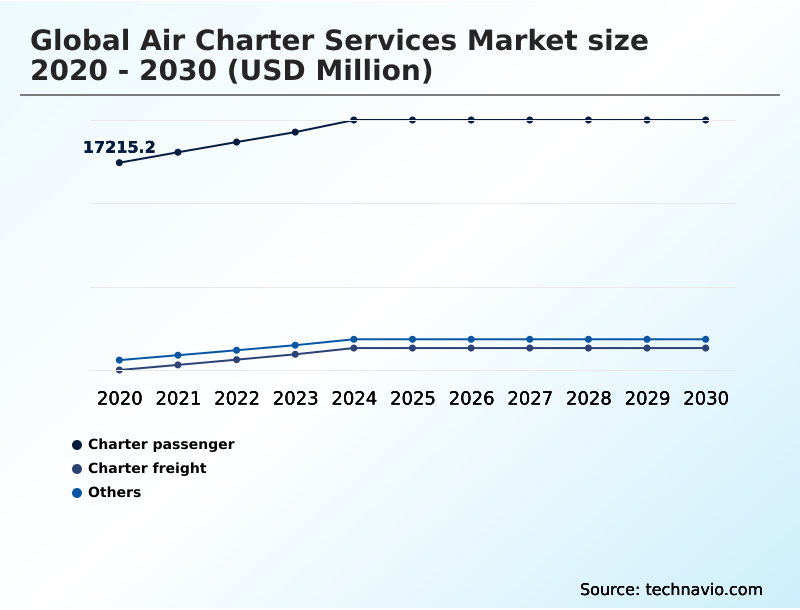
The air charter services industry research report provides comprehensive data (region-wise segment analysis), with forecasts and estimates in "USD million" for the period 2026-2030, as well as historical data from 2020-2024 for the following segments.

  • Application
    • Charter passenger
    • Charter freight
    • Others
  • Type
    • Business charter services
    • Private charter services
  • End-user
    • Individuals and corporates
    • Government and defense
    • Sports and entertainment
    • Healthcare sector
  • Geography
    • North America
      • US
      • Canada
      • Mexico
    • Europe
      • Germany
      • UK
      • France
    • APAC
      • China
      • Japan
      • India
    • South America
      • Brazil
      • Argentina
    • Middle East and Africa
      • Saudi Arabia
      • UAE
      • South Africa
    • Rest of World (ROW)

By Application Insights

The charter passenger segment is estimated to witness significant growth during the forecast period.

The charter passenger segment is a cornerstone of the air charter services market, driven by sustained demand from corporate entities and high-net-worth individuals for time-efficient, bespoke travel.

This segment, which includes everything from private jet charter to large group air charter, has evolved from a luxury into an essential executive productivity tool. It offers direct point-to-point mobility, bypassing congested commercial hubs and providing access to remote sites.

The market is increasingly characterized by advanced flight planning automation and sophisticated aircraft management services.

As a result, North America alone contributes nearly 39% of the market's incremental growth, reflecting the deep integration of on-demand aviation solutions like corporate shuttle services into regional business logistics and luxury travel solutions.

Request Free Sample

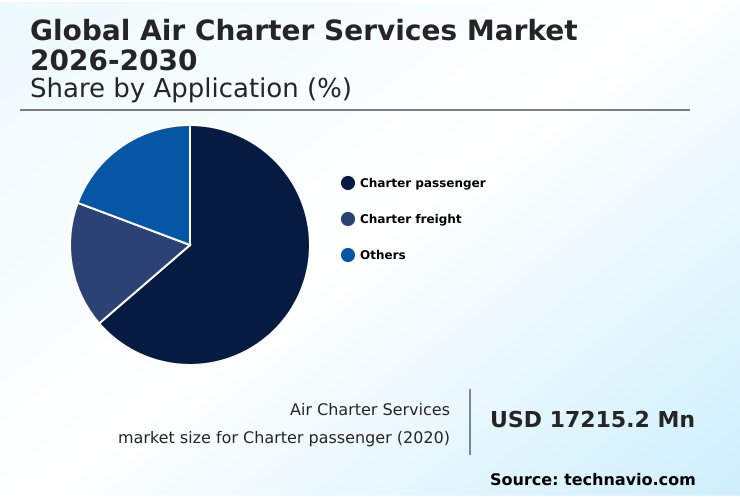
The Charter passenger segment was valued at USD 19.81 billion in 2024 and showed a gradual increase during the forecast period.

Request Free Sample

Regional Analysis

North America is estimated to contribute 38.7% to the growth of the global market during the forecast period.Technavio’s analysts have elaborately explained the regional trends and drivers that shape the market during the forecast period.

See How Air Charter Services Market Demand is Rising in North America Request Free Sample

The geographic landscape of the air charter services market is diversifying, with North America and Europe representing mature markets while APAC and the Middle East show rapid expansion.

North America contributes 38.7% of the market's incremental growth, driven by a dense network of FBO services and high demand for business aviation. Europe, contributing 28.17%, focuses on fleet modernization and sustainable aviation fuel (SAF) adoption.

In contrast, the APAC region is propelled by industrial needs, including offshore crew transport and access to remote project sites.

The Middle East is a hub for luxury travel solutions and secure diplomatic transport, defined by a preference for long-range jet capabilities.

This regional differentiation highlights the varied applications of private aviation, from supporting global flight operations to enabling vital humanitarian aid logistics worldwide.

Market Dynamics

Our researchers analyzed the data with 2025 as the base year, along with the key drivers, trends, and challenges. A holistic analysis of drivers will help companies refine their marketing strategies to gain a competitive advantage.

  • Strategic decision-making in corporate travel now frequently involves a detailed cost-benefit of private jet charter, weighing time savings and productivity against direct expenses. When booking private jet for business, firms are increasingly moving beyond ad-hoc arrangements toward programmatic approaches that integrate private aviation into their standard travel policies.
  • This is particularly evident when comparing a jet card vs fractional ownership, where companies evaluate capital outlay against guaranteed availability and predictable costs. The need for specialized services is also expanding the market's scope. For time-sensitive missions, emergency air ambulance services and using air charter for diplomacy have become standard procedures for healthcare organizations and governments.
  • In logistics, the demand for air cargo for oversized freight and secure cargo charter for valuables showcases the sector's critical role in maintaining resilient supply chains. Charter solutions for medical tourism and private flights for corporate events are also growing, supported by technologies for optimizing empty leg flight booking.
  • Operators focus on charter aircraft maintenance scheduling and sustainable aviation fuel sourcing to ensure reliability and meet ESG goals. This complex ecosystem, governed by regulations for international air charter, is navigated using tools for private jet charter price comparison.
  • Specialized use cases like group charter for sports teams, charters for remote mining operations, helicopter charter for urban mobility, and on-demand jet for last-minute travel further illustrate the industry's versatility, with long-range jet for global travel remaining a key offering for multinational corporations.
  • Firms leveraging these diverse services report that complex project timelines can be accelerated by more than 20% compared to reliance on commercial flight schedules.

What are the key market drivers leading to the rise in the adoption of Air Charter Services Industry?

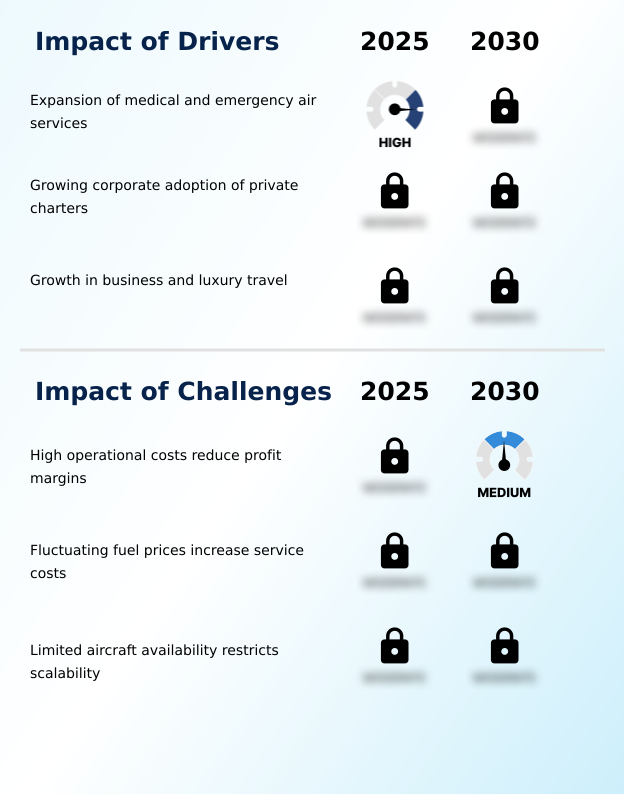
  • The expansion of medical and emergency air services is a key driver for the market, creating mission-critical demand for rapid and reliable aviation solutions.

  • The market's expansion is propelled by strong, diversified drivers. The expansion of medical and emergency air services, including aeromedical evacuation, creates a non-cyclical demand stream, with urgent transfers growing by 10% annually in some regions.
  • Concurrently, growing corporate adoption of private charters is driven by tangible productivity gains; businesses report a 15% increase in efficiency for executive teams utilizing charter for multi-site visits.
  • This growth in business and luxury travel is further supported by the need for remote site access and enhanced geopolitical risk mitigation.
  • Digital platforms are lowering barriers to entry, making it easier to book air taxi services and access empty leg flights. These factors are fueling investment in advanced air mobility (AAM) and eVTOL aircraft, promising to further transform point-to-point mobility.

What are the market trends shaping the Air Charter Services Industry?

  • A growing preference for customized charter flight services is an important trend. This is shaping the market as clients seek tailored itineraries and personalized in-flight experiences.

  • Key trends are reshaping the air charter services market, driven by a client-centric focus on customization and advanced mobility. The adoption of premium air mobility is accelerating, with a reported 25% increase in clients opting for membership-based models over single-trip bookings for enhanced predictability.
  • Growing preference for customized charter flight services, powered by dynamic pricing models, allows for bespoke travel planning and personalized in-flight services. This has led to a 40% rise in complex, multi-leg international itineraries arranged through charter operators.
  • Furthermore, the rising demand for urgent mission-based charters, including live organ transport and disaster response aviation, highlights the sector's critical role in time-sensitive logistics. Technological integration enables sophisticated aircraft utilization rates and enhances private aviation safety standards, reinforcing the value proposition for both corporate and leisure travelers.

What challenges does the Air Charter Services Industry face during its growth?

  • High operational costs represent a key challenge, compressing profit margins and impacting the financial performance of air charter operators.

  • The air charter services market confronts significant structural challenges that impact profitability and scalability. High operational costs, driven by aircraft maintenance and crew expenses, consistently squeeze margins. The industry's vulnerability to fluctuating fuel prices can increase trip costs by as much as 30% in a single quarter, complicating financial forecasting.
  • This is compounded by limited aircraft availability, which restricts operators' ability to meet surges in demand, particularly for specialized long-range jets. This scarcity can lead to a 10% loss of potential revenue during peak seasons.
  • Furthermore, the complex process of airborne infection control and charter fleet optimization requires continuous investment in technology and training, while a persistent pilot shortage curtails the expansion of global flight operations for many providers.

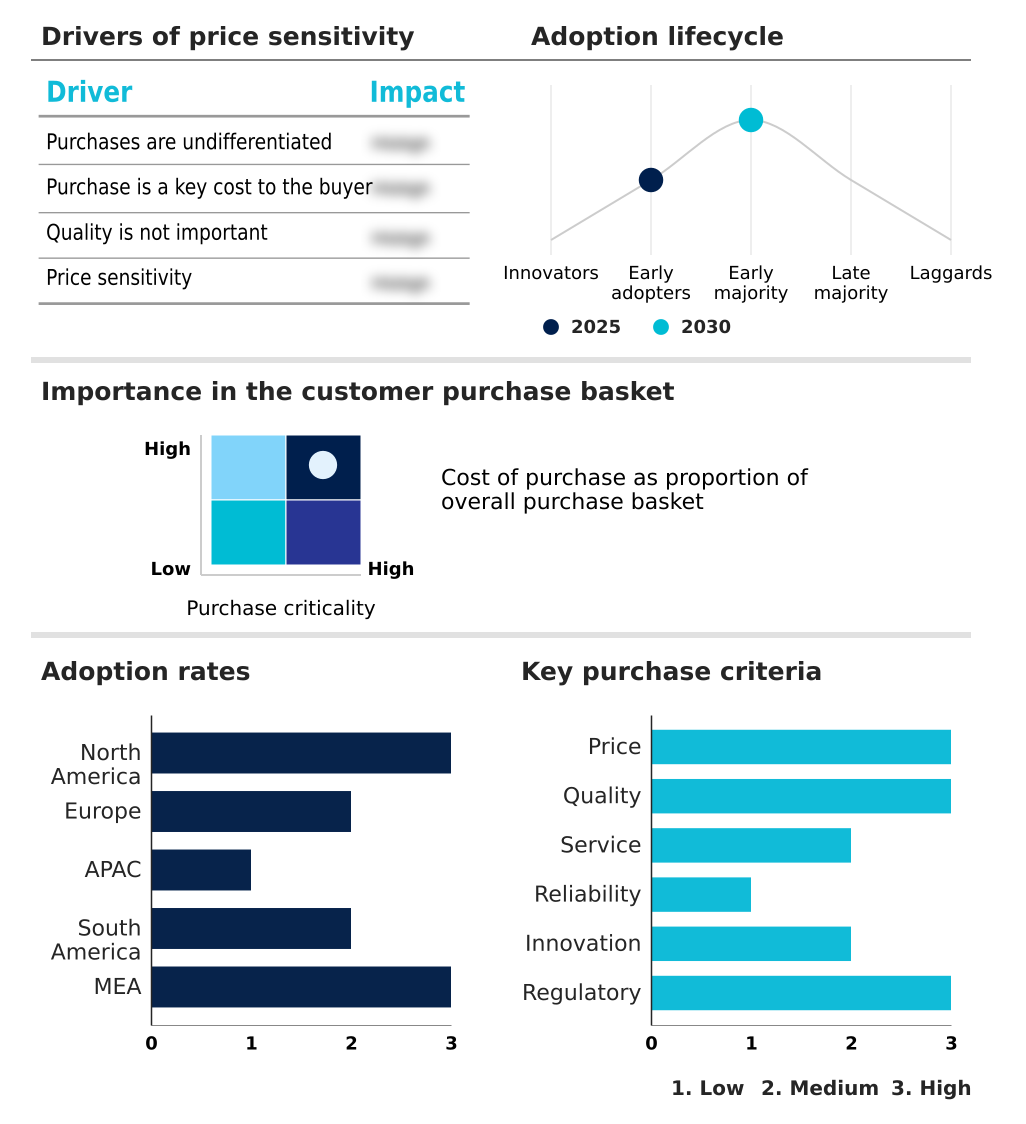
Exclusive Technavio Analysis on Customer Landscape

The air charter services market forecasting report includes the adoption lifecycle of the market, covering from the innovator’s stage to the laggard’s stage. It focuses on adoption rates in different regions based on penetration. Furthermore, the air charter services market report also includes key purchase criteria and drivers of price sensitivity to help companies evaluate and develop their market growth analysis strategies.

Customer Landscape of Air Charter Services Industry

Competitive Landscape

Companies are implementing various strategies, such as strategic alliances, air charter services market forecast, partnerships, mergers and acquisitions, geographical expansion, and product/service launches, to enhance their presence in the industry.

Air Charter Service Group Ltd. - Provides premium private jet charters and comprehensive aircraft management, operating a large-cabin fleet with distinguished safety standards and full FBO services.

The industry research and growth report includes detailed analyses of the competitive landscape of the market and information about key companies, including:

  • Air Charter Service Group Ltd.
  • Chapman Freeborn Airchartering
  • Clay Lacy Aviation
  • ExecuJet
  • Flexjet LLC
  • Fly Victor Ltd
  • Global Jet
  • GlobeAir AG
  • Jet Aviation AG
  • Jet Linx Aviation LLC
  • Jettly Inc.
  • LunaJets
  • Luxaviation S.A.
  • Magellan Jets
  • NetJets Aviation Inc.
  • Paramount Business Jets
  • Priester Aviation
  • Solairus Aviation
  • Stratos Jet Charters
  • VistaJet Group Holding Ltd.

Qualitative and quantitative analysis of companies has been conducted to help clients understand the wider business environment as well as the strengths and weaknesses of key industry players. Data is qualitatively analyzed to categorize companies as pure play, category-focused, industry-focused, and diversified; it is quantitatively analyzed to categorize companies as dominant, leading, strong, tentative, and weak.

Recent Development and News in Air charter services market

  • In July, 2025, Flexjet LLC secured a significant $800 million equity investment to accelerate its global infrastructure development and enhance its luxury service offerings.
  • In September, 2025, Air Charter Service Group Ltd. launched operations in Saudi Arabia by opening a new office in Riyadh, capitalizing on the deregulation of the private aviation sector.
  • In March, 2025, Altair International Corp. completed the acquisition of Premier Air Charter Inc. to expand its presence in the premium travel market.
  • In May, 2025, Momentum Solutions launched customized group air charter services specifically for the 2026 FIFA World Cup to manage complex travel logistics across North America.

Dive into Technavio’s robust research methodology, blending expert interviews, extensive data synthesis, and validated models for unparalleled Air Charter Services Market insights. See full methodology.

Market Scope
Page number 293
Base year 2025
Historic period 2020-2024
Forecast period 2026-2030
Growth momentum & CAGR Accelerate at a CAGR of 5.3%
Market growth 2026-2030 USD 10051.8 million
Market structure Fragmented
YoY growth 2025-2026(%) 5.1%
Key countries US, Canada, Mexico, Germany, UK, France, Italy, Spain, The Netherlands, China, Japan, India, South Korea, Australia, Indonesia, Brazil, Argentina, Chile, Saudi Arabia, UAE, South Africa, Israel and Turkey
Competitive landscape Leading Companies, Market Positioning of Companies, Competitive Strategies, and Industry Risks

Request Free Sample

Research Analyst Overview

  • The air charter services market is defined by a strategic push toward operational efficiency and technological integration. Key activities include advanced crew scheduling optimization, rigorous MRO services, and the adoption of predictive aircraft maintenance, which has been shown to reduce unscheduled aircraft downtime by up to 20%.
  • The industry is balancing the high demand for on-demand charter with the logistical complexities of global flight operations. Service models are diversifying beyond traditional private jet charter to include fractional ownership, block hour programs, and flexible jet card programs that cater to varied user needs.
  • Within this landscape, charter brokerage firms play a vital role in connecting clients with a global fleet that includes everything from turboprop aircraft and very light jet (VLJ) models to ultra-long-range jets.
  • A central boardroom consideration is the transition toward sustainability, with investments in fleet modernization and the adoption of sustainable aviation fuel (SAF) becoming critical for long-term brand reputation and regulatory compliance. This pivot requires significant capital but is essential for future viability.

What are the Key Data Covered in this Air Charter Services Market Research and Growth Report?

  • What is the expected growth of the Air Charter Services Market between 2026 and 2030?

    • USD 10.05 billion, at a CAGR of 5.3%

  • What segmentation does the market report cover?

    • The report is segmented by Application (Charter passenger, Charter freight, and Others), Type (Business charter services, and Private charter services), End-user (Individuals and corporates, Government and defense, Sports and entertainment, and Healthcare sector) and Geography (North America, Europe, APAC, South America, Middle East and Africa)

  • Which regions are analyzed in the report?

    • North America, Europe, APAC, South America and Middle East and Africa

  • What are the key growth drivers and market challenges?

    • Expansion of medical and emergency air services, High operational costs reduce profit margins

  • Who are the major players in the Air Charter Services Market?

    • Air Charter Service Group Ltd., Chapman Freeborn Airchartering, Clay Lacy Aviation, ExecuJet, Flexjet LLC, Fly Victor Ltd, Global Jet, GlobeAir AG, Jet Aviation AG, Jet Linx Aviation LLC, Jettly Inc., LunaJets, Luxaviation S.A., Magellan Jets, NetJets Aviation Inc., Paramount Business Jets, Priester Aviation, Solairus Aviation, Stratos Jet Charters and VistaJet Group Holding Ltd.

Market Research Insights

  • Market dynamics are increasingly shaped by the convergence of business and leisure travel, alongside the growth of specialized on-demand logistics. The adoption of programmatic charter strategies by corporations has improved executive travel efficiency by over 30% on multi-city itineraries. Simultaneously, the demand for personalized in-flight services and bespoke travel planning is expanding the premium leisure segment.
  • Technology platforms offering real-time flight tracking and transparent pricing have increased market accessibility, with some reporting a 50% rise in first-time users. These systems enable superior charter fleet optimization and support critical missions like time-critical cargo transport. The integration of advanced onboard connectivity solutions ensures that aircraft function as mobile offices, further enhancing productivity.
  • This diversification of use cases, from corporate shuttles to disaster response aviation, highlights the sector’s adaptability and broadens its value proposition.

We can help! Our analysts can customize this air charter services market research report to meet your requirements.

Get in touch

1. Executive Summary

1.1 Market overview

Executive Summary - Chart on Market Overview
Executive Summary - Data Table on Market Overview
Executive Summary - Chart on Global Market Characteristics
Executive Summary - Chart on Market by Geography
Executive Summary - Chart on Market Segmentation by Application
Executive Summary - Chart on Market Segmentation by Type
Executive Summary - Chart on Market Segmentation by End-user
Executive Summary - Chart on Incremental Growth
Executive Summary - Data Table on Incremental Growth
Executive Summary - Chart on Company Market Positioning

2. Technavio Analysis

2.1 Analysis of price sensitivity, lifecycle, customer purchase basket, adoption rates, and purchase criteria

2.2 Criticality of inputs and Factors of differentiation

Chart on Overview on criticality of inputs and factors of differentiation

2.3 Factors of disruption

Chart on Overview on factors of disruption

2.4 Impact of drivers and challenges

Chart on Impact of drivers and challenges in 2025 and 2030

3. Market Landscape

3.1 Market ecosystem

Chart on Parent Market
Data Table on - Parent Market

3.2 Market characteristics

Chart on Market characteristics analysis

3.3 Value chain analysis

Chart on Value chain analysis

4. Market Sizing

4.1 Market definition

Data Table on Offerings of companies included in the market definition

4.2 Market segment analysis

Market segments

4.3 Market size 2025

4.4 Market outlook: Forecast for 2025-2030

Chart on Global - Market size and forecast 2025-2030 ($ million)
Data Table on Global - Market size and forecast 2025-2030 ($ million)
Chart on Global Market: Year-over-year growth 2025-2030 (%)
Data Table on Global Market: Year-over-year growth 2025-2030 (%)

5. Historic Market Size

5.1 Global Air Charter Services Market 2020 - 2024

Historic Market Size - Data Table on Global Air Charter Services Market 2020 - 2024 ($ million)

5.2 Application segment analysis 2020 - 2024

Historic Market Size - Application Segment 2020 - 2024 ($ million)

5.3 Type segment analysis 2020 - 2024

Historic Market Size - Type Segment 2020 - 2024 ($ million)

5.4 End-user segment analysis 2020 - 2024

Historic Market Size - End-user Segment 2020 - 2024 ($ million)

5.5 Geography segment analysis 2020 - 2024

Historic Market Size - Geography Segment 2020 - 2024 ($ million)

5.6 Country segment analysis 2020 - 2024

Historic Market Size - Country Segment 2020 - 2024 ($ million)

6. Qualitative Analysis

6.1 Impact of AI on Global Air Charter Services Market

6.2 Impact of Geopolitical Conflicts on Global Air Charter Services Market

7. Five Forces Analysis

7.1 Five forces summary

Five forces analysis - Comparison between 2025 and 2030

7.2 Bargaining power of buyers

Bargaining power of buyers - Impact of key factors 2025 and 2030

7.3 Bargaining power of suppliers

Bargaining power of suppliers - Impact of key factors in 2025 and 2030

7.4 Threat of new entrants

Threat of new entrants - Impact of key factors in 2025 and 2030

7.5 Threat of substitutes

Threat of substitutes - Impact of key factors in 2025 and 2030

7.6 Threat of rivalry

Threat of rivalry - Impact of key factors in 2025 and 2030

7.7 Market condition

Chart on Market condition - Five forces 2025 and 2030

8. Market Segmentation by Application

8.1 Market segments

Chart on Application - Market share 2025-2030 (%)
Data Table on Application - Market share 2025-2030 (%)

8.2 Comparison by Application

Chart on Comparison by Application
Data Table on Comparison by Application

8.3 Charter passenger - Market size and forecast 2025-2030

Chart on Charter passenger - Market size and forecast 2025-2030 ($ million)
Data Table on Charter passenger - Market size and forecast 2025-2030 ($ million)
Chart on Charter passenger - Year-over-year growth 2025-2030 (%)
Data Table on Charter passenger - Year-over-year growth 2025-2030 (%)

8.4 Charter freight - Market size and forecast 2025-2030

Chart on Charter freight - Market size and forecast 2025-2030 ($ million)
Data Table on Charter freight - Market size and forecast 2025-2030 ($ million)
Chart on Charter freight - Year-over-year growth 2025-2030 (%)
Data Table on Charter freight - Year-over-year growth 2025-2030 (%)

8.5 Others - Market size and forecast 2025-2030

Chart on Others - Market size and forecast 2025-2030 ($ million)
Data Table on Others - Market size and forecast 2025-2030 ($ million)
Chart on Others - Year-over-year growth 2025-2030 (%)
Data Table on Others - Year-over-year growth 2025-2030 (%)

8.6 Market opportunity by Application

Market opportunity by Application ($ million)
Data Table on Market opportunity by Application ($ million)

9. Market Segmentation by Type

9.1 Market segments

Chart on Type - Market share 2025-2030 (%)
Data Table on Type - Market share 2025-2030 (%)

9.2 Comparison by Type

Chart on Comparison by Type
Data Table on Comparison by Type

9.3 Business charter services - Market size and forecast 2025-2030

Chart on Business charter services - Market size and forecast 2025-2030 ($ million)
Data Table on Business charter services - Market size and forecast 2025-2030 ($ million)
Chart on Business charter services - Year-over-year growth 2025-2030 (%)
Data Table on Business charter services - Year-over-year growth 2025-2030 (%)

9.4 Private charter services - Market size and forecast 2025-2030

Chart on Private charter services - Market size and forecast 2025-2030 ($ million)
Data Table on Private charter services - Market size and forecast 2025-2030 ($ million)
Chart on Private charter services - Year-over-year growth 2025-2030 (%)
Data Table on Private charter services - Year-over-year growth 2025-2030 (%)

9.5 Market opportunity by Type

Market opportunity by Type ($ million)
Data Table on Market opportunity by Type ($ million)

10. Market Segmentation by End-user

10.1 Market segments

Chart on End-user - Market share 2025-2030 (%)
Data Table on End-user - Market share 2025-2030 (%)

10.2 Comparison by End-user

Chart on Comparison by End-user
Data Table on Comparison by End-user

10.3 Individuals and corporates - Market size and forecast 2025-2030

Chart on Individuals and corporates - Market size and forecast 2025-2030 ($ million)
Data Table on Individuals and corporates - Market size and forecast 2025-2030 ($ million)
Chart on Individuals and corporates - Year-over-year growth 2025-2030 (%)
Data Table on Individuals and corporates - Year-over-year growth 2025-2030 (%)

10.4 Government and defense - Market size and forecast 2025-2030

Chart on Government and defense - Market size and forecast 2025-2030 ($ million)
Data Table on Government and defense - Market size and forecast 2025-2030 ($ million)
Chart on Government and defense - Year-over-year growth 2025-2030 (%)
Data Table on Government and defense - Year-over-year growth 2025-2030 (%)

10.5 Sports and entertainment - Market size and forecast 2025-2030

Chart on Sports and entertainment - Market size and forecast 2025-2030 ($ million)
Data Table on Sports and entertainment - Market size and forecast 2025-2030 ($ million)
Chart on Sports and entertainment - Year-over-year growth 2025-2030 (%)
Data Table on Sports and entertainment - Year-over-year growth 2025-2030 (%)

10.6 Healthcare sector - Market size and forecast 2025-2030

Chart on Healthcare sector - Market size and forecast 2025-2030 ($ million)
Data Table on Healthcare sector - Market size and forecast 2025-2030 ($ million)
Chart on Healthcare sector - Year-over-year growth 2025-2030 (%)
Data Table on Healthcare sector - Year-over-year growth 2025-2030 (%)

10.7 Market opportunity by End-user

Market opportunity by End-user ($ million)
Data Table on Market opportunity by End-user ($ million)

11. Customer Landscape

11.1 Customer landscape overview

Analysis of price sensitivity, lifecycle, customer purchase basket, adoption rates, and purchase criteria

12. Geographic Landscape

12.1 Geographic segmentation

Chart on Market share by geography 2025-2030 (%)
Data Table on Market share by geography 2025-2030 (%)

12.2 Geographic comparison

Chart on Geographic comparison
Data Table on Geographic comparison

12.3 North America - Market size and forecast 2025-2030

Chart on North America - Market size and forecast 2025-2030 ($ million)
Data Table on North America - Market size and forecast 2025-2030 ($ million)
Chart on North America - Year-over-year growth 2025-2030 (%)
Data Table on North America - Year-over-year growth 2025-2030 (%)
Chart on Regional Comparison - North America
Data Table on Regional Comparison - North America

12.3.1 US - Market size and forecast 2025-2030

Chart on US - Market size and forecast 2025-2030 ($ million)
Data Table on US - Market size and forecast 2025-2030 ($ million)
Chart on US - Year-over-year growth 2025-2030 (%)
Data Table on US - Year-over-year growth 2025-2030 (%)

12.3.2 Canada - Market size and forecast 2025-2030

Chart on Canada - Market size and forecast 2025-2030 ($ million)
Data Table on Canada - Market size and forecast 2025-2030 ($ million)
Chart on Canada - Year-over-year growth 2025-2030 (%)
Data Table on Canada - Year-over-year growth 2025-2030 (%)

12.3.3 Mexico - Market size and forecast 2025-2030

Chart on Mexico - Market size and forecast 2025-2030 ($ million)
Data Table on Mexico - Market size and forecast 2025-2030 ($ million)
Chart on Mexico - Year-over-year growth 2025-2030 (%)
Data Table on Mexico - Year-over-year growth 2025-2030 (%)

12.4 Europe - Market size and forecast 2025-2030

Chart on Europe - Market size and forecast 2025-2030 ($ million)
Data Table on Europe - Market size and forecast 2025-2030 ($ million)
Chart on Europe - Year-over-year growth 2025-2030 (%)
Data Table on Europe - Year-over-year growth 2025-2030 (%)
Chart on Regional Comparison - Europe
Data Table on Regional Comparison - Europe

12.4.1 Germany - Market size and forecast 2025-2030

Chart on Germany - Market size and forecast 2025-2030 ($ million)
Data Table on Germany - Market size and forecast 2025-2030 ($ million)
Chart on Germany - Year-over-year growth 2025-2030 (%)
Data Table on Germany - Year-over-year growth 2025-2030 (%)

12.4.2 UK - Market size and forecast 2025-2030

Chart on UK - Market size and forecast 2025-2030 ($ million)
Data Table on UK - Market size and forecast 2025-2030 ($ million)
Chart on UK - Year-over-year growth 2025-2030 (%)
Data Table on UK - Year-over-year growth 2025-2030 (%)

12.4.3 France - Market size and forecast 2025-2030

Chart on France - Market size and forecast 2025-2030 ($ million)
Data Table on France - Market size and forecast 2025-2030 ($ million)
Chart on France - Year-over-year growth 2025-2030 (%)
Data Table on France - Year-over-year growth 2025-2030 (%)

12.4.4 Italy - Market size and forecast 2025-2030

Chart on Italy - Market size and forecast 2025-2030 ($ million)
Data Table on Italy - Market size and forecast 2025-2030 ($ million)
Chart on Italy - Year-over-year growth 2025-2030 (%)
Data Table on Italy - Year-over-year growth 2025-2030 (%)

12.4.5 Spain - Market size and forecast 2025-2030

Chart on Spain - Market size and forecast 2025-2030 ($ million)
Data Table on Spain - Market size and forecast 2025-2030 ($ million)
Chart on Spain - Year-over-year growth 2025-2030 (%)
Data Table on Spain - Year-over-year growth 2025-2030 (%)

12.4.6 The Netherlands - Market size and forecast 2025-2030

Chart on The Netherlands - Market size and forecast 2025-2030 ($ million)
Data Table on The Netherlands - Market size and forecast 2025-2030 ($ million)
Chart on The Netherlands - Year-over-year growth 2025-2030 (%)
Data Table on The Netherlands - Year-over-year growth 2025-2030 (%)

12.5 APAC - Market size and forecast 2025-2030

Chart on APAC - Market size and forecast 2025-2030 ($ million)
Data Table on APAC - Market size and forecast 2025-2030 ($ million)
Chart on APAC - Year-over-year growth 2025-2030 (%)
Data Table on APAC - Year-over-year growth 2025-2030 (%)
Chart on Regional Comparison - APAC
Data Table on Regional Comparison - APAC

12.5.1 China - Market size and forecast 2025-2030

Chart on China - Market size and forecast 2025-2030 ($ million)
Data Table on China - Market size and forecast 2025-2030 ($ million)
Chart on China - Year-over-year growth 2025-2030 (%)
Data Table on China - Year-over-year growth 2025-2030 (%)

12.5.2 Japan - Market size and forecast 2025-2030

Chart on Japan - Market size and forecast 2025-2030 ($ million)
Data Table on Japan - Market size and forecast 2025-2030 ($ million)
Chart on Japan - Year-over-year growth 2025-2030 (%)
Data Table on Japan - Year-over-year growth 2025-2030 (%)

12.5.3 India - Market size and forecast 2025-2030

Chart on India - Market size and forecast 2025-2030 ($ million)
Data Table on India - Market size and forecast 2025-2030 ($ million)
Chart on India - Year-over-year growth 2025-2030 (%)
Data Table on India - Year-over-year growth 2025-2030 (%)

12.5.4 South Korea - Market size and forecast 2025-2030

Chart on South Korea - Market size and forecast 2025-2030 ($ million)
Data Table on South Korea - Market size and forecast 2025-2030 ($ million)
Chart on South Korea - Year-over-year growth 2025-2030 (%)
Data Table on South Korea - Year-over-year growth 2025-2030 (%)

12.5.5 Australia - Market size and forecast 2025-2030

Chart on Australia - Market size and forecast 2025-2030 ($ million)
Data Table on Australia - Market size and forecast 2025-2030 ($ million)
Chart on Australia - Year-over-year growth 2025-2030 (%)
Data Table on Australia - Year-over-year growth 2025-2030 (%)

12.5.6 Indonesia - Market size and forecast 2025-2030

Chart on Indonesia - Market size and forecast 2025-2030 ($ million)
Data Table on Indonesia - Market size and forecast 2025-2030 ($ million)
Chart on Indonesia - Year-over-year growth 2025-2030 (%)
Data Table on Indonesia - Year-over-year growth 2025-2030 (%)

12.6 South America - Market size and forecast 2025-2030

Chart on South America - Market size and forecast 2025-2030 ($ million)
Data Table on South America - Market size and forecast 2025-2030 ($ million)
Chart on South America - Year-over-year growth 2025-2030 (%)
Data Table on South America - Year-over-year growth 2025-2030 (%)
Chart on Regional Comparison - South America
Data Table on Regional Comparison - South America

12.6.1 Brazil - Market size and forecast 2025-2030

Chart on Brazil - Market size and forecast 2025-2030 ($ million)
Data Table on Brazil - Market size and forecast 2025-2030 ($ million)
Chart on Brazil - Year-over-year growth 2025-2030 (%)
Data Table on Brazil - Year-over-year growth 2025-2030 (%)

12.6.2 Argentina - Market size and forecast 2025-2030

Chart on Argentina - Market size and forecast 2025-2030 ($ million)
Data Table on Argentina - Market size and forecast 2025-2030 ($ million)
Chart on Argentina - Year-over-year growth 2025-2030 (%)
Data Table on Argentina - Year-over-year growth 2025-2030 (%)

12.6.3 Chile - Market size and forecast 2025-2030

Chart on Chile - Market size and forecast 2025-2030 ($ million)
Data Table on Chile - Market size and forecast 2025-2030 ($ million)
Chart on Chile - Year-over-year growth 2025-2030 (%)
Data Table on Chile - Year-over-year growth 2025-2030 (%)

12.7 Middle East and Africa - Market size and forecast 2025-2030

Chart on Middle East and Africa - Market size and forecast 2025-2030 ($ million)
Data Table on Middle East and Africa - Market size and forecast 2025-2030 ($ million)
Chart on Middle East and Africa - Year-over-year growth 2025-2030 (%)
Data Table on Middle East and Africa - Year-over-year growth 2025-2030 (%)
Chart on Regional Comparison - Middle East and Africa
Data Table on Regional Comparison - Middle East and Africa

12.7.1 Saudi Arabia - Market size and forecast 2025-2030

Chart on Saudi Arabia - Market size and forecast 2025-2030 ($ million)
Data Table on Saudi Arabia - Market size and forecast 2025-2030 ($ million)
Chart on Saudi Arabia - Year-over-year growth 2025-2030 (%)
Data Table on Saudi Arabia - Year-over-year growth 2025-2030 (%)

12.7.2 UAE - Market size and forecast 2025-2030

Chart on UAE - Market size and forecast 2025-2030 ($ million)
Data Table on UAE - Market size and forecast 2025-2030 ($ million)
Chart on UAE - Year-over-year growth 2025-2030 (%)
Data Table on UAE - Year-over-year growth 2025-2030 (%)

12.7.3 South Africa - Market size and forecast 2025-2030

Chart on South Africa - Market size and forecast 2025-2030 ($ million)
Data Table on South Africa - Market size and forecast 2025-2030 ($ million)
Chart on South Africa - Year-over-year growth 2025-2030 (%)
Data Table on South Africa - Year-over-year growth 2025-2030 (%)

12.7.4 Israel - Market size and forecast 2025-2030

Chart on Israel - Market size and forecast 2025-2030 ($ million)
Data Table on Israel - Market size and forecast 2025-2030 ($ million)
Chart on Israel - Year-over-year growth 2025-2030 (%)
Data Table on Israel - Year-over-year growth 2025-2030 (%)

12.7.5 Turkey - Market size and forecast 2025-2030

Chart on Turkey - Market size and forecast 2025-2030 ($ million)
Data Table on Turkey - Market size and forecast 2025-2030 ($ million)
Chart on Turkey - Year-over-year growth 2025-2030 (%)
Data Table on Turkey - Year-over-year growth 2025-2030 (%)

12.8 Market opportunity by geography

Market opportunity by geography ($ million)
Data Tables on Market opportunity by geography ($ million)

13. Drivers, Challenges, and Opportunity

13.1 Market drivers

Expansion of medical and emergency air services
Growing corporate adoption of private charters
Growth in business and luxury travel

13.2 Market challenges

High operational costs reduce profit margins
Fluctuating fuel prices increase service costs
Limited aircraft availability restricts scalability

13.3 Impact of drivers and challenges

Impact of drivers and challenges in 2025 and 2030

13.4 Market opportunities

Growing preference for customized charter flight services
Increasing adoption of premium air mobility solutions
Rising demand for urgent mission‑based charters

14. Competitive Landscape

14.1 Overview

14.2

Overview on criticality of inputs and factors of differentiation

14.3 Landscape disruption

Overview on factors of disruption

14.4 Industry risks

Impact of key risks on business

15. Competitive Analysis

15.1 Companies profiled

Companies covered

15.2 Company ranking index

15.3 Market positioning of companies

Matrix on companies position and classification

15.4 Clay Lacy Aviation

Clay Lacy Aviation - Overview
Clay Lacy Aviation - Product / Service
Clay Lacy Aviation - Key offerings
SWOT

15.5 ExecuJet

ExecuJet - Overview
ExecuJet - Product / Service
ExecuJet - Key offerings
SWOT

15.6 Flexjet LLC

Flexjet LLC - Overview
Flexjet LLC - Product / Service
Flexjet LLC - Key offerings
SWOT

15.7 Fly Victor Ltd

Fly Victor Ltd - Overview
Fly Victor Ltd - Product / Service
Fly Victor Ltd - Key offerings
SWOT

15.8 Global Jet

Global Jet - Overview
Global Jet - Product / Service
Global Jet - Key offerings
SWOT

15.9 GlobeAir AG

GlobeAir AG - Overview
GlobeAir AG - Product / Service
GlobeAir AG - Key offerings
SWOT

15.10 Jet Aviation AG

Jet Aviation AG - Overview
Jet Aviation AG - Product / Service
Jet Aviation AG - Key offerings
SWOT

15.11 Jet Linx Aviation LLC

Jet Linx Aviation LLC - Overview
Jet Linx Aviation LLC - Product / Service
Jet Linx Aviation LLC - Key offerings
SWOT

15.12 LunaJets

LunaJets - Overview
LunaJets - Product / Service
LunaJets - Key offerings
SWOT

15.13 Luxaviation S.A.

Luxaviation S.A. - Overview
Luxaviation S.A. - Product / Service
Luxaviation S.A. - Key offerings
SWOT

15.14 NetJets Aviation Inc.

NetJets Aviation Inc. - Overview
NetJets Aviation Inc. - Product / Service
NetJets Aviation Inc. - Key offerings
SWOT

15.15 Priester Aviation

Priester Aviation - Overview
Priester Aviation - Product / Service
Priester Aviation - Key offerings
SWOT

15.16 Solairus Aviation

Solairus Aviation - Overview
Solairus Aviation - Product / Service
Solairus Aviation - Key offerings
SWOT

15.17 Stratos Jet Charters

Stratos Jet Charters - Overview
Stratos Jet Charters - Product / Service
Stratos Jet Charters - Key offerings
SWOT

15.18 VistaJet Group Holding Ltd.

VistaJet Group Holding Ltd. - Overview
VistaJet Group Holding Ltd. - Product / Service
VistaJet Group Holding Ltd. - Key offerings
SWOT

16. Appendix

16.1 Scope of the report

Market definition
Objectives
Notes and caveats

16.2 Inclusions and exclusions checklist

Inclusions checklist
Exclusions checklist

16.3 Currency conversion rates for US$

16.4 Research methodology

16.5 Data procurement

Information sources

16.6 Data validation

16.7 Validation techniques employed for market sizing

16.8 Data synthesis

16.9 360 degree market analysis

16.10 List of abbreviations

Research Methodology

Technavio presents a detailed picture of the market by way of study, synthesis, and summation of data from multiple sources. The analysts have presented the various facets of the market with a particular focus on identifying the key industry influencers. The data thus presented is comprehensive, reliable, and the result of extensive research, both primary and secondary.

INFORMATION SOURCES

Primary sources

  • Manufacturers and suppliers
  • Channel partners
  • Industry experts
  • Strategic decision makers

Secondary sources

  • Industry journals and periodicals
  • Government data
  • Financial reports of key industry players
  • Historical data
  • Press releases

DATA ANALYSIS

Data Synthesis

  • Collation of data
  • Estimation of key figures
  • Analysis of derived insights

Data Validation

  • Triangulation with data models
  • Reference against proprietary databases
  • Corroboration with industry experts

REPORT WRITING

Qualitative

  • Market drivers
  • Market challenges
  • Market trends
  • Five forces analysis

Quantitative

  • Market size and forecast
  • Market segmentation
  • Geographical insights
  • Competitive landscape

Interested in this report?

Get your sample now to see our research methodology and insights!

Download Now

Frequently Asked Questions

Air Charter Services market growth will increase by USD 10051.8 million during 2026-2030.

The Air Charter Services market is expected to grow at a CAGR of 5.3% during 2026-2030.

Air Charter Services market is segmented by Application (Charter passenger, Charter freight, Others) Type (Business charter services, Private charter services) End-user (Individuals and corporates, Government and defense, Sports and entertainment, Healthcare sector)

Air Charter Service Group Ltd., Chapman Freeborn Airchartering, Clay Lacy Aviation, ExecuJet, Flexjet LLC, Fly Victor Ltd, Global Jet, GlobeAir AG, Jet Aviation AG, Jet Linx Aviation LLC, Jettly Inc., LunaJets, Luxaviation S.A., Magellan Jets, NetJets Aviation Inc., Paramount Business Jets, Priester Aviation, Solairus Aviation, Stratos Jet Charters, VistaJet Group Holding Ltd. are a few of the key vendors in the Air Charter Services market.

North America will register the highest growth rate of 38.7% among the other regions. Therefore, the Air Charter Services market in North America is expected to garner significant business opportunities for the vendors during the forecast period.

US, Canada, Mexico, Germany, UK, France, Italy, Spain, The Netherlands, China, Japan, India, South Korea, Australia, Indonesia, Brazil, Argentina, Chile, Saudi Arabia, UAE, South Africa, Israel, Turkey

  • Expansion of medical and emergency air services is the driving factor this market.

The Air Charter Services market vendors should focus on grabbing business opportunities from the Application segment as it accounted for the largest market share in the base year.