Air Defense Systems Market Size 2024-2028
The air defense systems market size is forecast to increase by USD 11.04 billion, at a CAGR of 5.9% between 2023 and 2028.
- The market is characterized by escalating threats from unmanned aerial vehicles (UAVs) and the continuous technological advancements in air defense system capabilities. The increasing use of UAVs by adversaries for reconnaissance and potential attacks poses a significant challenge for market players. In response, there is a growing demand for advanced air defense systems capable of detecting, tracking, and neutralizing UAV threats. Moreover, technological innovations in air defense systems are driving market growth. New technologies such as Artificial Intelligence (AI), Machine Learning (ML), and advanced radar systems are enhancing the capabilities of air defense systems, enabling them to respond more effectively to evolving threats.
- However, the complexities of the global supply chain pose a considerable challenge to market participants. The dependence on multiple suppliers for various components and the potential disruptions to supply chains due to geopolitical tensions can impact production schedules and increase costs. Companies must navigate these challenges by diversifying their supplier base and implementing robust contingency plans to mitigate risks and ensure the uninterrupted supply of critical components.
What will be the Size of the Air Defense Systems Market during the forecast period?
Explore in-depth regional segment analysis with market size data - historical 2018-2022 and forecasts 2024-2028 - in the full report.
Request Free Sample
The market continues to evolve, with dynamic market activities unfolding across various sectors. Radar systems play a crucial role in threat assessment and target acquisition, providing early warning of potential airborne threats. High explosive (HE) munitions integrated with air defense batteries ensure blast fragmentation and operational effectiveness against a range of targets, from cruise missiles to tank-killer missiles. Electronic countermeasures (ECM) and electronic warfare systems are essential components, providing protection against electromagnetic pulse (EMP) attacks and other electronic threats. Point defense systems, employing passive homing and active radar homing, offer effective protection against incoming missiles. GPS guidance and inertial navigation systems ensure precise targeting, while missile defense systems safeguard against ballistic and hypersonic missiles.
Battle management systems facilitate effective coordination and communication between various air defense components. Deployment strategies, including strategic and tactical, continue to evolve, with air defense networks integrating network warfare, cyber warfare, and missile guidance systems. Effectiveness metrics, such as contact fuzes and anti-armor warheads, are continually refined to optimize performance. Infrared sensors and anti-air artillery offer area defense capabilities, while early warning systems provide an air situation picture. Anti-aircraft missiles and counter-battery systems offer robust defense against aerial threats, ensuring the ongoing protection of critical assets.
How is this Air Defense Systems Industry segmented?
The air defense systems industry research report provides comprehensive data (region-wise segment analysis), with forecasts and estimates in "USD million" for the period 2024-2028, as well as historical data from 2018-2022 for the following segments.
- Type
- Land-based
- Sea-based
- Air-based
- Geography
- North America
- US
- Europe
- France
- Russia
- APAC
- China
- India
- Rest of World (ROW)
- North America
.
By Type Insights
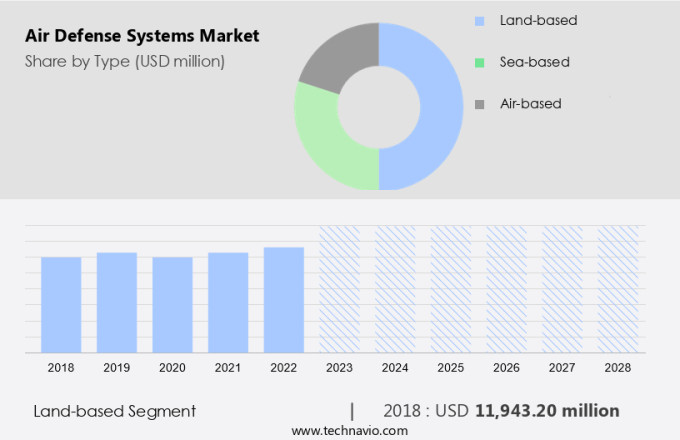
The land-based segment is estimated to witness significant growth during the forecast period.
The market encompasses various technologies and components, including radar systems, high explosive (HE) munitions, air defense batteries, tactical deployment, cruise missiles, anti-ship missiles, tank-killer missiles, electronic countermeasures (ECM), point defense systems, passive homing, missile defense systems, strategic deployment, electronic warfare, GPS guidance, electromagnetic pulse (EMP), deployment strategies, air situation picture, hypersonic missiles, ballistic missiles, electro-optical tracking, battle management, active radar homing, contact fuzes, anti-armor warheads, surface-to-air missiles, air defense networks, network warfare, guided missiles, cyber warfare, missile guidance systems, effectiveness metrics, semi-active radar homing, fragmentation warheads, anti-aircraft missiles, counter-battery systems, blast fragmentation, operational effectiveness, area defense systems, target acquisition, proximity fuzes, infrared sensors, anti-air artillery, early warning systems, air-to-air missiles, and inertial navigation systems.
Land-based air defense systems held the largest market share in 2023, primarily used for protecting army and air force bases and land-based assets from aerial threats such as missiles, UAVs, and drones. These systems consist of mobile devices in the air and composite installations on the ground. Ground-based installations are part of battle emergency management control systems (BEMCS), which detect intruders and threats remotely using IR signals from aircraft. Missile defense systems, such as those designed to counter cruise missiles, anti-ship missiles, and tank-killer missiles, are crucial components of the market. Electronic countermeasures (ECM) and electronic warfare systems are employed to disrupt enemy communications and radar systems, enhancing the overall operational effectiveness of air defense networks.
Strategic deployment of air defense systems involves the use of long-range, high-altitude systems for protecting critical infrastructure and key assets against ballistic missiles and hypersonic threats. These systems rely on advanced technologies like GPS guidance, passive homing, and active radar homing for target acquisition and engagement. The market also witnesses the increasing importance of cyber warfare and network warfare, with missile guidance systems and battle management systems becoming increasingly reliant on digital communication networks. Effectiveness metrics, such as operational effectiveness, area defense, and target acquisition, are essential factors driving the development of new air defense technologies. The integration of advanced technologies, such as EMP protection, infrared sensors, and proximity fuzes, further enhances the capabilities of air defense systems.
The Land-based segment was valued at USD 11.94 billion in 2018 and showed a gradual increase during the forecast period.
Regional Analysis
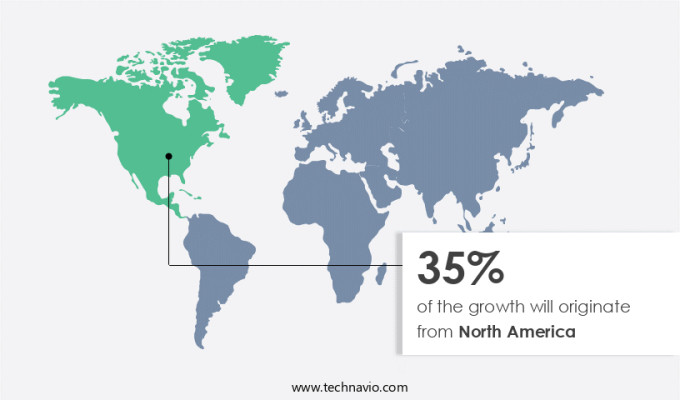
North America is estimated to contribute 35% to the growth of the global market during the forecast period. Technavio's analysts have elaborately explained the regional trends and drivers that shape the market during the forecast period.
The North American market, led by the US and Canada, holds a significant share in the global market in 2023. This dominance is driven by continuous modernization efforts and substantial defense budgets, with the US Department of Defense allocating USD1.8 billion for artificial intelligence and USD1.4 billion for Joint All-Domain Command and Control (JADC2) initiatives in the Fiscal Year 2024 budget. These investments underscore the region's commitment to advancing air defense capabilities. Strategic collaborations between defense contractors and military organizations, such as RTX Corporation's partnership with the US Air Force Research Laboratory to enhance the National Advanced Surface-to-Air Missile System (NASAMS), further bolster North America's position.
Radar systems, high explosive (HE), air defense batteries, tactical deployment, cruise missiles, anti-ship missiles, tank-killer missiles, electronic countermeasures (ECM), point defense systems, passive homing, missile defense systems, strategic deployment, electronic warfare, GPS guidance, electromagnetic pulse (EMP), and deployment strategies are integral components of these advanced air defense systems. Additionally, emerging technologies like hypersonic missiles, ballistic missiles, electro-optical tracking, battle management, active radar homing, contact fuzes, anti-armor warheads, surface-to-air missiles, air defense networks, network warfare, guided missiles, cyber warfare, missile guidance systems, effectiveness metrics, semi-active radar homing, fragmentation warheads, anti-aircraft missiles, counter-battery systems, blast fragmentation, operational effectiveness, area defense systems, target acquisition, proximity fuzes, infrared sensors, anti-air artillery, early warning systems, air-to-air missiles, and inertial navigation systems are shaping the market's dynamics.
The integration of these technologies is crucial for maintaining a robust defense against potential threats, ensuring operational effectiveness and area defense.
Market Dynamics
Our researchers analyzed the data with 2023 as the base year, along with the key drivers, trends, and challenges. A holistic analysis of drivers will help companies refine their marketing strategies to gain a competitive advantage.
What are the key market drivers leading to the rise in the adoption of Air Defense Systems Industry?
- The escalating danger posed by Unmanned Aerial Vehicles (UAVs) serves as the primary catalyst for market growth.
- The global air defense market is witnessing significant growth due to the increasing demand for advanced air defense systems to counteract various aerial threats. These systems include surface-to-air missiles (SAMs), anti-armor warheads, and anti-aircraft missiles, among others. The integration of network warfare and cyber warfare capabilities into air defense networks has further enhanced their effectiveness. Guided missiles with advanced missile guidance systems, such as semi-active radar homing, are increasingly being adopted for their precision and accuracy. The market is driven by various factors, including the need for advanced technology to counteract evolving threats, increasing defense budgets, and the growing focus on enhancing border security.
- Fragmentation warheads and other advanced warhead technologies are being used to increase the lethality of air defense systems. Moreover, counter-battery systems are gaining popularity due to their ability to neutralize enemy artillery. In conclusion, the air defense market is experiencing significant growth due to the increasing demand for advanced air defense systems to counteract various aerial threats. The integration of network warfare, cyber warfare, and advanced technologies, such as guided missiles and fragmentation warheads, is driving the market forward. The market is expected to continue growing due to the increasing focus on enhancing border security and the need for advanced technology to counteract evolving threats.
What are the market trends shaping the Air Defense Systems Industry?
- Air defense systems are experiencing significant technological advancements, which is currently a prominent trend in the market. Enhanced capabilities in this domain are driving innovation and growth.
- The market is experiencing notable expansion due to technological innovations. Advanced technologies such as artificial intelligence (AI) and machine learning (ML) are being integrated into modern air defense systems to enhance detection, tracking, and interception capabilities. AI and ML improve decision-making processes and automate threat assessment, ensuring faster and more accurate responses. Additionally, network-centric warfare capabilities are being adopted to improve coordination and communication between various defense units, thereby increasing operational effectiveness. Another significant trend is the development of hypersonic missiles and counter-hypersonic defense systems, as nations strive to strengthen their defenses against emerging threats.
- Infrared sensors, proximity fuzes, and early warning systems are also crucial components of air defense systems, providing target acquisition and enhancing overall system performance. Anti-air artillery and air-to-air missiles, guided by inertial navigation systems, play a vital role in neutralizing aerial threats. Overall, the integration of these advanced technologies is driving the growth of the market.
What challenges does the Air Defense Systems Industry face during its growth?
- Supply chain complexities pose a significant threat to industry growth, as businesses must navigate intricate networks to ensure the timely and efficient delivery of goods and services.
- Air defense systems play a crucial role in safeguarding nations against various aerial threats, including cruise missiles, anti-ship missiles, and tank-killer missiles. The manufacturing and deployment of these systems require a robust and secure defense logistics supply chain. However, the complexities and threats in this supply chain can result in visibility gaps. The sourcing and transportation of components for air defense systems pose significant challenges due to the need for high explosives (HE) and the integration of advanced technologies such as radar systems, electronic countermeasures (ECM), point defense systems, and passive homing. These complexities increase the risk of supply chain disruptions, which can impact the readiness of air defense batteries for tactical deployment.
- Moreover, the increasing number of terrorist activities and the unscheduled movement of defense forces during emergencies can further complicate the defense logistics supply chain. The integration of various technologies in air defense systems also necessitates a high level of coordination and collaboration among various stakeholders. To address these challenges, there is a growing emphasis on implementing advanced technologies such as missile defense systems and improving supply chain visibility through real-time tracking and monitoring systems. These measures can help ensure the timely and secure delivery of air defense systems and enhance their overall effectiveness in countering aerial threats.
Exclusive Customer Landscape
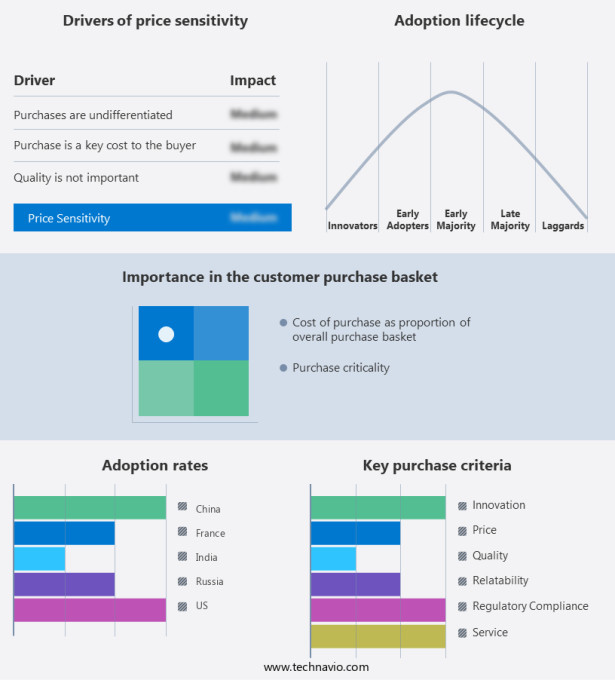
The air defense systems market forecasting report includes the adoption lifecycle of the market, covering from the innovator's stage to the laggard's stage. It focuses on adoption rates in different regions based on penetration. Furthermore, the air defense systems market report also includes key purchase criteria and drivers of price sensitivity to help companies evaluate and develop their market growth analysis strategies.
Customer Landscape
Key Companies & Market Insights
Companies are implementing various strategies, such as strategic alliances, air defense systems market forecast, partnerships, mergers and acquisitions, geographical expansion, and product/service launches, to enhance their presence in the industry.
Almaz Antey Air and Space Defense Corp. - The company specializes in providing advanced air defense solutions, encompassing systems such as Arrow 3, Arrow 2, and Barax MX.
The industry research and growth report includes detailed analyses of the competitive landscape of the market and information about key companies, including:
- Almaz Antey Air and Space Defense Corp.
- ASELSAN AS
- BAE Systems Plc
- Elbit Systems Ltd.
- General Atomics
- General Dynamics Corp.
- Israel Aerospace Industries Ltd.
- Kongsberg Gruppen ASA
- L3Harris Technologies Inc.
- Leonardo Spa
- Lockheed Martin Corp.
- Northrop Grumman Corp.
- Rafael Advanced Defense Systems Ltd.
- RTX Corp.
- Rheinmetall AG
- Saab AB
- Thales Group
- The Boeing Co.
Qualitative and quantitative analysis of companies has been conducted to help clients understand the wider business environment as well as the strengths and weaknesses of key industry players. Data is qualitatively analyzed to categorize companies as pure play, category-focused, industry-focused, and diversified; it is quantitatively analyzed to categorize companies as dominant, leading, strong, tentative, and weak.
Recent Development and News in Air Defense Systems Market
- In February 2023, Raytheon Technologies announced the successful integration of its Advanced Medium-Range Air-to-Air Missile (AMRAAM) with the Eurofighter Typhoon, following a strategic partnership between the companies in 2022 (Raytheon Technologies Press Release, 2023). This collaboration is expected to enhance the Eurofighter's air defense capabilities, broadening its market appeal.
- In March 2024, Lockheed Martin and Thales signed a memorandum of understanding to jointly develop and produce the next-generation air defense system, the Future Air Defense System (FAS), integrating Lockheed Martin's Multi-Role Radar Technology Insertion Program (MRTIP) with Thales's ground segment and interceptors (Lockheed Martin Press Release, 2024). This collaboration is expected to result in a more advanced and cost-effective air defense solution for global customers.
- In May 2024, the U.S. Department of Defense awarded Raytheon Technologies a USD1.1 billion contract to produce and deliver 22 Patriot Advanced Capability-3 (PAC-3) Missile Segment Enhancement (MSE) interceptors, further solidifying the Patriot system's position as a leading air defense solution (U.S. Department of Defense Press Release, 2024).
Research Analyst Overview
- The market is witnessing significant advancements, driven by the integration of innovative technologies and evolving air defense doctrines. Missile propulsion systems, whether fueled by liquid-fuel or solid-fuel rockets, continue to play a pivotal role in air defense upgrades. Network security and data security are paramount concerns as air defense systems become increasingly reliant on digital networks. Air defense interoperability and integration with autonomous systems are key trends, with cloud-based air defense solutions gaining traction. Sensor fusion and data fusion technologies enable enhanced situational awareness, while directed energy weapons and laser weapons offer non-kinetic countermeasures. Counter-space weapons, high-power microwaves, and counter-UAV systems are crucial components of layered defense strategies.
- Machine learning and artificial intelligence are transforming air defense modernization, allowing for more effective threat detection and response. The market is also witnessing the development of space-based air defense systems, adding an additional dimension to defense capabilities. The integration of passive and active defense systems ensures comprehensive protection against various air threats. Sensor fusion and data security are essential elements of effective air defense, as the market shifts towards more complex and interconnected systems. Air defense doctrine continues to evolve, with a focus on advanced technologies and multi-domain defense strategies.
Dive into Technavio's robust research methodology, blending expert interviews, extensive data synthesis, and validated models for unparalleled Air Defense Systems Market insights. See full methodology.
|
Market Scope |
|
|
Report Coverage |
Details |
|
Page number |
169 |
|
Base year |
2023 |
|
Historic period |
2018-2022 |
|
Forecast period |
2024-2028 |
|
Growth momentum & CAGR |
Accelerate at a CAGR of 5.9% |
|
Market growth 2024-2028 |
USD 11042.9 million |
|
Market structure |
Fragmented |
|
YoY growth 2023-2024(%) |
5.5 |
|
Key countries |
US, China, Russia, France, and India |
|
Competitive landscape |
Leading Companies, Market Positioning of Companies, Competitive Strategies, and Industry Risks |
What are the Key Data Covered in this Air Defense Systems Market Research and Growth Report?
- CAGR of the Air Defense Systems industry during the forecast period
- Detailed information on factors that will drive the growth and forecasting between 2024 and 2028
- Precise estimation of the size of the market and its contribution of the industry in focus to the parent market
- Accurate predictions about upcoming growth and trends and changes in consumer behaviour
- Growth of the market across North America, APAC, Europe, South America, and Middle East and Africa
- Thorough analysis of the market's competitive landscape and detailed information about companies
- Comprehensive analysis of factors that will challenge the air defense systems market growth of industry companies
We can help! Our analysts can customize this air defense systems market research report to meet your requirements.


