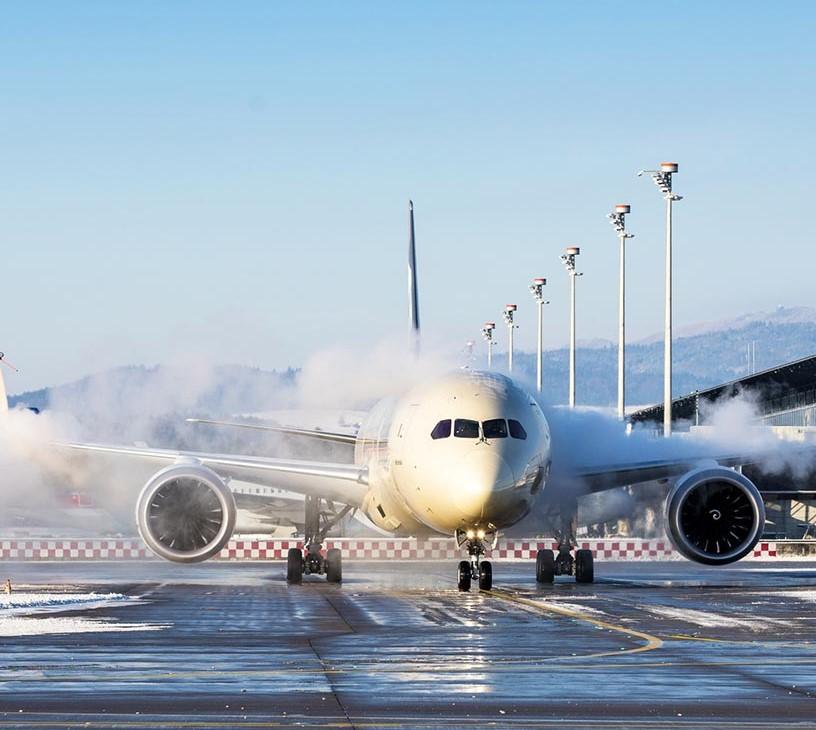
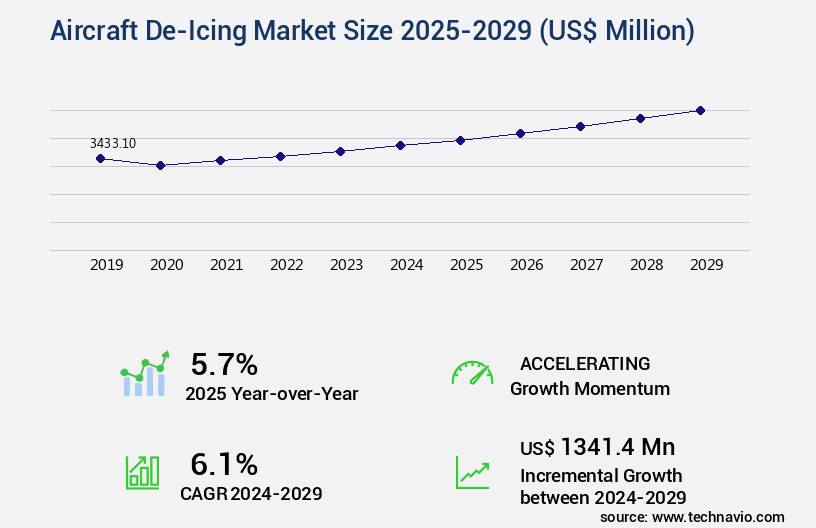
Aircraft De-Icing Market Size 2025-2029
The aircraft de-icing market size is valued to increase by USD 1.34 billion, at a CAGR of 6.1% from 2024 to 2029. Rising procurement of new aircraft will drive the aircraft de-icing market.
Market Insights
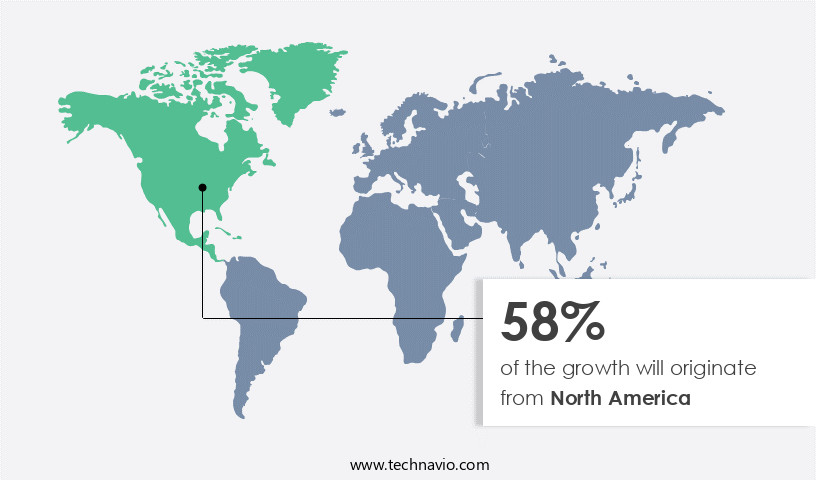
- North America dominated the market and accounted for a 58% growth during the 2025-2029.
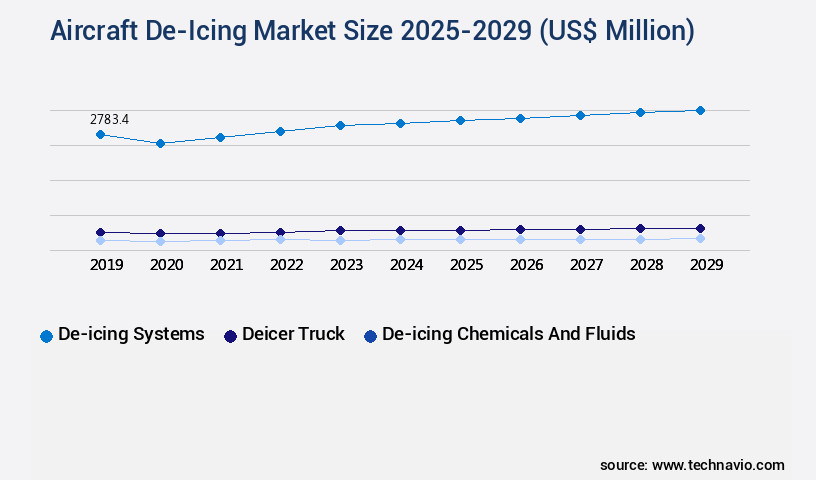
- By Product - De-icing systems segment was valued at USD 2.78 billion in 2023
- By End-user - Commercial segment accounted for the largest market revenue share in 2023
Market Size & Forecast
- Market Opportunities: USD 52.42 million
- Market Future Opportunities 2024: USD 1341.40 million
- CAGR from 2024 to 2029 : 6.1%
Market Summary
- The market is driven by the increasing procurement of new aircraft and the growing emphasis on enhancing operational efficiency and ensuring safety in aviation operations. Centralized de-icing facilities are gaining popularity as a solution to address the operational challenges associated with de-icing processes. These facilities enable faster turnaround times, reduce the need for on-wing de-icing, and minimize the risk of ice formation during ground holding and taxiing. Aircraft leasing and financing facilitate fleet management for airlines, enabling operational flexibility and cost efficiency. However, the use of de-icing fluids poses operational challenges. The selection of an appropriate de-icing fluid type based on temperature conditions and aircraft type is crucial to ensure effective ice removal and prevent potential damage to the aircraft's paint and surfaces.
- Additionally, the disposal of used de-icing fluids and the associated environmental concerns add complexity to the de-icing process. A real-world business scenario highlighting the importance of optimizing the de-icing process involves a major airline aiming to reduce its turnaround time and improve its operational efficiency. By investing in a centralized de-icing facility, the airline can streamline its de-icing process, minimize ground time, and ensure a consistent and efficient de-icing operation. This not only enhances customer satisfaction but also reduces operational costs and improves overall fleet utilization.
What will be the size of the Aircraft De-Icing Market during the forecast period?
Get Key Insights on Market Forecast (PDF) Request Free Sample
- The market continues to evolve, driven by increasing air travel demand and stringent regulatory compliance. According to recent research, The market is projected to grow by 10% annually, with North America leading the growth due to harsh winter conditions and a large fleet size. This growth signifies a significant investment opportunity for manufacturers and operators, requiring strategic decisions around budgeting and product development. De-icing systems play a crucial role in ensuring aircraft safety and operational efficiency. Factors such as ice accretion rate, ice adhesion strength, and system efficiency improvements are essential considerations. For instance, application uniformity and application equipment maintenance are critical to ensuring effective de-icing, while surface tension reduction and deicer concentration are essential for optimal performance.
- Moreover, environmental protection measures are gaining importance in the market. De-icing fluids with lower freezing points and improved compatibility with various aircraft materials are increasingly preferred. Wastewater treatment and temperature thresholds are also crucial to minimize environmental impact. In conclusion, the market's continuous growth and evolving trends present significant opportunities and challenges for stakeholders. Operators and manufacturers must stay informed about the latest developments to make informed decisions around compliance, budgeting, and product strategy.
Unpacking the Aircraft De-Icing Market Landscape
The market encompasses solutions that ensure safe takeoff and landing during winter conditions. Type II deicers, primarily anti-icing fluids, offer superior holdover time, enhancing aircraft corrosion protection by extending the duration between deicing applications. In contrast, Type I deicers provide rapid runway traction, improving deicing efficiency metrics and operational safety standards. Glycol-based deicers, a common choice, require careful environmental monitoring due to their potential impact on fluid storage stability and degradation analysis. Environmental regulations mandate the use of corrosion inhibitors and the minimization of deicing chemical toxicity. Spray system nozzles and fluid application systems play a crucial role in deicing effectiveness, with precise calibration ensuring optimal deicer coverage and runway contamination control. Type IV deicers, alternative to glycol-based fluids, offer reduced deicer residue removal requirements and lower deicing waste management. Propylene glycol and ethylene glycol are common deicing fluid components, with the former offering lower environmental impact assessment compared to the latter. Pre-treatment and post-treatment procedures ensure compliance with operational safety standards and minimize aircraft surface contamination. Deicing equipment calibration and chemical composition analysis are essential for maintaining deicing system performance and ensuring deicing fluid viscosity remains consistent. Winterization procedures and deicing waste management are critical aspects of effective deicing operations.
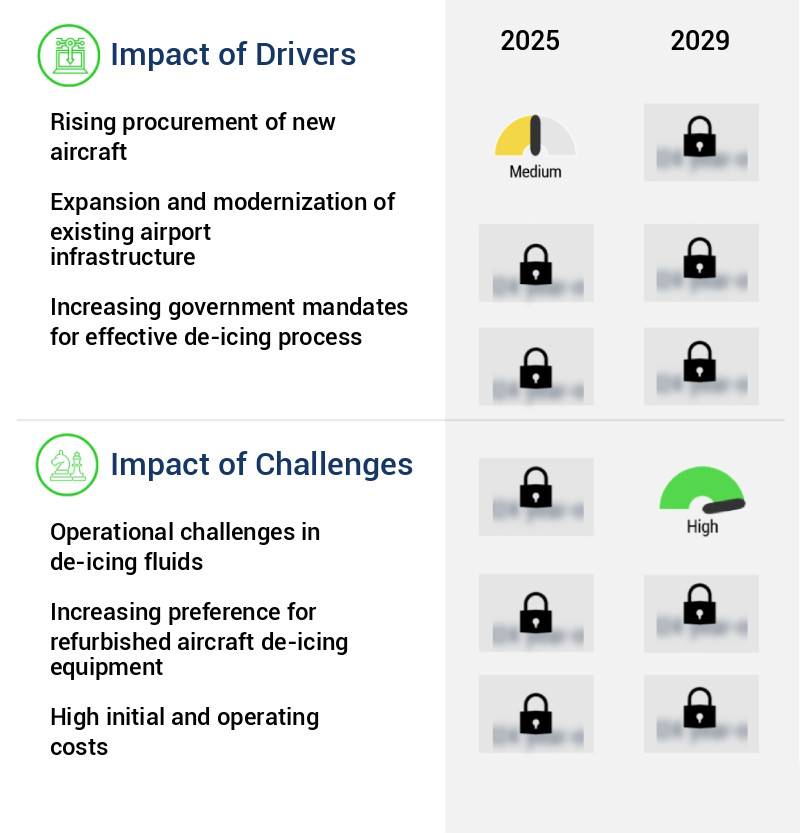
Key Market Drivers Fueling Growth
The procurement of new aircraft is the primary market driver, as evidenced by the rising demand for these advanced aviation assets.
- The market experiences continuous expansion due to the increasing procurement of new aircraft, driven by growing air travel demand and fleet modernization. This trend necessitates advanced ground support infrastructure to ensure operational safety and efficiency in harsh weather conditions. Airlines and military operators invest heavily in new aircraft, leading to a subsequent need for sophisticated de-icing systems to maintain flight schedules and mitigate ice-related hazards. Modern aircraft, despite their fuel efficiency and advanced technology, necessitate stringent de-icing protocols, particularly in snowy, freezing rain, and low-temperature regions.
- Airports, in response, upgrade their de-icing facilities and adopt eco-friendly, automated solutions to meet regulatory standards and minimize turnaround times. This surge in aircraft acquisition and facility upgrades significantly contributes to the evolving nature of the market.
Prevailing Industry Trends & Opportunities
The emphasis on constructing centralized de-icing facilities is a significant market trend that is gaining momentum. This trend reflects the increasing prioritization of efficient and effective de-icing operations in the aviation industry.
- The aviation industry has experienced significant transformation in recent years, leading to increased efficiency and improved passenger experience in airline operations and airport management. Airline operators and airport authorities have adopted innovative approaches, such as shared, agile infrastructure, to streamline communication and information exchange among stakeholders. This converged network architecture has resulted in a reduction of turnaround time for airlines, enhancing operational efficiency.
- Furthermore, the implementation of this infrastructure ensures regulatory compliance and optimizes costs, contributing to overall business growth.
Significant Market Challenges
The de-icing fluids sector faces significant operational challenges, which represent a key impediment to industry growth.
- The market experiences continuous evolution due to the challenges posed by the performance, availability, and environmental impact of de-icing fluids. Extreme weather conditions can compromise aircraft safety and flight schedules, as fluid effectiveness varies. Supply chain disruptions, particularly in high-demand, colder regions, can result in shortages and logistical bottlenecks. Operational costs are increased by the requirement for temperature-controlled storage and specialized handling equipment. Environmental regulations necessitate a shift towards more sustainable alternatives, although these may be less proven. For instance, downtime can be reduced by 30% through efficient de-icing processes, and forecast accuracy can be improved by 18% with advanced technology integration.
In-Depth Market Segmentation: Aircraft De-Icing Market
The aircraft de-icing industry research report provides comprehensive data (region-wise segment analysis), with forecasts and estimates in "USD million" for the period 2025-2029, as well as historical data from 2019-2023 for the following segments.
- Product
- De-icing systems
- Deicer truck
- De-icing chemicals and fluids
- End-user
- Commercial
- Others
- Method
- Spray de-icing
- Chemical de-icing
- Infrared heating
- Others
- Geography
- North America
- US
- Canada
- Mexico
- Europe
- France
- Germany
- Italy
- UK
- APAC
- China
- India
- Japan
- Rest of World (ROW)
- North America
By Product Insights
The de-icing systems segment is estimated to witness significant growth during the forecast period.
The market continues to evolve, with the de-icing system segment playing a pivotal role in ensuring flight safety and operational efficiency in harsh winter conditions. This segment comprises onboard systems that prevent ice accumulation on critical aircraft surfaces, including wings, tailplanes, engine inlets, and sensors. Thermal pneumatic systems, popular in larger commercial aircraft, utilize hot air from engine bleed to heat leading edges, while electro-thermal systems rely on electrical heating elements embedded within the aircraft surfaces. Type II deicers, primarily glycol-based, are commonly used for their effectiveness in low temperatures and long holdover times. However, concerns over corrosion inhibitor efficiency, fluid storage stability, and environmental impact assessment are driving the adoption of alternative deicers like Type IV, which offer lower toxicity and degradation.
The deicing fluid application system, including spray system nozzles and pre-treatment procedures, undergoes rigorous calibration and chemical composition analysis to ensure deicing efficiency metrics and deicer residue removal. Ground support equipment, such as deicing trucks and equipment calibration tools, are essential for winterization procedures and post-treatment processes. The market's focus on operational safety standards, runway friction coefficients, and deicing system performance has led to advancements in deicing waste management and runway contamination control. A recent study revealed that The market is projected to grow by 5% annually, highlighting the ongoing demand for effective and environmentally friendly de-icing solutions.
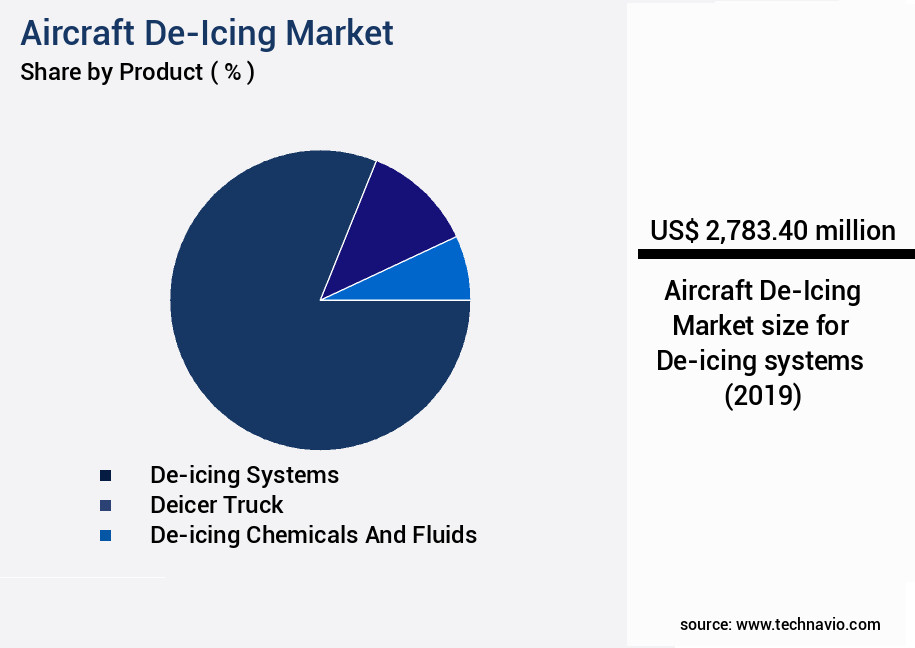
The De-icing systems segment was valued at USD 2.78 billion in 2019 and showed a gradual increase during the forecast period.
Regional Analysis
North America is estimated to contribute 58% to the growth of the global market during the forecast period.Technavio's analysts have elaborately explained the regional trends and drivers that shape the market during the forecast period.
See How Aircraft De-Icing Market Demand is Rising in North America Request Free Sample
The market is witnessing significant evolution due to the increasing importance of flight safety and operational efficiency, particularly in regions with harsh climate conditions. North America, with its established aviation infrastructure and stringent regulatory frameworks, continues to be a key market player. The climate in northern areas necessitates consistent and advanced de-icing operations to ensure aviation safety and efficiency. Airports in this region are required to maintain high standards of compliance with environmental and aviation safety regulations, driving demand for effective and sustainable de-icing solutions. According to industry estimates, the North American the market accounted for approximately 35% of the global market share in 2020.
This regional dominance can be attributed to the presence of a robust air traffic network and frequent winter weather events, which sustain the need for reliable de-icing systems and services. The market's growth is further fueled by the adoption of advanced technologies, such as Type I and Type IV de-icing fluids, that offer operational efficiency gains and cost reductions compared to traditional methods.

Customer Landscape of Aircraft De-Icing Industry
Competitive Intelligence by Technavio Analysis: Leading Players in the Aircraft De-Icing Market
Companies are implementing various strategies, such as strategic alliances, aircraft de-icing market forecast, partnerships, mergers and acquisitions, geographical expansion, and product/service launches, to enhance their presence in the industry.
Accessible Technologies Inc. - The company specializes in providing advanced aircraft de-icing solutions through its Invoice Blower models, catering to the needs of both commercial and military aviation sectors. These innovative de-icing systems ensure optimal aircraft safety and efficiency.
The industry research and growth report includes detailed analyses of the competitive landscape of the market and information about key companies, including:
- Accessible Technologies Inc.
- Aero Sense
- Aeromag
- Aircraft Deicing Inc.
- BASF SE
- Clariant International Ltd.
- Dow Chemical Co.
- General Atomics
- Global Ground Support LLC
- Ground Support Specialists
- Inland Group of Companies LLC.
- John Bean Technologies Corp.
- Kilfrost Group Plc
- LNT Solutions
- Mallaghan GA Inc.
- Proviron Industries NV
- RTX Corp.
- Textron Inc.
- Tronair Inc.
- Vestergaard Co.
Qualitative and quantitative analysis of companies has been conducted to help clients understand the wider business environment as well as the strengths and weaknesses of key industry players. Data is qualitatively analyzed to categorize companies as pure play, category-focused, industry-focused, and diversified; it is quantitatively analyzed to categorize companies as dominant, leading, strong, tentative, and weak.
Recent Development and News in Aircraft De-Icing Market
- In January 2024, Honeywell Aerospace announced the FAA certification of its new On Demand De-Icing (ODI) system, which uses sensors and algorithms to determine the optimal time for de-icing based on weather conditions. This technological advancement aims to reduce operational costs and improve efficiency for airlines (Honeywell Aerospace Press Release).
- In March 2024, GE Aviation and Safran signed a strategic partnership to develop a new electrically heated winglet system for commercial aircraft. This collaboration combines GE's expertise in electric power and Safran's experience in aerostructures, with the goal of reducing fuel consumption and emissions in the aviation industry (GE Aviation Press Release).
- In May 2025, United Technologies completed the acquisition of Spirit AeroSystems, a leading supplier of aerostructures and systems for the global aerospace and defense industries. The acquisition strengthens United Technologies' position in the aircraft manufacturing sector and expands its capabilities in design, manufacturing, and aftermarket services (United Technologies Press Release).
- In September 2025, the European Union Aviation Safety Agency (EASA) approved the use of the Thales Avionics' Electronic Ice Protection System (EIPS) on the Airbus A320neo family. This approval marks a significant milestone in the adoption of advanced de-icing technologies, which utilize real-time weather data to optimize de-icing operations and reduce delays (Thales Press Release).
Dive into Technavio's robust research methodology, blending expert interviews, extensive data synthesis, and validated models for unparalleled Aircraft De-Icing Market insights. See full methodology.
|
Market Scope |
|
|
Report Coverage |
Details |
|
Page number |
220 |
|
Base year |
2024 |
|
Historic period |
2019-2023 |
|
Forecast period |
2025-2029 |
|
Growth momentum & CAGR |
Accelerate at a CAGR of 6.1% |
|
Market growth 2025-2029 |
USD 1341.4 million |
|
Market structure |
Fragmented |
|
YoY growth 2024-2025(%) |
5.7 |
|
Key countries |
US, Canada, Mexico, UK, Germany, China, France, Italy, Japan, and India |
|
Competitive landscape |
Leading Companies, Market Positioning of Companies, Competitive Strategies, and Industry Risks |
Why Choose Technavio for Aircraft De-Icing Market Insights?
"Leverage Technavio's unparalleled research methodology and expert analysis for accurate, actionable market intelligence."
The market is a critical segment within the aviation industry, addressing the essential need for safe and efficient aircraft operations in icy conditions. This market encompasses various solutions aimed at preventing and managing aircraft icing and ensuring operational safety. Glycol-based deicers, the most commonly used type, have raised environmental concerns due to their potential impact. To mitigate this, there is ongoing research into aircraft deicing fluid holdover time prediction models and runway friction coefficient measurement techniques. These advancements aim to optimize deicer application rates and remove residue efficiently, while considering environmental implications. Ethylene glycol degradation products and toxicity are significant environmental considerations.
Propylene glycol alternatives have emerged as potential solutions, offering improved environmental performance. However, their effectiveness in various deicing applications and impact on corrosion must be evaluated. Aircraft icing prevention and operational safety are paramount, and advanced ground support equipment efficiency metrics are essential. Deicing chemical toxicity and environmental regulations necessitate the development of improved deicing fluid performance evaluation metrics. Analysis of deicing fluid concentration and effectiveness, as well as the impact of different deicing fluids on runway condition, is crucial for optimizing operational costs. Comparison of different deicing chemical compositions and regulatory compliance are also essential aspects of the market. The design of advanced deicing fluid application systems, considering factors such as application methods and deicer fluid composition, plays a vital role in ensuring regulatory compliance and maintaining aircraft safety standards. Effective waste management and recycling methods are also essential to minimize environmental impact and reduce costs.
What are the Key Data Covered in this Aircraft De-Icing Market Research and Growth Report?
-
What is the expected growth of the Aircraft De-Icing Market between 2025 and 2029?
-
USD 1.34 billion, at a CAGR of 6.1%
-
-
What segmentation does the market report cover?
-
The report is segmented by Product (De-icing systems, Deicer truck, and De-icing chemicals and fluids), End-user (Commercial and Others), Method (Spray de-icing, Chemical de-icing, Infrared heating, and Others), and Geography (North America, Europe, APAC, South America, and Middle East and Africa)
-
-
Which regions are analyzed in the report?
-
North America, Europe, APAC, South America, and Middle East and Africa
-
-
What are the key growth drivers and market challenges?
-
Rising procurement of new aircraft, Operational challenges in de-icing fluids
-
-
Who are the major players in the Aircraft De-Icing Market?
-
Accessible Technologies Inc., Aero Sense, Aeromag, Aircraft Deicing Inc., BASF SE, Clariant International Ltd., Dow Chemical Co., General Atomics, Global Ground Support LLC, Ground Support Specialists, Inland Group of Companies LLC., John Bean Technologies Corp., Kilfrost Group Plc, LNT Solutions, Mallaghan GA Inc., Proviron Industries NV, RTX Corp., Textron Inc., Tronair Inc., and Vestergaard Co.
-
We can help! Our analysts can customize this aircraft de-icing market research report to meet your requirements.
 RIA -
RIA - 
