Commercial Aircraft Seating Market Analysis, Size, and Forecast 2026-2030: Europe (Germany, UK, and France), North America (US, Canada, and Mexico), APAC (China, Japan, and India), Middle East and Africa (Saudi Arabia, UAE, and South Africa), South America (Brazil and Argentina), and Rest of World (ROW)

Commercial Aircraft Seating Market Analysis, Size, and Forecast 2026-2030:
Europe (Germany, UK, and France), North America (US, Canada, and Mexico), APAC (China, Japan, and India), Middle East and Africa (Saudi Arabia, UAE, and South Africa), South America (Brazil and Argentina), and Rest of World (ROW)

Published: Mar 2026 300 Pages SKU: IRTNTR40587

Market Overview at a Glance

$3.67 B
Market Opportunity
7.1%
CAGR 2025 - 2030
35.6%
Europe Growth
$6.37 B
Narrowbody segment 2024

Commercial Aircraft Seating Market Size 2026-2030

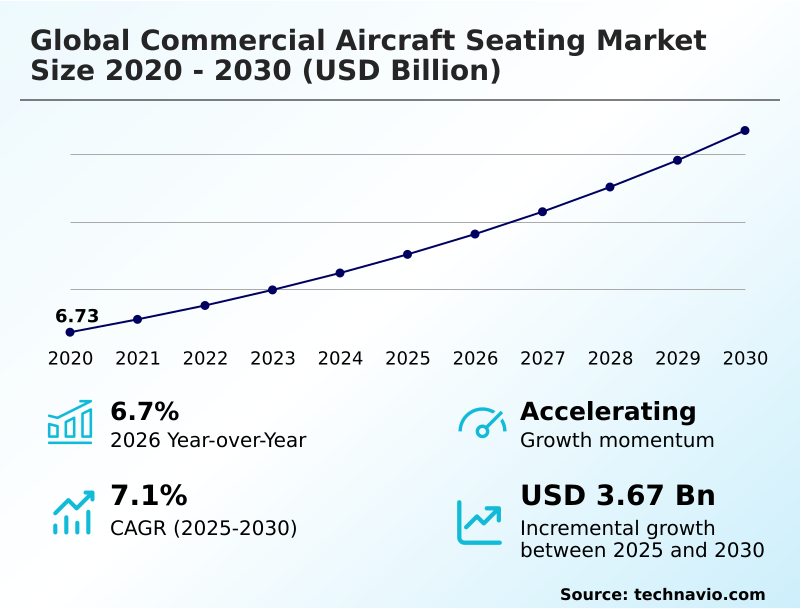
The commercial aircraft seating market size is valued to increase by USD 3.67 billion, at a CAGR of 7.1% from 2025 to 2030. Sustainable materiality and industrialization of ultra-lightweight composite seating architectures will drive the commercial aircraft seating market.

Major Market Trends & Insights

  • Europe dominated the market and accounted for a 35.6% growth during the forecast period.
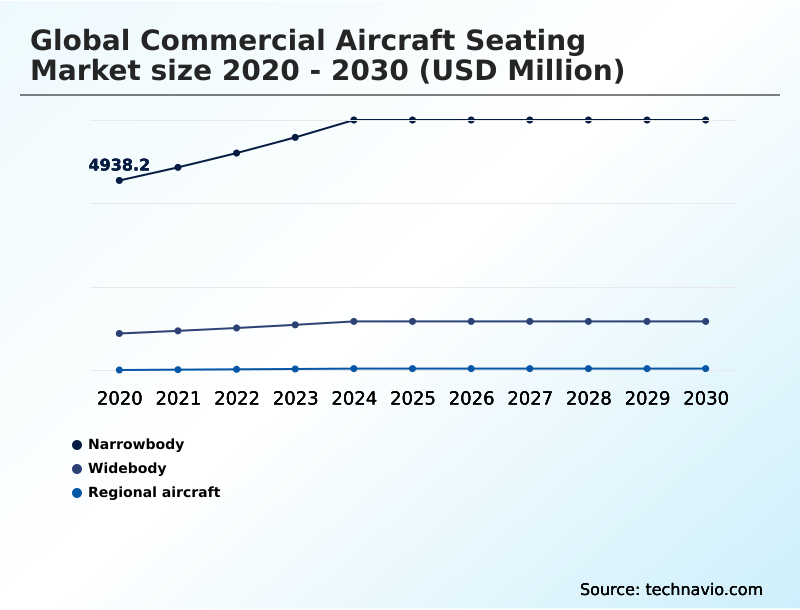
  • By Aircraft Type - Narrowbody segment was valued at USD 6.37 billion in 2024
  • By Cabin Class - Economy class segment accounted for the largest market revenue share in 2024

Market Size & Forecast

  • Market Opportunities: USD 5.96 billion
  • Market Future Opportunities: USD 3.67 billion
  • CAGR from 2025 to 2030 : 7.1%

Market Summary

  • The commercial aircraft seating market is undergoing a significant technological transformation, driven by the twin imperatives of operational efficiency and enhanced passenger experience. Airlines are increasingly adopting lightweight composite seating architectures to reduce aircraft weight, which in turn lowers fuel consumption and carbon emissions.
  • This move is complemented by a surge in high-density premiumization, where carriers are integrating AI-ready smart cabin interfaces and fully enclosed suites to capture high-yield travelers. A key business scenario involves airlines leveraging modular seat designs for cabin retrofit programs.
  • This allows them to extend the operational life of existing fleets and adapt to changing market demands with greater agility, avoiding the long lead times and high costs of new aircraft deliveries, which are often hampered by aerospace supply chain bottlenecks.
  • Concurrently, the industry is navigating the engineering paradox of balancing cabin densification with passenger comfort, a challenge addressed through innovations like advanced pressure-mapping technology and ergonomic slimline designs that adhere to stringent 16G crashworthiness standards.

What will be the Size of the Commercial Aircraft Seating Market during the forecast period?

Get Key Insights on Market Forecast (PDF) Request Free Sample

How is the Commercial Aircraft Seating Market Segmented?

The commercial aircraft seating industry research report provides comprehensive data (region-wise segment analysis), with forecasts and estimates in "USD million" for the period 2026-2030, as well as historical data from 2020-2024 for the following segments.

  • Aircraft type
    • Narrowbody
    • Widebody
    • Regional aircraft
  • Cabin class
    • Economy class
    • Business class
    • Premium economy class
    • First class
  • Type
    • Standard fixed-back
    • Recliner
    • Lie-flat
    • Suite or full-privacy
  • Geography
    • Europe
      • Germany
      • UK
      • France
    • North America
      • US
      • Canada
      • Mexico
    • APAC
      • China
      • Japan
      • India
    • Middle East and Africa
      • Saudi Arabia
      • UAE
      • South Africa
    • South America
      • Brazil
      • Argentina
    • Rest of World (ROW)

By Aircraft Type Insights

The narrowbody segment is estimated to witness significant growth during the forecast period.

The narrowbody segment is the primary volume driver, shaped by strategic fleet modernization and extensive cabin retrofit programs. Innovation in this space centers on slimline designs and lightweight materials to enable cabin densification, particularly for narrow-body aircraft seating.

Carriers are implementing these economy class seating solutions to improve load factors, a trend supported by a significant increase in deliveries of high-density configurations, which has led to a 15% rise in seat capacity on key domestic routes.

Concurrently, demand for wide-body aircraft seating and regional aircraft seating is evolving, with a focus on integrated cabin solutions.

All designs must adhere to strict 16g crashworthiness standards, influencing everything from seat-track fittings to the architecture of reconfigurable seating rows for enhanced passenger and crew seating.

Request Free Sample

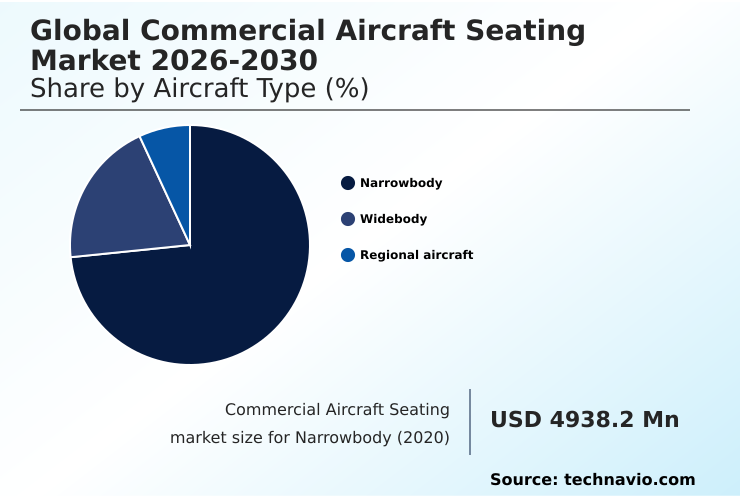
The Narrowbody segment was valued at USD 6.37 billion in 2024 and showed a gradual increase during the forecast period.

Request Free Sample

Regional Analysis

Europe is estimated to contribute 35.6% to the growth of the global market during the forecast period.Technavio’s analysts have elaborately explained the regional trends and drivers that shape the market during the forecast period.

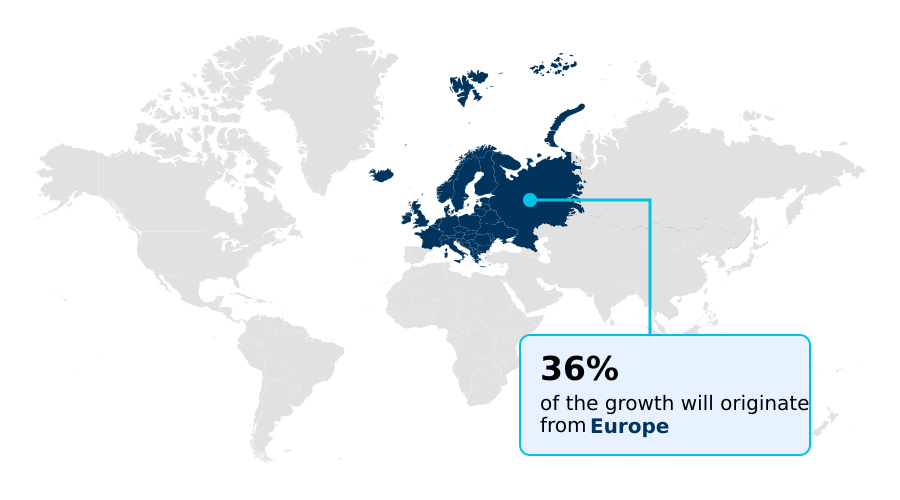
See How Commercial Aircraft Seating Market Demand is Rising in Europe Request Free Sample

The geographic landscape is diverse, with North America and Europe leading in cabin modernization through a phased refresh model and the adoption of modular seat designs.

Europe is a hub for bio-based composites and design-for-disassembly principles, while North America focuses on premium cabin retrofits. In APAC, the rapid fleet expansion drives demand for lightweight economy seats, with overall seat availability growing 2.8% year-over-year.

However, this push for density has contributed to a rise in passenger dissatisfaction scores by 12% in some segments. To counter this, manufacturers are integrating pressure-mapping technology and advanced ergonomic soft goods.

Innovations like additive manufacturing are enabling complex components for premium class seat integration, including companion suites and zero-gravity seating positions with features like high-wattage usb-c ports and efficient fixed-backrest mechanism designs.

Market Dynamics

Our researchers analyzed the data with 2025 as the base year, along with the key drivers, trends, and challenges. A holistic analysis of drivers will help companies refine their marketing strategies to gain a competitive advantage.

  • Strategic decision-making in the commercial aircraft seating market requires a deep understanding of evolving technical and operational trade-offs. An analysis of the benefits of lightweight composite seating architectures reveals a direct correlation to reduced fuel burn, a critical metric for airline profitability.
  • However, these materials must meet rigorous standards, underscoring the impact of 16g dynamic testing on seat design and the importance of structural integrity of carbon-fiber composites. The role of additive manufacturing in aircraft seating is expanding, enabling complex, weight-optimized components. This complements the trends in ai-ready smart cabin interfaces and innovations in biometric comfort systems for long-haul flights.
  • When comparing lie-flat business seats vs suites, the latter offers superior privacy but at a significant weight and cost penalty. A major consideration is the cost of compliance with next-generation safety standards, including technical specifications for 16g crashworthiness standards and advancements in fire-retardant foams. This is compounded by persistent challenges in the aerospace supply chain for seating.
  • The advantages of modular smart seat architectures are evident in rapid cabin refurbishment programs, which can reduce aircraft downtime by a notable margin. A cost-benefit analysis of cabin retrofit programs often favors upgrading existing fleets, driving demand for designs facilitating the integration of high-wattage usb-c ports and designing reconfigurable seating rows for accessibility.
  • The evolution of wellness-centric design in cabins and the push for implementing circular economy principles in seating are also shaping future investments, balancing cabin densification with passenger comfort.

What are the key market drivers leading to the rise in the adoption of Commercial Aircraft Seating Industry?

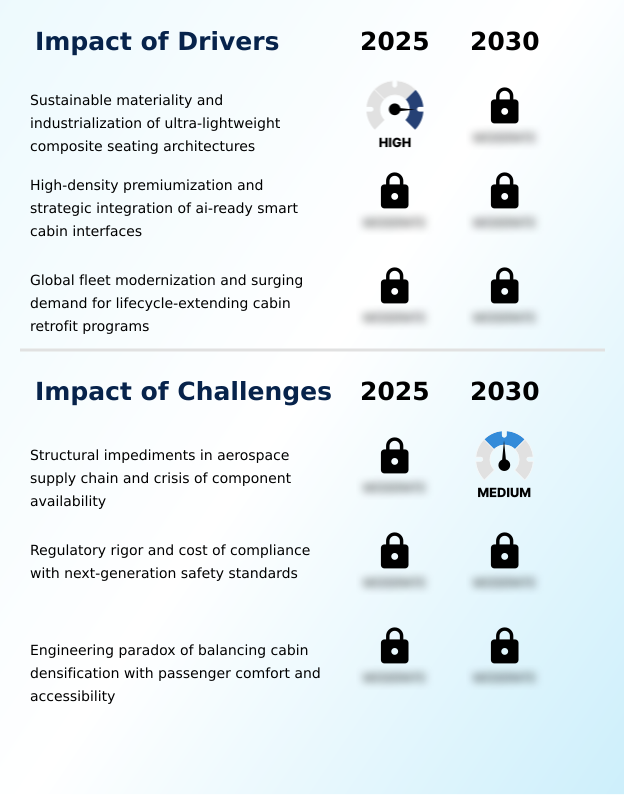
  • The transition toward sustainable materiality and the industrialization of ultra-lightweight composite seating architectures is a key driver for the market.

  • A primary driver is the shift toward sustainable materiality and ultra-lightweight composite seating, which enables weight reductions of up to 30% compared to designs using only advanced aluminum alloys. This directly supports fuel efficiency goals.
  • In parallel, the premiumization of long-haul travel propels demand for AI-ready smart cabin interfaces and fully enclosed suites offering high-fidelity privacy.
  • These digital-first architectures are becoming standard in luxury business class seating, where sliding privacy doors and suite or full-privacy enclosures are common.
  • The market for lie-flat business seats is expanding with these innovations, as carriers report a 3.5% year-over-year increase in available seat kilometers driven by enhanced lie-flat bed configurations.
  • These advancements rely on carbon fiber composite frames to balance complexity with weight.

What are the market trends shaping the Commercial Aircraft Seating Industry?

  • The institutionalization of wellness-centric design is transforming aircraft cabins, incorporating biometric comfort systems to create a health-focused and restorative passenger experience.

  • Market evolution is guided by the institutionalization of wellness-centric design and biometric comfort systems, transforming seats into tools for restorative travel and advanced inflight comfort. This focus on wellbeing has driven a 25% increase in the specification of seats with integrated health monitoring. Simultaneously, circular economy principles are gaining traction, with a push for recyclable cabin components and sustainable materials.
  • In premium cabins, modular smart architectures are redefining business class suite design with features like herringbone seat layouts and staggered seating arrangements. This trend includes plug-and-play electronics and smartphone-centric control, with over 70% of passengers now preferring to use personal devices to manage their environment.
  • Premium economy seat features are also adopting these trends, including cradle style recline mechanisms for enhanced ergonomics.

What challenges does the Commercial Aircraft Seating Industry face during its growth?

  • Structural impediments within the aerospace supply chain and a crisis in component availability present a key challenge affecting industry growth.

  • Structural impediments in the supply chain constrain the market for commercial aircraft seating systems, with bottlenecks for components like high-performance actuators and electrical harnesses causing production halts. These delays extend lead times by over 40% for critical parts.
  • Regulatory rigor adds another layer of complexity, as certifying new materials such as bio-based foams and thermoplastic composites to meet stringent fire-blocking specifications is costly. Adherence to standards for 16g dynamic testing and 21g crash forces extends product development timelines, impacting everything from standard fixed-back seats to complex first-class private suites.
  • Even sourcing standard fire-retardant foams for recliner seat mechanisms has become challenging, complicating cabin interior refurbishment programs and hindering the industry’s ability to meet delivery schedules.

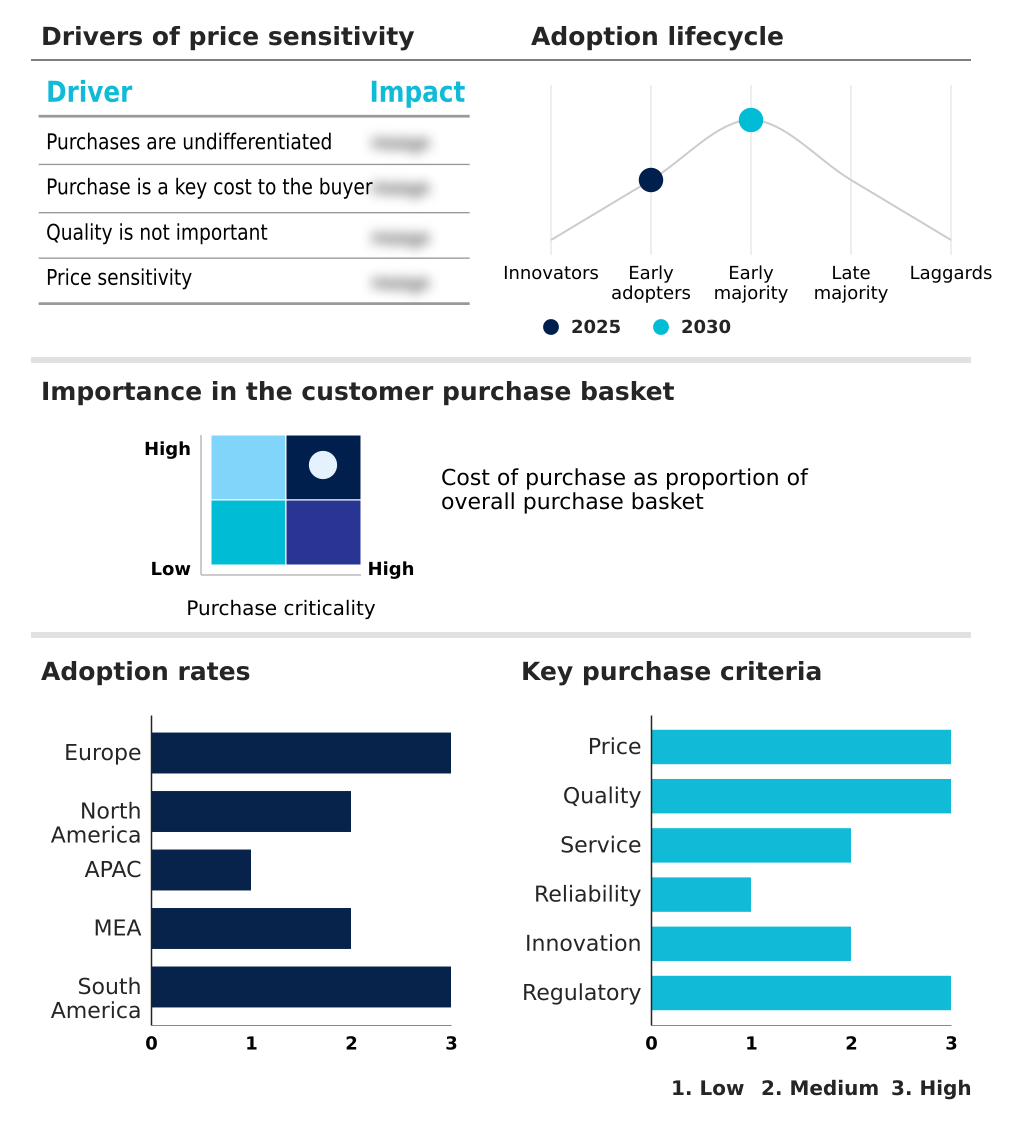
Exclusive Technavio Analysis on Customer Landscape

The commercial aircraft seating market forecasting report includes the adoption lifecycle of the market, covering from the innovator’s stage to the laggard’s stage. It focuses on adoption rates in different regions based on penetration. Furthermore, the commercial aircraft seating market report also includes key purchase criteria and drivers of price sensitivity to help companies evaluate and develop their market growth analysis strategies.

Customer Landscape of Commercial Aircraft Seating Industry

Competitive Landscape

Companies are implementing various strategies, such as strategic alliances, commercial aircraft seating market forecast, partnerships, mergers and acquisitions, geographical expansion, and product/service launches, to enhance their presence in the industry.

ACRO Aircraft Seating Ltd. - Innovations in lie-flat business seats and advanced inflight comfort technologies are defining premium cabin experiences, complemented by new economy seating designs focused on operational efficiency.

The industry research and growth report includes detailed analyses of the competitive landscape of the market and information about key companies, including:

  • ACRO Aircraft Seating Ltd.
  • Adient Plc
  • Airbus SE
  • AVIC Cabin Systems Ltd.
  • Aviointeriors Spa
  • Collins Aerospace
  • Expliseat SAS
  • Geven Spa
  • JAMCO Corp.
  • Mirus Aircraft Seating Ltd.
  • Optimares spa
  • Pitch Aircraft Seating Systems
  • RECARO Aircraft Seating GmbH
  • Regent Aerospace Corp.
  • Safran SA
  • ST Engineering Ltd.
  • Thompson Aero Seating Ltd.
  • TSI Seats Inc.
  • Unum Aircraft Seating Ltd.
  • ZIM AIRCRAFT SEATING GmbH

Qualitative and quantitative analysis of companies has been conducted to help clients understand the wider business environment as well as the strengths and weaknesses of key industry players. Data is qualitatively analyzed to categorize companies as pure play, category-focused, industry-focused, and diversified; it is quantitatively analyzed to categorize companies as dominant, leading, strong, tentative, and weak.

Recent Development and News in Commercial aircraft seating market

  • In May, 2025, Collins Aerospace introduced its SkyNook suite concept, an innovative solution designed to utilize unused widebody aircraft space to create accessible accommodations for passengers with unique mobility requirements.
  • In March, 2025, Aviointeriors Spa partnered with Salient Motion to integrate software-defined seat actuation control systems into its Allegra business-class range, a move designed to accelerate certification timelines and enable predictive maintenance capabilities.
  • In February, 2025, RECARO Aircraft Seating GmbH completed the initial phase of a multiclass cabin rollout for a major international carrier's B787-9 fleet, featuring its CL3710 and PL3530 seating platforms to enhance long-haul ergonomic support.
  • In September, 2024, RECARO Aircraft Seating GmbH announced a major expansion of its Swiebodzin facility in Poland, which is scheduled to double its production and logistics footprint to nearly 18,000 square meters upon completion.

Dive into Technavio’s robust research methodology, blending expert interviews, extensive data synthesis, and validated models for unparalleled Commercial Aircraft Seating Market insights. See full methodology.

Market Scope
Page number 300
Base year 2025
Historic period 2020-2024
Forecast period 2026-2030
Growth momentum & CAGR Accelerate at a CAGR of 7.1%
Market growth 2026-2030 USD 3667.7 million
Market structure Fragmented
YoY growth 2025-2026(%) 6.7%
Key countries Germany, UK, France, Italy, Spain, The Netherlands, US, Canada, Mexico, China, Japan, India, South Korea, Australia, Indonesia, Saudi Arabia, UAE, South Africa, Turkey, Israel, Brazil, Argentina and Chile
Competitive landscape Leading Companies, Market Positioning of Companies, Competitive Strategies, and Industry Risks

Request Free Sample

Research Analyst Overview

  • The commercial aircraft seating market is defined by a push toward sustainable materiality and the industrialization of ultra-lightweight composite seating. This involves the use of carbon-fiber composites, thermoplastic composites, and bio-based foams to meet strict environmental and performance mandates. Boardroom decisions are heavily influenced by the need to balance cabin densification with comfort, utilizing innovations like pressure-mapping technology.
  • The adoption of lightweight composite seating architectures is crucial, as new designs demonstrate a weight reduction of up to 40% over legacy systems. Development of AI-ready smart cabin interfaces, fully enclosed suites, and digital-first architectures with sliding privacy doors is transforming premium travel.
  • These systems require high-performance actuators and complex electrical harnesses, all while meeting 16g dynamic testing and 16g crashworthiness standards. Fleet modernization relies on efficient cabin retrofit programs and the phased refresh model, which benefit from modular seat designs and plug-and-play electronics. This modularity, central to modular smart architectures with smartphone-centric control, allows for faster upgrades.
  • Key trends include wellness-centric design with biometric comfort systems and a move toward circular economy principles featuring recyclable cabin components and design-for-disassembly philosophies. Challenges remain in sourcing fire-retardant foams and securing components like seat-track fittings, even for basic slimline designs.
  • The integration of high-wattage usb-c ports and reconfigurable seating rows, often enabled by additive manufacturing, reflects a commitment to a modern passenger experience.

What are the Key Data Covered in this Commercial Aircraft Seating Market Research and Growth Report?

  • What is the expected growth of the Commercial Aircraft Seating Market between 2026 and 2030?

    • USD 3.67 billion, at a CAGR of 7.1%

  • What segmentation does the market report cover?

    • The report is segmented by Aircraft Type (Narrowbody, Widebody, and Regional aircraft), Cabin Class (Economy class, Business class, Premium economy class, and First class), Type (Standard fixed-back, Recliner, Lie-flat, and Suite or full-privacy) and Geography (Europe, North America, APAC, Middle East and Africa, South America)

  • Which regions are analyzed in the report?

    • Europe, North America, APAC, Middle East and Africa and South America

  • What are the key growth drivers and market challenges?

    • Sustainable materiality and industrialization of ultra-lightweight composite seating architectures, Structural impediments in aerospace supply chain and crisis of component availability

  • Who are the major players in the Commercial Aircraft Seating Market?

    • ACRO Aircraft Seating Ltd., Adient Plc, Airbus SE, AVIC Cabin Systems Ltd., Aviointeriors Spa, Collins Aerospace, Expliseat SAS, Geven Spa, JAMCO Corp., Mirus Aircraft Seating Ltd., Optimares spa, Pitch Aircraft Seating Systems, RECARO Aircraft Seating GmbH, Regent Aerospace Corp., Safran SA, ST Engineering Ltd., Thompson Aero Seating Ltd., TSI Seats Inc., Unum Aircraft Seating Ltd. and ZIM AIRCRAFT SEATING GmbH

Market Research Insights

  • The market dynamic is defined by a dual focus on cabin densification and premiumization. For instance, the adoption of lightweight economy seats has contributed to a 30% reduction in overall seat weight on some new aircraft models, directly improving fuel efficiency.
  • Simultaneously, the demand for luxury business class seating is reshaping long-haul travel, with carriers investing heavily in lie-flat business seats and integrated cabin solutions. This investment is validated by a 3.5% year-over-year increase in available seat kilometers, largely driven by enhanced premium cabin offerings.
  • The evolution of commercial aircraft seating systems now balances the need for high-density economy class seating solutions with sophisticated premium economy seat features and advanced inflight comfort, ensuring a competitive edge across all passenger segments.

We can help! Our analysts can customize this commercial aircraft seating market research report to meet your requirements.

Get in touch

1. Executive Summary

1.1 Market overview

Executive Summary - Chart on Market Overview
Executive Summary - Data Table on Market Overview
Executive Summary - Chart on Global Market Characteristics
Executive Summary - Chart on Market by Geography
Executive Summary - Chart on Market Segmentation by Aircraft Type
Executive Summary - Chart on Market Segmentation by Cabin Class
Executive Summary - Chart on Market Segmentation by Type
Executive Summary - Chart on Incremental Growth
Executive Summary - Data Table on Incremental Growth
Executive Summary - Chart on Company Market Positioning

2. Technavio Analysis

2.1 Analysis of price sensitivity, lifecycle, customer purchase basket, adoption rates, and purchase criteria

2.2 Criticality of inputs and Factors of differentiation

Chart on Overview on criticality of inputs and factors of differentiation

2.3 Factors of disruption

Chart on Overview on factors of disruption

2.4 Impact of drivers and challenges

Chart on Impact of drivers and challenges in 2025 and 2030

3. Market Landscape

3.1 Market ecosystem

Chart on Parent Market
Data Table on - Parent Market

3.2 Market characteristics

Chart on Market characteristics analysis

3.3 Value chain analysis

Chart on Value chain analysis

4. Market Sizing

4.1 Market definition

Data Table on Offerings of companies included in the market definition

4.2 Market segment analysis

Market segments

4.3 Market size 2025

4.4 Market outlook: Forecast for 2025-2030

Chart on Global - Market size and forecast 2025-2030 ($ million)
Data Table on Global - Market size and forecast 2025-2030 ($ million)
Chart on Global Market: Year-over-year growth 2025-2030 (%)
Data Table on Global Market: Year-over-year growth 2025-2030 (%)

5. Historic Market Size

5.1 Global Commercial Aircraft Seating Market 2020 - 2024

Historic Market Size - Data Table on Global Commercial Aircraft Seating Market 2020 - 2024 ($ million)

5.2 Aircraft Type segment analysis 2020 - 2024

Historic Market Size - Aircraft Type Segment 2020 - 2024 ($ million)

5.3 Cabin Class segment analysis 2020 - 2024

Historic Market Size - Cabin Class Segment 2020 - 2024 ($ million)

5.4 Type segment analysis 2020 - 2024

Historic Market Size - Type Segment 2020 - 2024 ($ million)

5.5 Geography segment analysis 2020 - 2024

Historic Market Size - Geography Segment 2020 - 2024 ($ million)

5.6 Country segment analysis 2020 - 2024

Historic Market Size - Country Segment 2020 - 2024 ($ million)

6. Qualitative Analysis

6.1 Impact of AI in global commercial aircraft seating market

7. Five Forces Analysis

7.1 Five forces summary

Five forces analysis - Comparison between 2025 and 2030

7.2 Bargaining power of buyers

Bargaining power of buyers - Impact of key factors 2025 and 2030

7.3 Bargaining power of suppliers

Bargaining power of suppliers - Impact of key factors in 2025 and 2030

7.4 Threat of new entrants

Threat of new entrants - Impact of key factors in 2025 and 2030

7.5 Threat of substitutes

Threat of substitutes - Impact of key factors in 2025 and 2030

7.6 Threat of rivalry

Threat of rivalry - Impact of key factors in 2025 and 2030

7.7 Market condition

Chart on Market condition - Five forces 2025 and 2030

8. Market Segmentation by Aircraft Type

8.1 Market segments

Chart on Aircraft Type - Market share 2025-2030 (%)
Data Table on Aircraft Type - Market share 2025-2030 (%)

8.2 Comparison by Aircraft Type

Chart on Comparison by Aircraft Type
Data Table on Comparison by Aircraft Type

8.3 Narrowbody - Market size and forecast 2025-2030

Chart on Narrowbody - Market size and forecast 2025-2030 ($ million)
Data Table on Narrowbody - Market size and forecast 2025-2030 ($ million)
Chart on Narrowbody - Year-over-year growth 2025-2030 (%)
Data Table on Narrowbody - Year-over-year growth 2025-2030 (%)

8.4 Widebody - Market size and forecast 2025-2030

Chart on Widebody - Market size and forecast 2025-2030 ($ million)
Data Table on Widebody - Market size and forecast 2025-2030 ($ million)
Chart on Widebody - Year-over-year growth 2025-2030 (%)
Data Table on Widebody - Year-over-year growth 2025-2030 (%)

8.5 Regional aircraft - Market size and forecast 2025-2030

Chart on Regional aircraft - Market size and forecast 2025-2030 ($ million)
Data Table on Regional aircraft - Market size and forecast 2025-2030 ($ million)
Chart on Regional aircraft - Year-over-year growth 2025-2030 (%)
Data Table on Regional aircraft - Year-over-year growth 2025-2030 (%)

8.6 Market opportunity by Aircraft Type

Market opportunity by Aircraft Type ($ million)
Data Table on Market opportunity by Aircraft Type ($ million)

9. Market Segmentation by Cabin Class

9.1 Market segments

Chart on Cabin Class - Market share 2025-2030 (%)
Data Table on Cabin Class - Market share 2025-2030 (%)

9.2 Comparison by Cabin Class

Chart on Comparison by Cabin Class
Data Table on Comparison by Cabin Class

9.3 Economy class - Market size and forecast 2025-2030

Chart on Economy class - Market size and forecast 2025-2030 ($ million)
Data Table on Economy class - Market size and forecast 2025-2030 ($ million)
Chart on Economy class - Year-over-year growth 2025-2030 (%)
Data Table on Economy class - Year-over-year growth 2025-2030 (%)

9.4 Business class - Market size and forecast 2025-2030

Chart on Business class - Market size and forecast 2025-2030 ($ million)
Data Table on Business class - Market size and forecast 2025-2030 ($ million)
Chart on Business class - Year-over-year growth 2025-2030 (%)
Data Table on Business class - Year-over-year growth 2025-2030 (%)

9.5 Premium economy class - Market size and forecast 2025-2030

Chart on Premium economy class - Market size and forecast 2025-2030 ($ million)
Data Table on Premium economy class - Market size and forecast 2025-2030 ($ million)
Chart on Premium economy class - Year-over-year growth 2025-2030 (%)
Data Table on Premium economy class - Year-over-year growth 2025-2030 (%)

9.6 First class - Market size and forecast 2025-2030

Chart on First class - Market size and forecast 2025-2030 ($ million)
Data Table on First class - Market size and forecast 2025-2030 ($ million)
Chart on First class - Year-over-year growth 2025-2030 (%)
Data Table on First class - Year-over-year growth 2025-2030 (%)

9.7 Market opportunity by Cabin Class

Market opportunity by Cabin Class ($ million)
Data Table on Market opportunity by Cabin Class ($ million)

10. Market Segmentation by Type

10.1 Market segments

Chart on Type - Market share 2025-2030 (%)
Data Table on Type - Market share 2025-2030 (%)

10.2 Comparison by Type

Chart on Comparison by Type
Data Table on Comparison by Type

10.3 Standard fixed-back - Market size and forecast 2025-2030

Chart on Standard fixed-back - Market size and forecast 2025-2030 ($ million)
Data Table on Standard fixed-back - Market size and forecast 2025-2030 ($ million)
Chart on Standard fixed-back - Year-over-year growth 2025-2030 (%)
Data Table on Standard fixed-back - Year-over-year growth 2025-2030 (%)

10.4 Recliner - Market size and forecast 2025-2030

Chart on Recliner - Market size and forecast 2025-2030 ($ million)
Data Table on Recliner - Market size and forecast 2025-2030 ($ million)
Chart on Recliner - Year-over-year growth 2025-2030 (%)
Data Table on Recliner - Year-over-year growth 2025-2030 (%)

10.5 Lie-flat - Market size and forecast 2025-2030

Chart on Lie-flat - Market size and forecast 2025-2030 ($ million)
Data Table on Lie-flat - Market size and forecast 2025-2030 ($ million)
Chart on Lie-flat - Year-over-year growth 2025-2030 (%)
Data Table on Lie-flat - Year-over-year growth 2025-2030 (%)

10.6 Suite or full-privacy - Market size and forecast 2025-2030

Chart on Suite or full-privacy - Market size and forecast 2025-2030 ($ million)
Data Table on Suite or full-privacy - Market size and forecast 2025-2030 ($ million)
Chart on Suite or full-privacy - Year-over-year growth 2025-2030 (%)
Data Table on Suite or full-privacy - Year-over-year growth 2025-2030 (%)

10.7 Market opportunity by Type

Market opportunity by Type ($ million)
Data Table on Market opportunity by Type ($ million)

11. Customer Landscape

11.1 Customer landscape overview

Analysis of price sensitivity, lifecycle, customer purchase basket, adoption rates, and purchase criteria

12. Geographic Landscape

12.1 Geographic segmentation

Chart on Market share by geography 2025-2030 (%)
Data Table on Market share by geography 2025-2030 (%)

12.2 Geographic comparison

Chart on Geographic comparison
Data Table on Geographic comparison

12.3 Europe - Market size and forecast 2025-2030

Chart on Europe - Market size and forecast 2025-2030 ($ million)
Data Table on Europe - Market size and forecast 2025-2030 ($ million)
Chart on Europe - Year-over-year growth 2025-2030 (%)
Data Table on Europe - Year-over-year growth 2025-2030 (%)
Chart on Regional Comparison - Europe
Data Table on Regional Comparison - Europe

12.3.1 Germany - Market size and forecast 2025-2030

Chart on Germany - Market size and forecast 2025-2030 ($ million)
Data Table on Germany - Market size and forecast 2025-2030 ($ million)
Chart on Germany - Year-over-year growth 2025-2030 (%)
Data Table on Germany - Year-over-year growth 2025-2030 (%)

12.3.2 UK - Market size and forecast 2025-2030

Chart on UK - Market size and forecast 2025-2030 ($ million)
Data Table on UK - Market size and forecast 2025-2030 ($ million)
Chart on UK - Year-over-year growth 2025-2030 (%)
Data Table on UK - Year-over-year growth 2025-2030 (%)

12.3.3 France - Market size and forecast 2025-2030

Chart on France - Market size and forecast 2025-2030 ($ million)
Data Table on France - Market size and forecast 2025-2030 ($ million)
Chart on France - Year-over-year growth 2025-2030 (%)
Data Table on France - Year-over-year growth 2025-2030 (%)

12.3.4 Italy - Market size and forecast 2025-2030

Chart on Italy - Market size and forecast 2025-2030 ($ million)
Data Table on Italy - Market size and forecast 2025-2030 ($ million)
Chart on Italy - Year-over-year growth 2025-2030 (%)
Data Table on Italy - Year-over-year growth 2025-2030 (%)

12.3.5 Spain - Market size and forecast 2025-2030

Chart on Spain - Market size and forecast 2025-2030 ($ million)
Data Table on Spain - Market size and forecast 2025-2030 ($ million)
Chart on Spain - Year-over-year growth 2025-2030 (%)
Data Table on Spain - Year-over-year growth 2025-2030 (%)

12.3.6 The Netherlands - Market size and forecast 2025-2030

Chart on The Netherlands - Market size and forecast 2025-2030 ($ million)
Data Table on The Netherlands - Market size and forecast 2025-2030 ($ million)
Chart on The Netherlands - Year-over-year growth 2025-2030 (%)
Data Table on The Netherlands - Year-over-year growth 2025-2030 (%)

12.4 North America - Market size and forecast 2025-2030

Chart on North America - Market size and forecast 2025-2030 ($ million)
Data Table on North America - Market size and forecast 2025-2030 ($ million)
Chart on North America - Year-over-year growth 2025-2030 (%)
Data Table on North America - Year-over-year growth 2025-2030 (%)
Chart on Regional Comparison - North America
Data Table on Regional Comparison - North America

12.4.1 US - Market size and forecast 2025-2030

Chart on US - Market size and forecast 2025-2030 ($ million)
Data Table on US - Market size and forecast 2025-2030 ($ million)
Chart on US - Year-over-year growth 2025-2030 (%)
Data Table on US - Year-over-year growth 2025-2030 (%)

12.4.2 Canada - Market size and forecast 2025-2030

Chart on Canada - Market size and forecast 2025-2030 ($ million)
Data Table on Canada - Market size and forecast 2025-2030 ($ million)
Chart on Canada - Year-over-year growth 2025-2030 (%)
Data Table on Canada - Year-over-year growth 2025-2030 (%)

12.4.3 Mexico - Market size and forecast 2025-2030

Chart on Mexico - Market size and forecast 2025-2030 ($ million)
Data Table on Mexico - Market size and forecast 2025-2030 ($ million)
Chart on Mexico - Year-over-year growth 2025-2030 (%)
Data Table on Mexico - Year-over-year growth 2025-2030 (%)

12.5 APAC - Market size and forecast 2025-2030

Chart on APAC - Market size and forecast 2025-2030 ($ million)
Data Table on APAC - Market size and forecast 2025-2030 ($ million)
Chart on APAC - Year-over-year growth 2025-2030 (%)
Data Table on APAC - Year-over-year growth 2025-2030 (%)
Chart on Regional Comparison - APAC
Data Table on Regional Comparison - APAC

12.5.1 China - Market size and forecast 2025-2030

Chart on China - Market size and forecast 2025-2030 ($ million)
Data Table on China - Market size and forecast 2025-2030 ($ million)
Chart on China - Year-over-year growth 2025-2030 (%)
Data Table on China - Year-over-year growth 2025-2030 (%)

12.5.2 Japan - Market size and forecast 2025-2030

Chart on Japan - Market size and forecast 2025-2030 ($ million)
Data Table on Japan - Market size and forecast 2025-2030 ($ million)
Chart on Japan - Year-over-year growth 2025-2030 (%)
Data Table on Japan - Year-over-year growth 2025-2030 (%)

12.5.3 India - Market size and forecast 2025-2030

Chart on India - Market size and forecast 2025-2030 ($ million)
Data Table on India - Market size and forecast 2025-2030 ($ million)
Chart on India - Year-over-year growth 2025-2030 (%)
Data Table on India - Year-over-year growth 2025-2030 (%)

12.5.4 South Korea - Market size and forecast 2025-2030

Chart on South Korea - Market size and forecast 2025-2030 ($ million)
Data Table on South Korea - Market size and forecast 2025-2030 ($ million)
Chart on South Korea - Year-over-year growth 2025-2030 (%)
Data Table on South Korea - Year-over-year growth 2025-2030 (%)

12.5.5 Australia - Market size and forecast 2025-2030

Chart on Australia - Market size and forecast 2025-2030 ($ million)
Data Table on Australia - Market size and forecast 2025-2030 ($ million)
Chart on Australia - Year-over-year growth 2025-2030 (%)
Data Table on Australia - Year-over-year growth 2025-2030 (%)

12.5.6 Indonesia - Market size and forecast 2025-2030

Chart on Indonesia - Market size and forecast 2025-2030 ($ million)
Data Table on Indonesia - Market size and forecast 2025-2030 ($ million)
Chart on Indonesia - Year-over-year growth 2025-2030 (%)
Data Table on Indonesia - Year-over-year growth 2025-2030 (%)

12.6 Middle East and Africa - Market size and forecast 2025-2030

Chart on Middle East and Africa - Market size and forecast 2025-2030 ($ million)
Data Table on Middle East and Africa - Market size and forecast 2025-2030 ($ million)
Chart on Middle East and Africa - Year-over-year growth 2025-2030 (%)
Data Table on Middle East and Africa - Year-over-year growth 2025-2030 (%)
Chart on Regional Comparison - Middle East and Africa
Data Table on Regional Comparison - Middle East and Africa

12.6.1 Saudi Arabia - Market size and forecast 2025-2030

Chart on Saudi Arabia - Market size and forecast 2025-2030 ($ million)
Data Table on Saudi Arabia - Market size and forecast 2025-2030 ($ million)
Chart on Saudi Arabia - Year-over-year growth 2025-2030 (%)
Data Table on Saudi Arabia - Year-over-year growth 2025-2030 (%)

12.6.2 UAE - Market size and forecast 2025-2030

Chart on UAE - Market size and forecast 2025-2030 ($ million)
Data Table on UAE - Market size and forecast 2025-2030 ($ million)
Chart on UAE - Year-over-year growth 2025-2030 (%)
Data Table on UAE - Year-over-year growth 2025-2030 (%)

12.6.3 South Africa - Market size and forecast 2025-2030

Chart on South Africa - Market size and forecast 2025-2030 ($ million)
Data Table on South Africa - Market size and forecast 2025-2030 ($ million)
Chart on South Africa - Year-over-year growth 2025-2030 (%)
Data Table on South Africa - Year-over-year growth 2025-2030 (%)

12.6.4 Turkey - Market size and forecast 2025-2030

Chart on Turkey - Market size and forecast 2025-2030 ($ million)
Data Table on Turkey - Market size and forecast 2025-2030 ($ million)
Chart on Turkey - Year-over-year growth 2025-2030 (%)
Data Table on Turkey - Year-over-year growth 2025-2030 (%)

12.6.5 Israel - Market size and forecast 2025-2030

Chart on Israel - Market size and forecast 2025-2030 ($ million)
Data Table on Israel - Market size and forecast 2025-2030 ($ million)
Chart on Israel - Year-over-year growth 2025-2030 (%)
Data Table on Israel - Year-over-year growth 2025-2030 (%)

12.7 South America - Market size and forecast 2025-2030

Chart on South America - Market size and forecast 2025-2030 ($ million)
Data Table on South America - Market size and forecast 2025-2030 ($ million)
Chart on South America - Year-over-year growth 2025-2030 (%)
Data Table on South America - Year-over-year growth 2025-2030 (%)
Chart on Regional Comparison - South America
Data Table on Regional Comparison - South America

12.7.1 Brazil - Market size and forecast 2025-2030

Chart on Brazil - Market size and forecast 2025-2030 ($ million)
Data Table on Brazil - Market size and forecast 2025-2030 ($ million)
Chart on Brazil - Year-over-year growth 2025-2030 (%)
Data Table on Brazil - Year-over-year growth 2025-2030 (%)

12.7.2 Argentina - Market size and forecast 2025-2030

Chart on Argentina - Market size and forecast 2025-2030 ($ million)
Data Table on Argentina - Market size and forecast 2025-2030 ($ million)
Chart on Argentina - Year-over-year growth 2025-2030 (%)
Data Table on Argentina - Year-over-year growth 2025-2030 (%)

12.7.3 Chile - Market size and forecast 2025-2030

Chart on Chile - Market size and forecast 2025-2030 ($ million)
Data Table on Chile - Market size and forecast 2025-2030 ($ million)
Chart on Chile - Year-over-year growth 2025-2030 (%)
Data Table on Chile - Year-over-year growth 2025-2030 (%)

12.8 Market opportunity by geography

Market opportunity by geography ($ million)
Data Tables on Market opportunity by geography ($ million)

13. Drivers, Challenges, and Opportunity

13.1 Market drivers

Sustainable materiality and industrialization of ultra-lightweight composite seating architectures
High-density premiumization and strategic integration of ai-ready smart cabin interfaces
Global fleet modernization and surging demand for lifecycle-extending cabin retrofit programs

13.2 Market challenges

Structural impediments in aerospace supply chain and crisis of component availability
Regulatory rigor and cost of compliance with next-generation safety standards
Engineering paradox of balancing cabin densification with passenger comfort and accessibility

13.3 Impact of drivers and challenges

Impact of drivers and challenges in 2025 and 2030

13.4 Market opportunities

Institutionalization of wellness-centric design and biometric comfort systems
Circular economy principles and sustainable material innovation
Expansion of modular smart architectures and smartphone-centric control

14. Competitive Landscape

14.1 Overview

14.2

Overview on criticality of inputs and factors of differentiation

14.3 Landscape disruption

Overview on factors of disruption

14.4 Industry risks

Impact of key risks on business

15. Competitive Analysis

15.1 Companies profiled

Companies covered

15.2 Company ranking index

15.3 Market positioning of companies

Matrix on companies position and classification

15.4 Adient Plc

Adient Plc - Overview
Adient Plc - Business segments
Adient Plc - Key offerings
Adient Plc - Segment focus
SWOT

15.5 Airbus SE

Airbus SE - Overview
Airbus SE - Business segments
Airbus SE - Key news
Airbus SE - Key offerings
Airbus SE - Segment focus
SWOT

15.6 AVIC Cabin Systems Ltd.

AVIC Cabin Systems Ltd. - Overview
AVIC Cabin Systems Ltd. - Product / Service
AVIC Cabin Systems Ltd. - Key offerings
SWOT

15.7 Collins Aerospace

Collins Aerospace - Overview
Collins Aerospace - Product / Service
Collins Aerospace - Key news
Collins Aerospace - Key offerings
SWOT

15.8 Geven Spa

Geven Spa - Overview
Geven Spa - Product / Service
Geven Spa - Key news
Geven Spa - Key offerings
SWOT

15.9 JAMCO Corp.

JAMCO Corp. - Overview
JAMCO Corp. - Business segments
JAMCO Corp. - Key offerings
JAMCO Corp. - Segment focus
SWOT

15.10 Mirus Aircraft Seating Ltd.

Mirus Aircraft Seating Ltd. - Overview
Mirus Aircraft Seating Ltd. - Product / Service
Mirus Aircraft Seating Ltd. - Key offerings
SWOT

15.11 Optimares spa

Optimares spa - Overview
Optimares spa - Product / Service
Optimares spa - Key offerings
SWOT

15.12 RECARO Aircraft Seating GmbH

RECARO Aircraft Seating GmbH - Overview
RECARO Aircraft Seating GmbH - Product / Service
RECARO Aircraft Seating GmbH - Key offerings
SWOT

15.13 Regent Aerospace Corp.

Regent Aerospace Corp. - Overview
Regent Aerospace Corp. - Product / Service
Regent Aerospace Corp. - Key offerings
SWOT

15.14 Safran SA

Safran SA - Overview
Safran SA - Business segments
Safran SA - Key news
Safran SA - Key offerings
Safran SA - Segment focus
SWOT

15.15 ST Engineering Ltd.

ST Engineering Ltd. - Overview
ST Engineering Ltd. - Business segments
ST Engineering Ltd. - Key news
ST Engineering Ltd. - Key offerings
ST Engineering Ltd. - Segment focus
SWOT

15.16 Thompson Aero Seating Ltd.

Thompson Aero Seating Ltd. - Overview
Thompson Aero Seating Ltd. - Product / Service
Thompson Aero Seating Ltd. - Key offerings
SWOT

15.17 TSI Seats Inc.

TSI Seats Inc. - Overview
TSI Seats Inc. - Product / Service
TSI Seats Inc. - Key offerings
SWOT

15.18 ZIM AIRCRAFT SEATING GmbH

ZIM AIRCRAFT SEATING GmbH - Overview
ZIM AIRCRAFT SEATING GmbH - Product / Service
ZIM AIRCRAFT SEATING GmbH - Key offerings
SWOT

16. Appendix

16.1 Scope of the report

Market definition
Objectives
Notes and caveats

16.2 Inclusions and exclusions checklist

Inclusions checklist
Exclusions checklist

16.3 Currency conversion rates for US$

16.4 Research methodology

16.5 Data procurement

Information sources

16.6 Data validation

16.7 Validation techniques employed for market sizing

16.8 Data synthesis

16.9 360 degree market analysis

16.10 List of abbreviations

Research Methodology

Technavio presents a detailed picture of the market by way of study, synthesis, and summation of data from multiple sources. The analysts have presented the various facets of the market with a particular focus on identifying the key industry influencers. The data thus presented is comprehensive, reliable, and the result of extensive research, both primary and secondary.

INFORMATION SOURCES

Primary sources

  • Manufacturers and suppliers
  • Channel partners
  • Industry experts
  • Strategic decision makers

Secondary sources

  • Industry journals and periodicals
  • Government data
  • Financial reports of key industry players
  • Historical data
  • Press releases

DATA ANALYSIS

Data Synthesis

  • Collation of data
  • Estimation of key figures
  • Analysis of derived insights

Data Validation

  • Triangulation with data models
  • Reference against proprietary databases
  • Corroboration with industry experts

REPORT WRITING

Qualitative

  • Market drivers
  • Market challenges
  • Market trends
  • Five forces analysis

Quantitative

  • Market size and forecast
  • Market segmentation
  • Geographical insights
  • Competitive landscape

Interested in this report?

Get your sample now to see our research methodology and insights!

Download Now

Frequently Asked Questions

Commercial Aircraft Seating market growth will increase by USD 3667.7 million during 2026-2030.

The Commercial Aircraft Seating market is expected to grow at a CAGR of 7.1% during 2026-2030.

Commercial Aircraft Seating market is segmented by Aircraft type (Narrowbody, Widebody, Regional aircraft) Cabin class (Economy class, Business class, Premium economy class, First class) Type (Standard fixed-back, Recliner, Lie-flat, Suite or full-privacy)

ACRO Aircraft Seating Ltd., Adient Plc, Airbus SE, AVIC Cabin Systems Ltd., Aviointeriors Spa, Collins Aerospace, Expliseat SAS, Geven Spa, JAMCO Corp., Mirus Aircraft Seating Ltd., Optimares spa, Pitch Aircraft Seating Systems, RECARO Aircraft Seating GmbH, Regent Aerospace Corp., Safran SA, ST Engineering Ltd., Thompson Aero Seating Ltd., TSI Seats Inc., Unum Aircraft Seating Ltd., ZIM AIRCRAFT SEATING GmbH are a few of the key vendors in the Commercial Aircraft Seating market.

Europe will register the highest growth rate of 35.6% among the other regions. Therefore, the Commercial Aircraft Seating market in Europe is expected to garner significant business opportunities for the vendors during the forecast period.

Germany, UK, France, Italy, Spain, The Netherlands, US, Canada, Mexico, China, Japan, India, South Korea, Australia, Indonesia, Saudi Arabia, UAE, South Africa, Turkey, Israel, Brazil, Argentina, Chile

  • Sustainable materiality and industrialization of ultra-lightweight composite seating architectures is the driving factor this market.

The Commercial Aircraft Seating market vendors should focus on grabbing business opportunities from the Aircraft type segment as it accounted for the largest market share in the base year.