Aircraft Switches Market Size 2024-2028
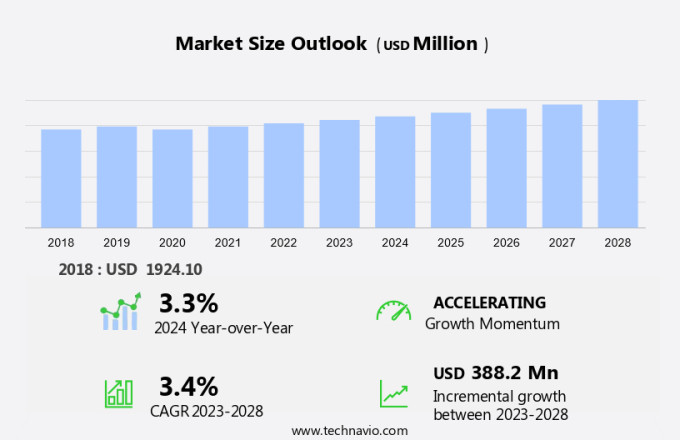
The aircraft switches market size is forecast to increase by USD 388.2 million at a CAGR of 3.4% between 2023 and 2028.
- The market is experiencing significant growth due to several driving factors. One key trend is the modernization and upgrade of commercial aircraft cabin designs, leading to an increased demand for advanced electrical switches and human-machine interfaces (HMIs). Additionally, the rise in demand for in-flight entertainment and connectivity (IFEC) systems is fueling market growth. Another factor is the implementation of fly-by-wire systems and automation in flight control systems, which require high-performance switches. Furthermore, stringent aviation regulations ensure the use of reliable and safe switches in aircraft. Companies like TE Connectivity are at the forefront of providing innovative solutions to meet these demands. LED push-button switches offer advantages such as long life, low power consumption, and improved visual feedback. As the aviation industry continues to evolve, the market for aircraft switches is expected to grow steadily.
What will the size of the market be during the forecast period?
- The market is a crucial segment within the aviation industry, providing essential components for the safe and efficient operation of aircraft. These switches, which include toggle switches, push-button switches, and rocker switches, are integral to the pilot's cockpit dashboard, enabling them to manage various aircraft systems. Aircraft deliveries have continued to increase, driving the demand for advanced switch technology. Airlines are focusing on enhancing inflight connectivity and inflight entertainment systems, necessitating the integration of advanced electrical switches and control units into their aircraft. Flybywire technologies, such as digital fly-by-wire flight control systems, rely on electrical impulses transmitted through aircraft switches to manage flight control inputs. The market is witnessing significant growth due to the increasing commercial aircraft production and the adoption of lightweight aircraft. The market is expected to experience steady expansion as airlines aim to improve their fleet's fuel efficiency and reduce operational costs. Fly-by-wire systems are increasingly being adopted in modern aircraft, replacing traditional manual switches with digital airplane switches.
- Prototyping tools are being utilized to develop and test these advanced switch technologies, ensuring their compatibility with various aircraft systems. Travel restrictions and airfare inflation have not significantly impacted the growth of the market. Despite these challenges, the market continues to grow, driven by the increasing demand for advanced switch technology and the need for safer, more efficient aircraft. In conclusion, the market is an essential component of the aviation industry, providing critical components for the safe and efficient operation of aircraft. The market is expected to grow steadily, driven by the increasing demand for advanced switch technology, the adoption of digital fly-by-wire systems, and the need for fuel-efficient and cost-effective aircraft.
How is this market segmented and which is the largest segment?
The market research report provides comprehensive data (region-wise segment analysis), with forecasts and estimates in "USD million" for the period 2024-2028, as well as historical data from 2018-2022 for the following segments.
- End-user
- OEM
- Aftermarket
- Geography
- North America
- US
- Europe
- APAC
- China
- India
- Japan
- South America
- Middle East and Africa
- North America
By End-user Insights
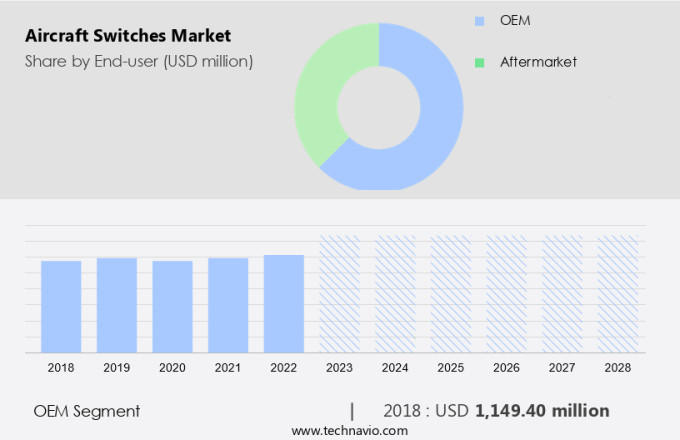
- The OEM segment is estimated to witness significant growth during the forecast period.
The market is experiencing notable expansion in the Original Equipment Manufacturer (OEM) segment. OEMs play a pivotal role in the aviation industry by installing aircraft switches during the initial production of new aircraft. This trend is fueled by the expanding airline industry and the growing demand for advanced, fuel-efficient aircraft. Major aircraft manufacturers, such as Boeing and Airbus, are at the forefront of this growth, continually innovating and increasing production capacities. TE Connectivity and other key players in the market contribute to the development of aircraft switches through the use of advanced technologies like fly-by-wire systems, automation, and human-machine interfaces (HMI). These technologies enhance the overall aircraft experience, with LED push-button switches and electrical switches being integral components.
Furthermore, the increasing popularity of lightweight aircraft and advanced flight control systems further bolsters market growth. The market is expected to continue its upward trajectory, as the aviation sector recovers from travel restrictions and passenger demand increases.
Get a glance at the market report of share of various segments Request Free Sample
The OEM segment was valued at USD 1.15 billion in 2018 and showed a gradual increase during the forecast period.
Regional Analysis
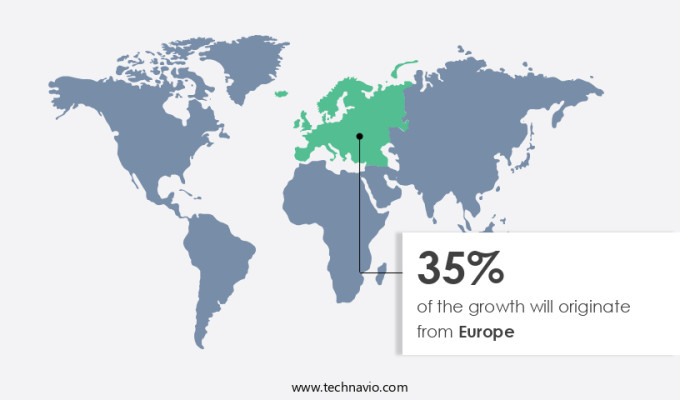
- Europe is estimated to contribute 35% to the growth of the global market during the forecast period.
Technavio's analysts have elaborately explained the regional trends and drivers that shape the market during the forecast period.
For more insights on the market share of various regions Request Free Sample
In the aviation industry, North America dominates the market in 2023. The presence of major commercial aircraft manufacturers such as Boeing from the United States and Bombardier from Canada significantly boosts the demand for aircraft switches in this region. This trend is projected to persist, leading to market expansion during the forecast period. Furthermore, the establishment of new aircraft manufacturing facilities and related activities in developing countries like Mexico within North America presents lucrative opportunities for the market. The increasing number of aircraft deliveries contributes to the growing global aircraft fleet size, further fueling market growth. Inflight connectivity and entertainment systems in modern aircraft rely heavily on aircraft electrical switches and control units. The adoption of flybywire technologies in aircraft design also necessitates the use of advanced aircraft switches. Prototyping tools and manufacturing processes continue to evolve, ensuring the production of high-quality aircraft switches to meet the demands of the aviation industry.
Market Dynamics
Our researchers analyzed the data with 2023 as the base year, along with the key drivers, trends, and challenges. A holistic analysis of drivers will help companies refine their marketing strategies to gain a competitive advantage.
What are the key market drivers leading to the rise in adoption of Aircraft Switches Market?
Modernization and upgrade of commercial aircraft cabin designs is the key driver of the market.
- The global air transport industry is experiencing a notable transformation with the modernization and enhancement of commercial aircraft cabins. According to the International Air Transport Association (IATA), passenger traffic increased by 11% year-over-year in April 2024, fueled by the expanding popularity of low-cost carriers (LCCs) and the growing middle class in developing economies. This trend has intensified the need for aircraft interior refurbishment and space optimization among both LCCs and domestic airlines. In response, commercial airlines are revamping their seating arrangements to accommodate more premium economy seats and redesigning cabins to offer additional legroom in business class. Furthermore, airlines are integrating advanced amenities such as in-flight entertainment, Internet connectivity, adjustable seats, and ambient lighting in premium economy class, mirroring the offerings in business class. This approach enables airlines to optimize revenue and cater to the evolving preferences of passengers. Thus, such factors are driving the growth of the market during the forecast period.
What are the market trends shaping the Aircraft Switches Market?
Rising demand for in-flight entertainment and connectivity (IFEC) is the upcoming trend in the market.
- The aviation sector is witnessing a significant shift towards advanced in-flight entertainment and connectivity (IFEC) systems, fueled by the increasing preference for personalized entertainment options and real-time data access. This trend is leading to an increased demand for sophisticated electrical and electronic switches in aircraft cockpits and dashboards. For example, AirAsia India recently collaborated with Sugarbox to offer Wi-Fi services on all their aircraft, while Southwest Airlines opted for Anuvus inflight connectivity services, enabling passengers with features like in-flight payment, live TV, and messaging apps. These advancements underscore the importance of reliable, efficient, and user-friendly switches and buttons in aircraft, which will propel the market's expansion during the forecast period.
What challenges does Aircraft Switches Market face during the growth?
Stringent aviation regulations is a key challenge affecting the market growth.
- In The market, stringent regulations pose a substantial challenge for manufacturers. These regulations, aimed at ensuring safety and reliability, necessitate adherence to rigorous standards and certification processes. Compliance involves extensive testing, documentation, and quality assurance measures, which can be resource-intensive and costly. The continuous need for updates and modifications to meet evolving regulatory requirements can strain resources and impact production timelines. For smaller manufacturers, the financial burden of compliance may limit their competitive edge against larger, established companies.
- Navigating different regulatory frameworks across various regions further complicates matters, as manufacturers must customize their products to meet specific market requirements. The market encompasses electrical impulses that activate flight control actuators in commercial aircraft and general aviation aircraft. Digital fly-by-wire flight systems increasingly rely on digital airplane switches to transmit electrical signals.
Exclusive Customer Landscape
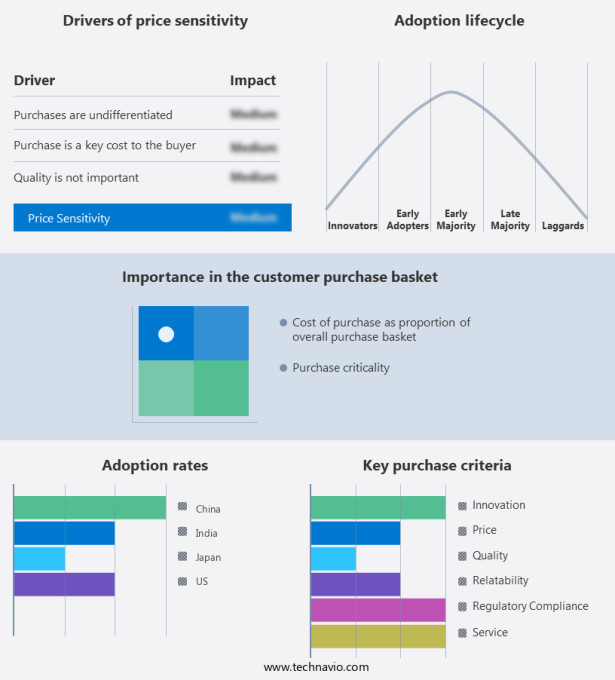
The market forecasting report includes the adoption lifecycle of the market, covering from the innovator's stage to the laggard's stage. It focuses on adoption rates in different regions based on penetration. Furthermore, the market report also includes key purchase criteria and drivers of price sensitivity to help companies evaluate and develop their market growth analysis strategies.
Customer Landscape
Key Companies & Market Insights
Companies are implementing various strategies, such as strategic alliances, market forecast, partnerships, mergers and acquisitions, geographical expansion, and product/service launches, to enhance their presence in the market. The market research and growth report includes detailed analyses of the competitive landscape of the market and information about key companies, including:
- AMETEK Inc.
- Barantec Inc.
- Curtiss Wright Corp.
- Eaton Corp plc
- General Electric Co.
- Honeywell International Inc.
- Hydra Electric Co.
- ITT Inc.
- Littelfuse Inc.
- Parker Hannifin Corp.
- RTX Corp.
- Safran SA
- TE Connectivity Ltd.
- TransDigm Group Inc.
Qualitative and quantitative analysis of companies has been conducted to help clients understand the wider business environment as well as the strengths and weaknesses of key market players. Data is qualitatively analyzed to categorize companies as pure play, category-focused, industry-focused, and diversified; it is quantitatively analyzed to categorize companies as dominant, leading, strong, tentative, and weak.
Research Analyst Overview
Aircraft switches play a crucial role in the aviation industry, enabling pilots and crew to manage various systems in the cockpit and cabin. These switches come in different forms, including toggle switches, push-button switches, and rocker switches, each designed to control specific functions. Advanced switch technology, such as touchscreen technology and voice control cabin management, is increasingly being adopted to enhance the human-machine interface (HMI) and improve automation. Aircraft deliveries continue to grow, driven by the demand for air travel and the production of commercial aircraft and business jets. Lightweight aircraft, UAVs, and electric and zero-emission aircraft are also gaining popularity, leading to the development of new switch technologies. Fly-by-wire systems, flight control systems, and inflight connectivity and entertainment are some of the key applications for aircraft switches. The market for aircraft switches is expected to grow significantly in the coming years, driven by the increasing demand for automation and the need for more efficient and reliable electrical switches. The market is also being influenced by factors such as airfare inflation, travel restrictions, and commercial aircraft production.
|
Market Scope |
|
|
Report Coverage |
Details |
|
Page number |
166 |
|
Base year |
2023 |
|
Historic period |
2018-2022 |
|
Forecast period |
2024-2028 |
|
Growth momentum & CAGR |
Accelerate at a CAGR of 3.4% |
|
Market growth 2024-2028 |
USD 388.2 million |
|
Market structure |
Concentrated |
|
YoY growth 2023-2024(%) |
3.3 |
|
Key countries |
US, China, Japan, and India |
|
Competitive landscape |
Leading Companies, Market Positioning of Companies, Competitive Strategies, and Industry Risks |
What are the Key Data Covered in this Market Research and Growth Report?
- CAGR of the market during the forecast period
- Detailed information on factors that will drive the market growth and forecasting between 2024 and 2028
- Precise estimation of the size of the market and its contribution of the market in focus to the parent market
- Accurate predictions about upcoming market growth and trends and changes in consumer behaviour
- Growth of the market across North America, Europe, APAC, South America, and Middle East and Africa
- Thorough analysis of the market's competitive landscape and detailed information about companies
- Comprehensive analysis of factors that will challenge the growth of market companies
We can help! Our analysts can customize this market research report to meet your requirements. Get in touch


