Algae Protein Market Size 2024-2028
The algae protein market size is forecast to increase by USD 162.2 million at a CAGR of 6.7% between 2023 and 2028.
- The market is experiencing significant growth due to the increasing demand for health-promoting foods and beverages. Consumers are increasingly seeking out naturally sourced health supplements due to increasing awareness of health and wellness, leading to a growth in interest in algae protein. This protein source, derived from various types of algae such as dulse, offers a nutritious profile rich in essential amino acids, antioxidants, and detoxifying properties. Moreover, the trend toward clean-label products is driving demand for algae protein, as it is free from synthetic additives and preservatives. Algae protein is also gaining popularity for its use as a functional food ingredient, providing additional health benefits beyond basic nutrition. For instance, it can be used as a meat alternative in vegetarian and vegan food products.
- However, scalability remains a challenge for the market, as cultivation methods and biotechnological processes require further optimization to meet increasing demand. Strict regulations regarding the production and use of algae protein also pose challenges for market growth. Despite these hurdles, the potential health benefits and versatility of algae protein make it an attractive option for the food and beverage industry.
What will be the Size of the Market During the Forecast Period?
- The market is witnessing significant growth due to the increasing demand for sustainable and plant-based protein sources. This trend is being driven by various factors, including the growing awareness of food sustainability, the rise of plant-based diets, and the advancements in nutritional science. Algae, a type of aquatic organism, is a rich source of protein, essential amino acids, and other nutrients. Microalgae, a subset of algae, is particularly noteworthy for its high protein content, which can range from 20% to 70% depending on the species. This makes algae an attractive alternative to traditional animal-derived protein sources. The food industry is increasingly exploring the use of algae protein in various applications.
- For instance, it can be used as a meat alternative in vegetarian and vegan food products. The versatility of algae protein is further highlighted by its use in mainstream beverages, healthy snacks, and functional ingredients. Moreover, the use of algae protein is not limited to the food industry alone. It also finds applications in biotechnology, where it is used for carbon sequestration, bioremediation, and the production of bioplastics and algae-based bioplastics. The sustainability aspect of algae protein production is another significant factor contributing to its growing popularity.
-
Algae can be grown in open ponds or closed systems using wastewater, making it a viable option for sustainable agriculture. Additionally, algae-based carbon sequestration can help mitigate greenhouse gas emissions, making it an environmentally friendly alternative. The nutritional benefits of algae protein are also noteworthy. It is a complete protein source, containing all essential amino acids. Furthermore, it is rich in omega-3 fatty acids, fiber, and various vitamins and minerals. This makes it an ideal choice for individuals following a plant-based diet or those looking to incorporate more healthy foods into their lifestyle. The future of the market looks promising, with ongoing research and innovation in the field.
-
For instance, there is ongoing research into the use of algae protein for weight loss and as a potential alternative to animal-derived protein in the production of bioplastics and cosmetics. In conclusion, the market is an emerging force in the global food industry, driven by the increasing demand for sustainable and plant-based protein sources. Its versatility, nutritional benefits, and sustainability make it an attractive alternative to traditional protein sources. The ongoing research and innovation in the field are expected to further expand its applications and market potential.
How is this market segmented and which is the largest segment?
The market research report provides comprehensive data (region-wise segment analysis), with forecasts and estimates in "USD million" for the period 2024-2028, as well as historical data from 2018-2022 for the following segments.
- Type
- Spirulina
- Chlorella
- Others
- Geography
- Europe
- France
- Spain
- North America
- Canada
- US
- APAC
- China
- South America
- Middle East and Africa
- Europe
By Type Insights
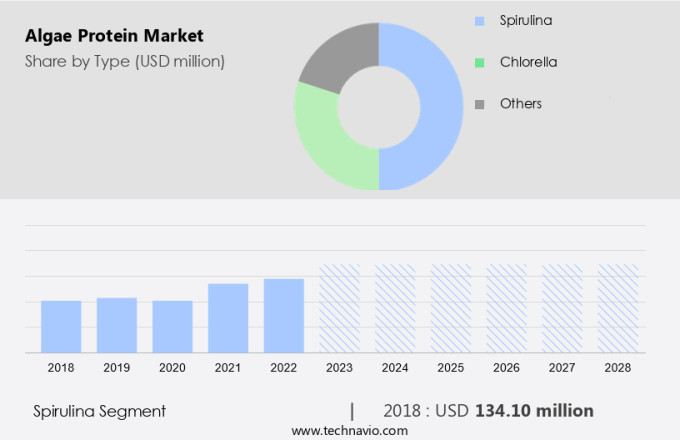
- The spirulina segment is estimated to witness significant growth during the forecast period.
Algae protein, specifically that derived from algae varieties such as dulse, has gained significant attention in the food industry due to its detoxifying properties and use as food additives. This protein source boasts a nutritional profile rich in essential amino acids, protein, vitamins, and minerals, making it an ideal ingredient for functional foods. Additionally, algae protein is a clean-label alternative to traditional protein sources, aligning with consumer preferences for natural and minimally processed options. Beyond food applications, algae protein is also utilized for biotechnological purposes due to its high antioxidant content. This versatile ingredient offers numerous health benefits, contributing to the growing demand for algae protein in various industries.
Moreover, the scalability of algae cultivation methods further supports its potential as a sustainable and cost-effective protein source. As consumer interest in functional foods and clean-label products continues to rise, the market for algae protein is poised for growth. This trend is expected to persist as more companies recognize the value of incorporating this nutrient-dense ingredient into their offerings. The health benefits of algae protein, including its detoxifying properties and antioxidant content, make it a valuable addition to a wide range of applications. In summary, algae protein, particularly from dulse and other varieties, offers numerous advantages as a functional food ingredient.
Its nutritional profile, scalability, and potential for use in detoxifying and antioxidant applications make it a promising alternative to traditional protein sources. The growing demand for clean-label products and functional foods is expected to drive the market for algae protein in the coming years.
Get a glance at the market report of share of various segments Request Free Sample
The spirulina segment was valued at USD 134.10 million in 2018 and showed a gradual increase during the forecast period.
Regional Analysis
- Europe is estimated to contribute 55% to the growth of the global market during the forecast period.
Technavio's analysts have elaborately explained the regional trends and drivers that shape the market during the forecast period.
For more insights on the market share of various regions Request Free Sample
The European market held the largest share in the global market in 2023, primarily driven by the food and personal care industries. Consumers' increasing preference for natural ingredients in cosmetics and personal care products due to health concerns will fuel the market's expansion in Europe. Moreover, the aquaculture sector in Europe has experienced substantial growth, particularly in countries like Norway, Denmark, and Ireland. This expansion is anticipated to boost the demand for algae proteins, such as blue-green algae and farmed seaweed, which are rich in nutrients like Omega-3 fatty acids and vitamin B12. These nutrients contribute to heart and nerve health, making algae proteins an attractive alternative to animal-derived proteins and processed food products.
Additionally, algae proteins are gaining popularity as a sustainable alternative in animal feed production, further increasing market potential. Despite the market's growth, challenges such as humidity and contamination issues must be addressed to ensure product quality and safety. Overall, the market presents significant opportunities for growth in Europe, particularly in the food, personal care, and animal feed industries.
Market Dynamics
Our researchers analyzed the data with 2023 as the base year, along with the key drivers, trends, and challenges. A holistic analysis of drivers will help companies refine their marketing strategies to gain a competitive advantage.
What are the key market drivers leading to the rise in adoption of Algae Protein Market?
Growing demand for nutritious food and beverages is the key driver of the market.
- The market is experiencing significant growth due to the increasing demand for nutrient-dense, functional food and beverage products. Algae cultivation, a key aspect of this industry, is being embraced by food and beverage manufacturers for its unique nutrient benefits and ability to be used in various applications, such as condiments, snacks, and customized dietary solutions. Biotechnology plays a crucial role in the efficient agricultural production of algae, enabling the creation of vitamin-rich and flavorful algae protein drinks. Functional food, including algae protein drinks, is anticipated to surpass the demand for traditional food items. The convenience offered by ready-to-drink variants of these functional drinks is a major factor driving their popularity among consumers.
- As a result, the market is poised for steady growth during the forecast period. Food technology continues to evolve, with algae protein drinks gaining traction as a popular and healthful alternative to traditional protein sources. These drinks, which contain chlorella components, offer numerous health benefits and a pleasant flavor. The global market for algae protein is expected to expand as consumers seek out more nutritious and functional food options.
What are the market trends shaping the Algae Protein Market?
Growing demand for naturally obtained health supplements is the upcoming trend in the market.
- Algae protein, a natural source of complete proteins, Omega-3 fatty acids, and antioxidants, is gaining popularity in the plant-based protein market. The increasing preference for sustainably sourced and vegetarian or vegan protein options is fueling the growth of this market. Algae strains are being utilized in various applications, such as energy bars, beverages, and plant-based meat alternatives, due to their desirable texture and yield.
- For instance, Vegetology, a leading health and beauty product innovator, offers Opti3, a vegetable-derived Omega-3 supplement made from microalgal particles. As consumer awareness and demand for plant-based supplements continue to rise, the market is poised for significant expansion. This trend aligns with the broader sustainability movement, as algae cultivation is considered a more eco-friendly alternative to traditional animal agriculture.
What challenges does Algae Protein Market face during the growth?
Stringent regulations regarding algae protein is a key challenge affecting market growth.
- Algae protein, derived from marine ecosystems, has gained significant attention due to its nutritional value and versatility in various industries. In the food sector, it serves as a valuable alternative to animal-derived proteins for vegan and environmentally aware consumers. In the personal care industry, algae protein is used in cosmetics and specialized technologies for anti-aging and other applications. Manufacturers of algae protein must adhere to stringent regulations imposed by regulatory authorities to ensure product safety and quality. In the US, the Food and Drug Administration (FDA) sets the standards, while in the European Union, it is the European Food Safety Authority (EFSA), and in India, the Food Safety and Standards Authority of India (FSSAI). These regulatory bodies establish guidelines for product labeling, import-export regulations, and product launches and expiry dates.
- Moreover, the production of algae protein involves sustainable cultivation methods, ensuring a minimal carbon footprint. In the supplements industry, algae protein is processed using advanced technologies to maintain its nutritional value. As the demand for plant-based proteins continues to grow, the market is expected to expand significantly. In conclusion, the market is a growing industry that caters to the nutritional needs of consumers in various sectors while prioritizing sustainability and regulatory compliance. The use of algae protein in food, personal care, and supplements is a testament to its versatility and potential as a viable alternative to animal-derived proteins.
Exclusive Customer Landscape
The market forecasting report includes the adoption lifecycle of the market, covering from the innovator's stage to the laggard's stage. It focuses on adoption rates in different regions based on penetration. Furthermore, the market report also includes key purchase criteria and drivers of price sensitivity to help companies evaluate and develop their market growth analysis strategies.
Customer Landscape
Key Companies & Market Insights
Companies are implementing various strategies, such as strategic alliances, market forecast, partnerships, mergers and acquisitions, geographical expansion, and product/service launches, to enhance their presence in the market.
The market research and growth report includes detailed analyses of the competitive landscape of the market and information about key companies, including:
- Corbion nv
- Cyanotech Corp.
- DIC Corp.
- Duplaco BV
- EID Parry India Ltd.
- ENERGYbits Inc.
- Far East Bio Tec Co. Ltd.
- Fuqing King Dnarmsa Spirulina Co. Ltd.
- JUNE Group of Companies
- Natures Power Nutraceuticals Corp.
- NOW Health Group Inc.
- Phycom BV
- Prolgae Spirulina Supplies Pvt. Ltd.
- Roquette Klotze GmbH and Co. KG
- Seagrass Tech Pvt. Ltd.
- Tianjin Norland Biotech Co. Ltd
- Triton Algae Innovations
- Vimergy LLC
- Yunnan Green A Biological Project Co. Ltd.
- Zhejiang Binmei Biotechnology Co. Ltd.
Qualitative and quantitative analysis of companies has been conducted to help clients understand the wider business environment as well as the strengths and weaknesses of key market players. Data is qualitatively analyzed to categorize companies as pure play, category-focused, industry-focused, and diversified; it is quantitatively analyzed to categorize companies as dominant, leading, strong, tentative, and weak.
Research Analyst Overview
Algae protein is a sustainable and complete protein source derived from various algae strains, including dulse, blue-green algae, and microalgae. This plant-based protein alternative offers a high nutritional profile with essential amino acids, minerals, vitamins, antioxidants, and healthy omega-3 fatty acids. Algae protein is gaining popularity due to its environmental benefits, as it requires less land, water, and energy compared to traditional animal farming. Algae protein is versatile and can be used in various food applications, such as energy bars, beverages, vegetarian and vegan meat alternatives, and functional foods. Its unique texture and nutrient-dense properties make it an ideal ingredient for creating nutritious and delicious snacks, shakes, and condiments.
Also, algae protein is also used in biodiversity-friendly cultivation methods, which contribute to the reduction of greenhouse gas emissions and the promotion of efficient agricultural production. The scalability of algae cultivation methods makes it a promising solution for meeting the increasing demand for plant-based protein sources. Algae protein-based products offer numerous health benefits, including improved energy levels, reduced fatigue, and support for the immune system. They are also suitable for individuals with allergies and intolerances to common food additives and processed food products.
Moreover, algae protein is used in various industries, such as food technology, cosmetics, and pharmaceuticals, for its unique properties and nutritional value. Its use in customized dietary solutions, supplements, and medications is expected to grow significantly in the coming years, making it a valuable ingredient for various applications.
|
Market Scope |
|
|
Report Coverage |
Details |
|
Page number |
166 |
|
Base year |
2023 |
|
Historic period |
2018-2022 |
|
Forecast period |
2024-2028 |
|
Growth momentum & CAGR |
Accelerate at a CAGR of 6.7% |
|
Market growth 2024-2028 |
USD 162.2 million |
|
Market structure |
Fragmented |
|
YoY growth 2023-2024(%) |
6.1 |
|
Key countries |
France, US, China, Ireland, Canada, and Spain |
|
Competitive landscape |
Leading Companies, Market Positioning of Companies, Competitive Strategies, and Industry Risks |
What are the Key Data Covered in this Market Research and Growth Report?
- CAGR of the market during the forecast period
- Detailed information on factors that will drive the market growth and forecasting between 2024 and 2028
- Precise estimation of the size of the market and its contribution of the market in focus to the parent market
- Accurate predictions about upcoming market growth and trends and changes in consumer behaviour
- Growth of the market across Europe, North America, APAC, South America, and Middle East and Africa
- Thorough analysis of the market's competitive landscape and detailed information about companies
- Comprehensive analysis of factors that will challenge the growth of market companies
We can help! Our analysts can customize this market research report to meet your requirements. Get in touch


