
All-Flash Array Market Size 2025-2029
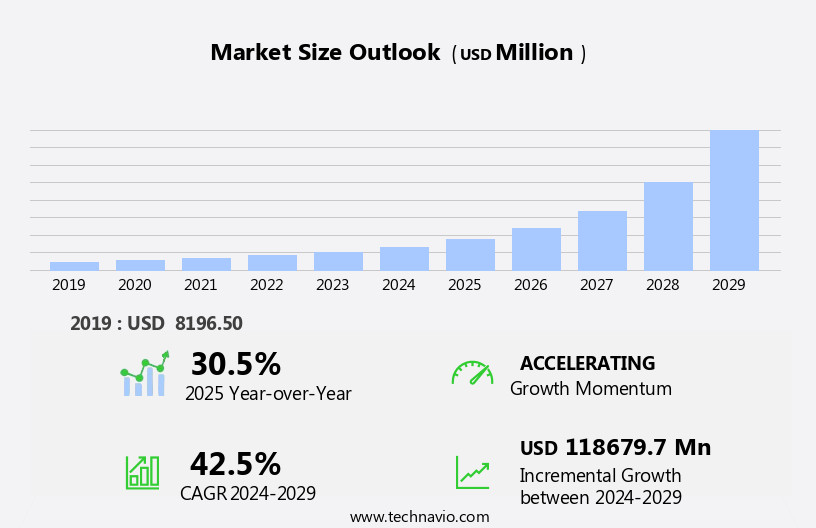
The all-flash array (AFA) market size is forecast to increase by USD 118.68 billion at a CAGR of 42.5% between 2024 and 2029.
- The market is witnessing significant growth due to the expanding market and the increasing demand for high-performance storage solutions. Businesses are seeking faster data access and improved application performance, leading to the adoption of AFAs. The market is increasingly leveraging predictive analytics and virtual desktop infrastructure (VDI) to enhance data storage performance, optimize resource allocation, and support seamless, scalable IT environments for businesses. However, challenges persist, including the need for higher reliability and data protection in AFAs to mitigate potential data loss. These factors, along with advancements in flash memory technology and data compression techniques, are shaping the future of the AFA market. As organizations continue to prioritize digital transformation and data-driven decision making, the demand for AFAs is expected to remain strong.
What will be the Size of the All-Flash Array (AFA) Market During the Forecast Period?
- The market continues to gain momentum in the data center landscape, driven by the insatiable demand for faster data access and processing. AFAs, which replace traditional spinning media with solid-state drives, offer significant advantages such as reduced power consumption, cooling requirements, and physical space. These benefits are particularly valuable for enterprise applications, including real-time analytics, database systems, and cloud technology, where the need for flexibility, transactions, and low-latency performance is paramount. The AFAs' ability to handle big data and deliver high IOPS (input/output operations per second) makes them an ideal solution for various use cases. The market's growth is further fueled by advancements in multi-level and single-cell flash technologies, wear-resistance, and features like replication, snapshots, and reduplication.
- The AFAs' cooling quotient and power efficiency enable organizations to manage their data more effectively while minimizing environmental impact.
How is this All-Flash Array (AFA) Industry segmented and which is the largest segment?
The industry research report provides comprehensive data (region-wise segment analysis), with forecasts and estimates in "USD million" for the period 2025-2029, as well as historical data from 2019-2023 for the following segments.
- Type
- Solid-state drives (SSD)
- Custom flash modules (CFM)
- End-user
- Enterprises
- HDCs
- CSPs
- Application
- Traditional all-flash arrays
- Hybrid all-flash arrays
- Others
- Component
- Block
- Files
- Object
- Geography
- North America
- Canada
- US
- APAC
- China
- India
- Japan
- South Korea
- Europe
- Germany
- UK
- France
- Italy
- South America
- Middle East and Africa
- North America
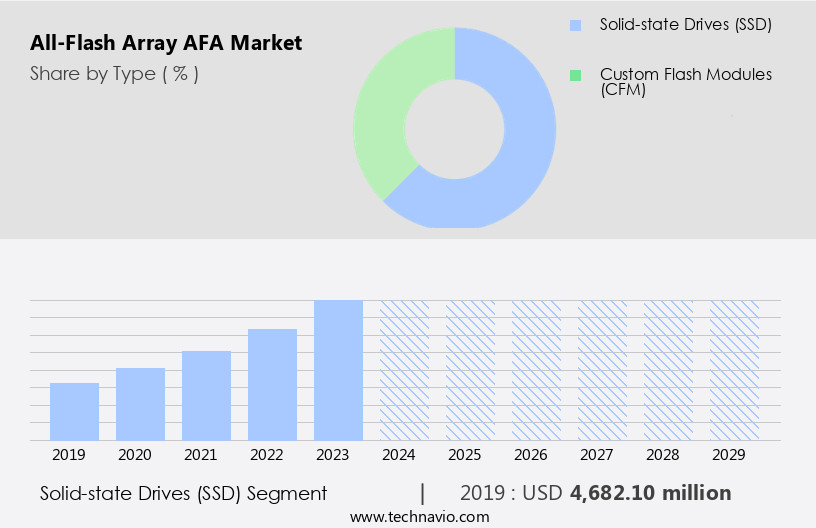
By Type Insights
- The solid-state drives (SSD) segment is estimated to witness significant growth during the forecast period. All-Flash Arrays (AFAs), a type of storage technology, have gained significant traction in data centers due to their efficiency, performance, and scalability. AFAs, which use solid-state drives (SSDs) instead of traditional hard disk drives (HDDs), offer several advantages, including flexibility, real-time transactions, and management simplicity. AFAs consume less physical space, power, and cooling compared to HDDs, making them ideal for enterprise applications. They provide built-in data protection, multi-level flash, and single-cell flash for enhanced wear-resistance. Cloud technology, Big data, and real-time analytics are prominent drivers for the market.
- AFAs are suitable for various industries, including healthcare, insurance, telecommunications, media industries, and cyber vaults, where data security and quick access are crucial. They offer application performance improvements, modular architecture, and low heat dissipation. Despite being costlier than HDDs, AFAs offer higher efficiency, performance, and cyber resilience, making them a preferred choice for Enterprise, Cloud computing, and localization. AFAs provide snapshots, replication, and reduplication for data protection and disaster recovery. They offer a non-volatile structure, ensuring data persistence during power failures. With their advantages, AFAs are expected to continue their growth trajectory in the forecast period.
Get a glance at the market report of share of various segments Request Free Sample
The Solid-state drives (SSD) segment was valued at USD 4.68 billion in 2019 and showed a gradual increase during the forecast period.
Regional Analysis
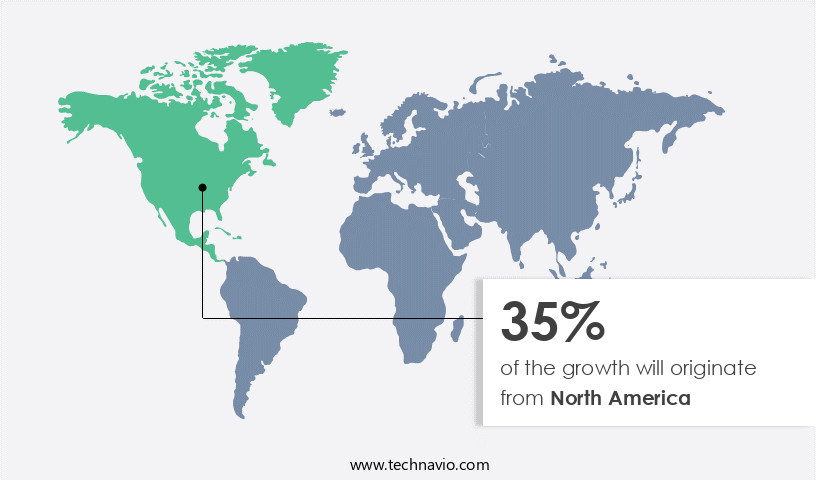
- North America is estimated to contribute 35% to the growth of the global market during the forecast period. Technavio's analysts have elaborately explained the regional trends and drivers that shape the market during the forecast period. The market in North America is projected to expand due to the region's prominence in data center technologies and the presence of numerous data centers, particularly in the US. Notable developments, such as Dell Technologies and Microsoft's collaboration to offer Oracle Database services on Oracle Cloud Infrastructure within Microsoft Azure datacenters, underline the market's potential for growth. The adoption of containerized data centers is also more prevalent in North America than in other regions.
For more insights on the market size of various regions, Request Free Sample
Key drivers for the AFA market include flexibility, efficiency, performance, and scalability. These benefits are crucial for enterprise applications in various industries, including data centers for healthcare, insurance, telecommunications, and media industries. AFA's built-in data protection, management simplicity, and real-time capabilities are essential for handling transactions and real-time analytics in database systems. Modern storage technologies, such as solid state drives (SSDs), multi-level flash, and single-cell flash, offer wear-resistance and high-performance storage solutions. AFA's non-volatile structure and power consumption efficiency make it a preferred choice for enterprise applications. The market's opponents include traditional hard disk drives and standard disks, which are costlier to operate and require more physical space, power, and cooling. Cloud technology, including Cloud computing and hybrid cloud services, is a significant trend in the market.
Market Dynamics
Our researchers analyzed the data with 2024 as the base year, along with the key drivers, trends, and challenges. A holistic analysis of drivers will help companies refine their marketing strategies to gain a competitive advantage.
What are the key market drivers leading to the rise in the adoption of All-Flash Array (AFA) Industry?
- The growing enterprise storage market is the key driver of the market. The market has experienced significant growth due to the increasing demand for efficient storage infrastructure to manage the expanding digital data generated by businesses worldwide. Enterprises in various sectors, including banking, financial services and insurance (BFSI), healthcare, manufacturing, and retail, require advanced storage solutions to process their data in real-time for enterprise applications. These data centers, located on-premises or off-campus, house large volumes of data from B2B and B2C activities. Innovations in AFA technology have led to the development of high-performance, scalable, and flexible storage solutions. Companies like Violin Memory and Pure Storage have taken leading positions in the market with their offerings that cater to the diverse needs of businesses.
- These solutions offer management simplicity, built-in data protection, and efficiency, making them an attractive choice for enterprises. Despite their costlier nature compared to traditional hard disk drives, AFAs provide several advantages, such as lower power consumption, minimal heat dissipation, and faster data access. They also support real-time analytics, database systems, and transaction-intensive applications, making them essential for industries like healthcare, insurance, telecommunications, media, and cybersecurity. Moreover, the adoption of cloud technology and hybrid cloud services has further fueled the demand for AFAs, as they offer cyber resilience and application performance. With their modular architecture and non-volatile structure, these storage technologies ensure data protection during power failures and enable data recovery through features like replication, snapshots, reduplication, and solid state drives with multi-level and single-cell flash technology.
What are the market trends shaping the All-Flash Array (AFA) Industry?
- Increasing demand for high-performance storage solutions is the upcoming market trend. The market is experiencing significant growth due to the increasing demand for high-performance storage systems in handling big data and real-time analytics applications. Enterprise flash storage offers superior performance compared to traditional storage systems, enabling swift data access, retrieval, and analysis. This efficiency is crucial for managing large volumes of data in real time, as flash storage delivers high Input/Output Operations Per Second (IOPS) and low latency. Moreover, the ability to manage multiple workloads concurrently and maintain consistent performance adds to the efficiency of big data processing. Key storage technologies, such as Violin Memory and Pure Storage, have established a leading position in the market.
- The non-volatile structure of flash storage ensures data persistence during power failures, providing an added layer of data protection. Despite being costlier than hard disk drives, the benefits of AFA, including management simplicity, scalability, and built-in data protection, make it an attractive choice for data centers requiring high transaction processing and real-time analytics. The market dynamics are further influenced by the adoption of cloud technology, the media industries, healthcare, insurance, and telecommunications sectors, and the need for cyber resilience against ransomware and other cyber threats.
What challenges does the All-Flash Array (AFA) Industry face during its growth?
- Issues related to the reliability of all-flash arrays is a key challenge affecting the industry growth. All-Flash Arrays (AFAs) have gained significant traction in data centers due to their efficiency, performance, and scalability. AFAs, which utilize solid-state drives (SSDs) instead of traditional hard disk drives, offer real-time transactions and low latency for enterprise applications. Companies like Violin Memory and Pure Storage hold leading positions in this market. AFAs require less physical space, power, and cooling compared to traditional storage technologies. However, their non-volatile structure necessitates careful management to ensure data integrity and prevent data loss during power failures. Built-in data protection features, such as replication, snapshots, and reduplication, are essential. The flexibility of AFAs makes them suitable for various industries, including media, healthcare, insurance, telecommunications, and cloud technology.
- Cloud computing, big data, real-time analytics, and database systems are prominent drivers for the AFA market. Despite being costlier than standard disks, AFAs offer several advantages, including application performance, cyber resilience, and modular architecture with low heat dissipation. As the demand for high-performance storage grows, opponents of AFAs, such as spinning media, will face increasing competition. In summary, the AFA market is driven by the need for high-performance, efficient, and scalable storage solutions in various industries. Companies must focus on creating reliable tunnel oxide processes and effective algorithms to overcome the challenges of flash storage's limited write cycles and ensure the long-term success of AFA technology.
Exclusive Customer Landscape
The market forecasting report includes the adoption lifecycle of the market, covering from the innovator's stage to the laggard's stage. It focuses on adoption rates in different regions based on penetration. Furthermore, the market report also includes key purchase criteria and drivers of price sensitivity to help companies evaluate and develop their market growth analysis strategies.

Customer Landscape
Key Companies & Market Insights
Companies are implementing various strategies, such as strategic alliances, market forecast, partnerships, mergers and acquisitions, geographical expansion, and product/service launches, to enhance their presence In the industry.
Dell Technologies Inc: The company offers all-flash arrays such as Dell PowerMax NVMe, Dell PowerStore, and Dell EMC Unity XT.
The industry research and growth report includes detailed analyses of the competitive landscape of the market and information about key companies, including:
- CMS Distribution
- DataDirect Networks Inc.
- Dell Technologies Inc.
- Fujitsu Ltd.
- Hewlett Packard Enterprise Co.
- Hitachi Ltd.
- Huawei Technologies Co. Ltd.
- International Business Machines Corp.
- ionir inc.
- Lenovo Group Ltd.
- MacroSAN Technology Co. Ltd.
- Micron Technology Inc.
- NetApp Inc.
- Nutanix Inc.
- Oracle Corp.
- Pure Storage Inc.
- Quantum Corp.
- Veritas Technologies LLC
- VIOLIN Systems LLC
- Western Digital Corp.
Qualitative and quantitative analysis of companies has been conducted to help clients understand the wider business environment as well as the strengths and weaknesses of key industry players. Data is qualitatively analyzed to categorize companies as pure play, category-focused, industry-focused, and diversified; it is quantitatively analyzed to categorize companies as dominant, leading, strong, tentative, and weak.
Research Analyst Overview
All-flash arrays (AFAs) have emerged as a significant storage technology in data centers, offering numerous benefits for enterprise organizations. These systems utilize flash memory instead of traditional spinning media, such as hard disk drives, to deliver high-performance, low-latency storage for various applications. One of the key advantages of AFAs is their flexibility. They can be deployed in various environments, from on-premises data centers to cloud computing infrastructures. This versatility allows businesses to optimize their storage solutions based on their specific requirements and use cases. AFAs provide significant improvements in efficiency and performance compared to traditional storage systems. They consume less power and generate less heat, which is essential for data centers with limited physical space and cooling capacity.
Moreover, AFAs offer real-time transaction processing capabilities, making them suitable for applications that demand high IOPS (input/output operations per second) and low latency. Scalability is another crucial factor that sets AFAs apart from traditional storage systems. These arrays can be easily scaled up or out to accommodate growing data needs, ensuring that businesses can keep up with their storage demands without having to replace their entire storage infrastructure. Management simplicity is another significant advantage of AFAs. They come with built-in data protection features, such as replication, snapshots, and reduplication, which simplify data backup and recovery processes. Additionally, AFAs offer modular architecture, enabling easy upgrades and maintenance, further reducing the overall management burden.
Furthermore, AFAs have gained a leading position in the market due to their numerous benefits. They are particularly popular in industries that require real-time analytics, such as database systems, healthcare, insurance, telecommunications, media industries, and cyber vaults. These industries rely on AFAs to process large volumes of data in real-time, ensuring optimal application performance and cyber resilience. Despite their advantages, AFAs are more costly than traditional storage systems. However, their efficiency, performance, and scalability make them a worthwhile investment for businesses that require high-performance storage solutions. Moreover, the ongoing advancements in flash storage technologies, such as multi-level flash, single-cell flash, and wear-resistance, are driving down the costs of AFAs, making them more accessible to a broader range of organizations.
|
Market Scope |
|
|
Report Coverage |
Details |
|
Page number |
234 |
|
Base year |
2024 |
|
Historic period |
2019-2023 |
|
Forecast period |
2025-2029 |
|
Growth momentum & CAGR |
Accelerate at a CAGR of 42.5% |
|
Market growth 2025-2029 |
USD 118.68 billion |
|
Market structure |
Fragmented |
|
YoY growth 2024-2025(%) |
30.5 |
|
Key countries |
US, China, UK, Japan, Canada, India, Germany, France, South Korea, and Italy |
|
Competitive landscape |
Leading Companies, Market Positioning of Companies, Competitive Strategies, and Industry Risks |
What are the Key Data Covered in this All-Flash Array (AFA) Market Research and Growth Report?
- CAGR of the All-Flash Array (AFA) industry during the forecast period
- Detailed information on factors that will drive the market growth and forecasting between 2025 and 2029
- Precise estimation of the size of the market and its contribution of the industry in focus to the parent market
- Accurate predictions about upcoming growth and trends and changes in consumer behaviour
- Growth of the market across North America, APAC, Europe, South America, and Middle East and Africa
- Thorough analysis of the market's competitive landscape and detailed information about companies
- Comprehensive analysis of factors that will challenge the all-flash array (AFA) market growth of industry companies
We can help! Our analysts can customize this all-flash array (AFA) market research report to meet your requirements.