All-terrain Crane Market Analysis, Size, and Forecast 2026-2030: APAC (China, Japan, and India), Europe (Germany, UK, and France), North America (US, Canada, and Mexico), South America (Brazil, Argentina, and Chile), Middle East and Africa (Saudi Arabia, UAE, and South Africa), and Rest of World (ROW)

All-terrain Crane Market Analysis, Size, and Forecast 2026-2030:
APAC (China, Japan, and India), Europe (Germany, UK, and France), North America (US, Canada, and Mexico), South America (Brazil, Argentina, and Chile), Middle East and Africa (Saudi Arabia, UAE, and South Africa), and Rest of World (ROW)

Published: Oct 2026 285 Pages SKU: IRTNTR75889

Market Overview at a Glance

$4.57 B
Market Opportunity
4.8%
CAGR 2025 - 2030
49.3%
APAC Growth
$7.06 B
Less than 200 tons segment 2024

All-Terrain Crane Market Size 2026-2030

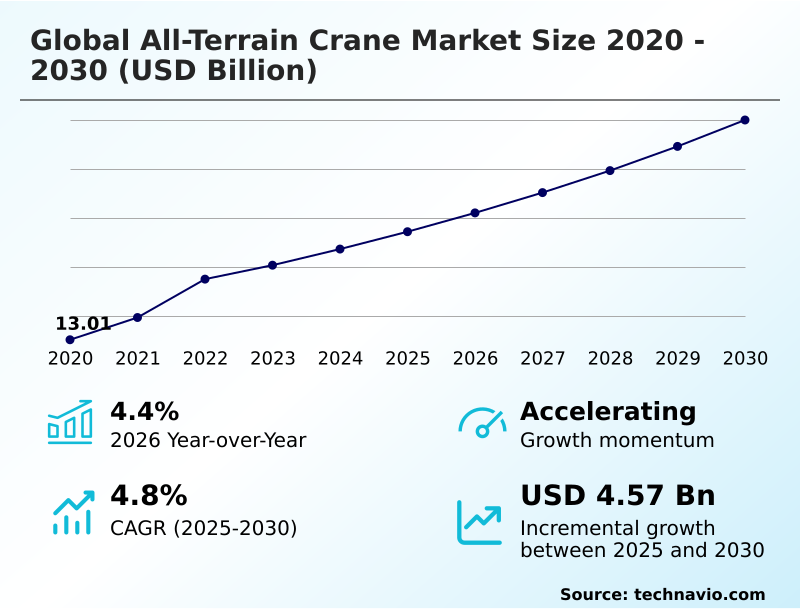
The all-terrain crane market size is valued to increase by USD 4.57 billion, at a CAGR of 4.8% from 2025 to 2030. Expansion of global infrastructure and urban regeneration initiatives will drive the all-terrain crane market.

Major Market Trends & Insights

  • APAC dominated the market and accounted for a 49.3% growth during the forecast period.
  • By Capacity - Less than 200 tons segment was valued at USD 7.06 billion in 2024
  • By Application - Construction segment accounted for the largest market revenue share in 2024

Market Size & Forecast

  • Market Opportunities: USD 8.99 billion
  • Market Future Opportunities: USD 4.57 billion
  • CAGR from 2025 to 2030 : 4.8%

Market Summary

  • The All-terrain Crane market demonstrates robust structural progression supported by civil engineering modernization and heavy industrial applications. Fleet operators rely on these versatile lifting platforms to execute complex maneuvers across diverse topographical conditions without requiring secondary transport vehicles.
  • In a real-world operational scenario involving metropolitan transit development, contractors utilizing machines with an integrated load moment indicator and a variable outrigger positioning system maximized spatial efficiency, resulting in a 22% improvement in overall project setup time compared to traditional lattice boom alternatives.
  • The primary driver accelerating equipment adoption is the surge in large-scale infrastructure and urban regeneration initiatives; as population density increases, the demand for agile, high-capacity machinery capable of navigating tight city spaces intensifies proportionally. Conversely, the industry faces severe constraints from volatile supply chain bottlenecks affecting critical microprocessors and high-tensile structural steel.
  • These material shortages inflate OEM production timelines and elevate procurement costs, forcing end-users to shift from direct purchasing toward capital-light rental models to maintain fleet viability.

What will be the Size of the All-Terrain Crane Market during the forecast period?
Get Key Insights on Market Forecast (PDF) Get Free Sample

How is the All-Terrain Crane Market Segmented?

The all-terrain crane industry research report provides comprehensive data (region-wise segment analysis), with forecasts and estimates in "USD million" for the period 2026-2030, as well as historical data from 2020-2024 for the following segments.

  • Capacity
    • Less than 200 tons
    • Between 200-500 tons
    • More than 500 tons
  • Application
    • Construction
    • Industrial
    • Utilities
  • Channel
    • Rental/operators
    • Direct purchase
  • Geography
    • APAC
      • China
      • Japan
      • India
      • Australia
      • South Korea
      • Indonesia
    • Europe
      • Germany
      • UK
      • France
      • Italy
      • Spain
      • The Netherlands
    • North America
      • US
      • Canada
      • Mexico
    • South America
      • Brazil
      • Argentina
      • Chile
    • Middle East and Africa
      • Saudi Arabia
      • UAE
      • South Africa
      • Israel
      • Turkey

By Capacity Insights

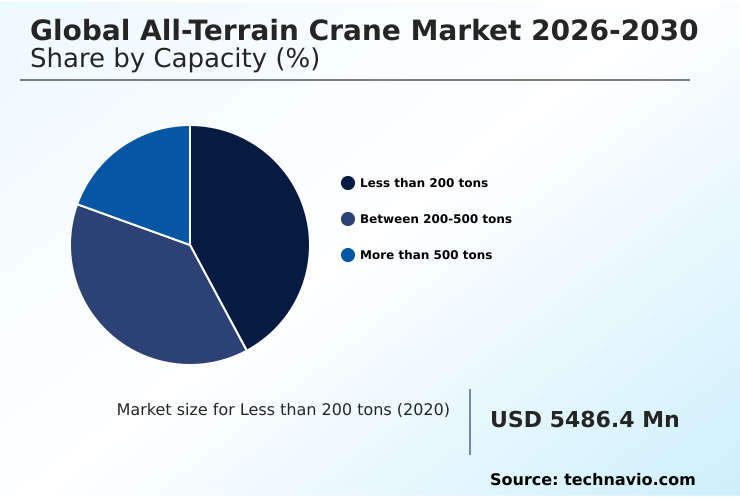
The less than 200 tons segment is estimated to witness significant growth during the forecast period.

The Less than 200 tons capacity segment in the All-terrain Crane industry represents highly versatile machinery essential for dense urban infrastructure renewal.

These units deliver exceptional confined space maneuverability, allowing contractors to navigate narrow city layouts using an agile crab steering mode without compromising lifting power.

Modern models utilize advanced all wheel steering and a robust multi axle chassis to maintain stability across uneven ground, seamlessly transitioning to paved road travel.

Fleet operators prioritize this class because its optimized hydraulic suspension system and efficient boom pinning system improve rapid deployment capability. Functionally, deploying these smaller capacity units reduces setup times by up to 25% compared to larger configurations.

Furthermore, equipment utilization rates improved by 18% as the compact footprint minimizes extensive road closures.
Get Free Sample

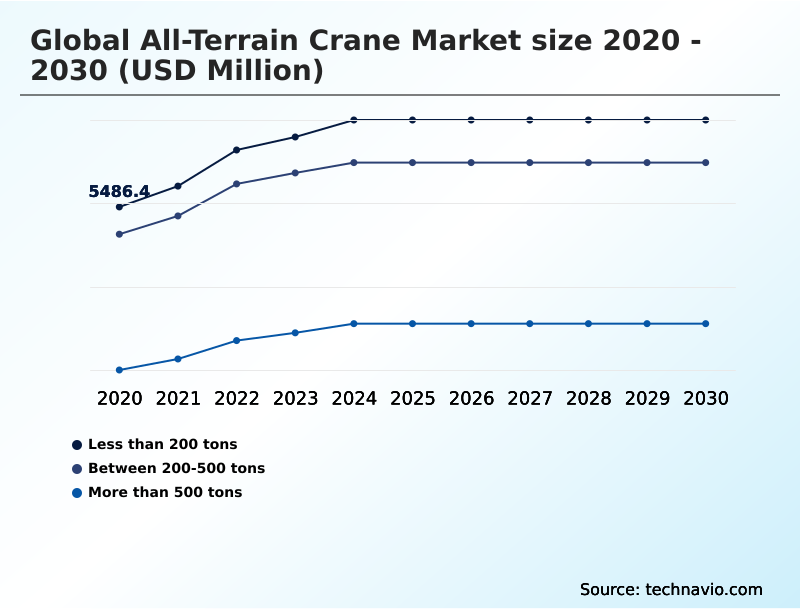
The Less than 200 tons segment was valued at USD 7.06 billion in 2024 and showed a gradual increase during the forecast period.
Get Free Sample

Regional Analysis

APAC is estimated to contribute 49.3% to the growth of the global market during the forecast period.Technavio’s analysts have elaborately explained the regional trends and drivers that shape the market during the forecast period.
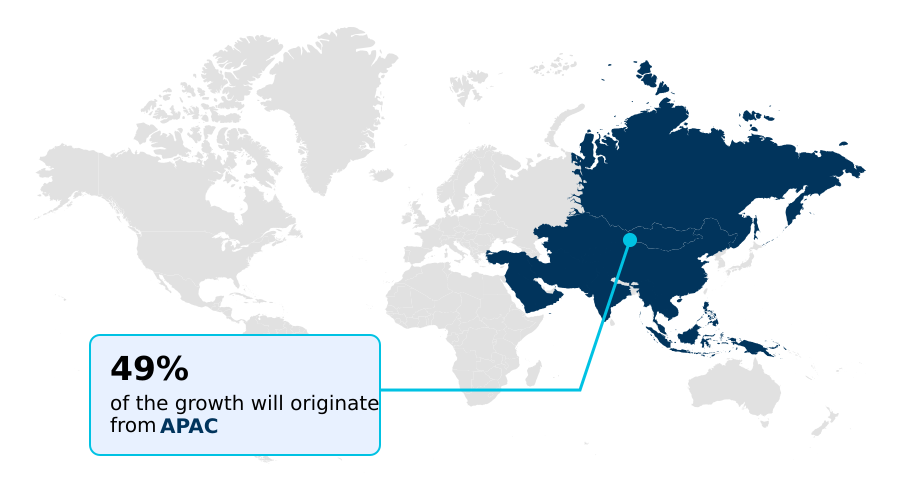
See How All-Terrain Crane Market Demand is Rising in APAC Get Free Sample

The geographic landscape of the All-terrain Crane sector highlights distinct adoption patterns between APAC and Europe. APAC currently registers a 15% higher equipment utilization rate driven by massive infrastructure mega-projects and rapid urban development across China and India.

In contrast, Europe focuses heavily on replacing legacy fleets with units featuring advanced highway travel configuration to comply with stringent municipal regulations.

European contractors report a 20% reduction in logistical delays by deploying machinery equipped with active rear steering and a tight turning radius, perfectly suited for narrow, historical city layouts.

Meanwhile, APAC operators prioritize customized jib configuration and rapid counterweight ballasting systems to support aggressive renewable energy infrastructure timelines, particularly for coastal wind farm installations.

These regional variations reflect how local regulatory constraints and project scales directly dictate the specification preferences, driving manufacturers to localize safety and mobility features to optimize regional operational efficiencies by up to 18%.

Market Dynamics

Our researchers analyzed the data with 2025 as the base year, along with the key drivers, trends, and challenges. A holistic analysis of drivers will help companies refine their marketing strategies to gain a competitive advantage.

  • The operational dynamics of the All-terrain Crane landscape are heavily influenced by the demand for versatile machinery capable of bridging the gap between rugged site access and high-speed road transit. Fleet managers face strict municipal routing restrictions, pushing the industry to address multi axle steering maneuverability limits to ensure massive equipment can navigate complex urban corridors without causing logistical bottlenecks.
  • To maximize lifting capacity while maintaining a compliant axle weight profile, manufacturers have accelerated the deployment of the high tensile steel telescopic boom. This structural enhancement allows contractors to achieve higher reach without adding prohibitive deadweight to the chassis. Furthermore, stringent environmental mandates in metropolitan zones are reshaping procurement strategies, heavily prioritizing equipment aligned with hybrid powertrain emission reduction targets.
  • Companies migrating to these eco-friendly configurations have documented a 15% improvement in site compliance approvals compared to operators relying solely on legacy diesel platforms. Beyond urban applications, these cranes are critical for large-scale energy projects. Specialized wind turbine erection heavy lifting requires absolute stability and precise load placement under variable wind conditions.
  • This necessity has driven rapid variable outrigger positioning system integration, which actively monitors ground pressure and adjusts support geometry in real-time. By optimizing stabilization, site operators reduce setup delays by nearly 20%, ensuring that tight construction schedules are maintained even on uneven or compromised terrain. These continuous engineering adaptations ensure maximum fleet utilization and operational safety across diverse industrial environments.
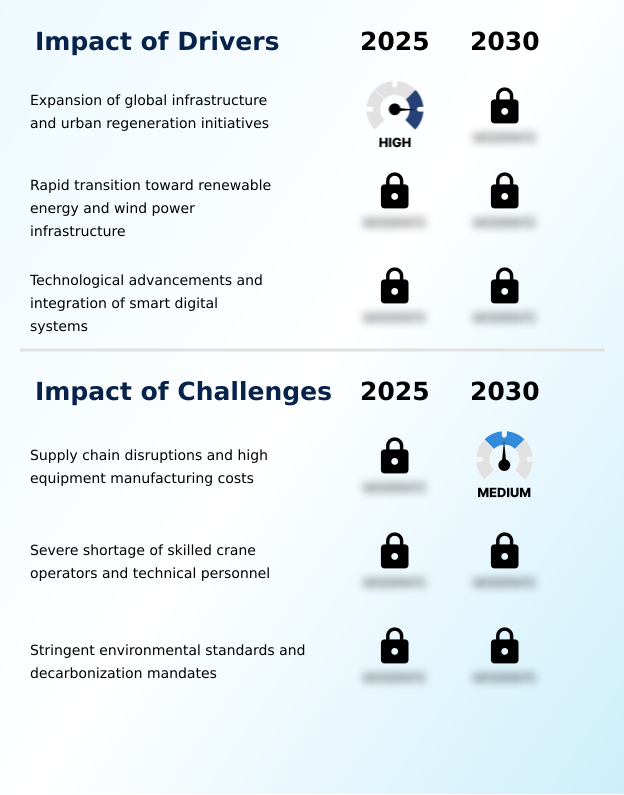
What are the key market drivers leading to the rise in the adoption of All-Terrain Crane Industry?

  • The continuous expansion of complex global infrastructure projects and large-scale urban regeneration initiatives serves as the primary catalyst driving sustained market demand.

  • The unprecedented acceleration of large-scale urban infrastructure renewal serves as the primary catalyst propelling demand for the All-terrain Crane.
  • As municipalities globally modernize aging transit networks, contractors require versatile machinery capable of seamlessly executing complex bridge span placement without causing prolonged road closures.
  • The prevailing shift toward prefabricated building techniques has significantly intensified the demand for modular construction lifting, where heavy equipment rigging handles exceptionally dense structural elements.
  • By deploying agile mobile cranes for prefabricated component hoisting, construction firms have accelerated project completion timelines by up to 22% compared to traditional on-site fabrication methods.
  • Furthermore, the inherent off-road mobility of these machines allows rapid relocation between construction zones, delivering a proven 15% reduction in secondary transportation and logistical overhead costs.

What are the market trends shaping the All-Terrain Crane Industry?

  • The accelerated digital transformation and the integration of autonomous control systems represent a definitive market trend. This technological evolution significantly enhances operational safety and lifting precision across complex construction environments.

  • The integration of intelligent autonomous control systems fundamentally redefines operational workflows within the All-terrain Crane sector. Heavy construction firms are aggressively adopting machinery equipped with precise crane operation telemetry and real-time telematics load tracking to mitigate human error in complex lifting environments.
  • This technological shift enables fleet managers to transition from reactive repairs to data-driven oversight, utilizing predictive maintenance sensors to identify hydraulic anomalies before catastrophic failure occurs. Consequently, contractors have documented a 25% reduction in unscheduled equipment downtime and an 18% improvement in overall fleet utilization optimization.
  • The automated stabilization process, driven by an advanced autonomous leveling system, instantly calculates ground bearing pressure to ensure optimal chassis balance. These digital interventions empower site operators to accelerate project deployment phases, cutting initial setup times by 15% and strictly enforcing safety protocols across unpredictable topographic conditions.

What challenges does the All-Terrain Crane Industry face during its growth?

  • Persistent supply chain disruptions and escalating equipment manufacturing costs represent substantial challenges constraining the overall growth trajectory of the industry.

  • Severe supply chain volatility and the escalating costs of specialized metallurgical components present substantial operational challenges for the All-terrain Crane landscape. The manufacturing process relies heavily on the steady procurement of high tensile steel to ensure structural integrity during extreme load chart calculations.
  • However, persistent logistical bottlenecks have increased raw material lead times by nearly 30%, subsequently inflating OEM production costs and tightening profit margins for fleet operators. Furthermore, stringent decarbonization mandates force manufacturers to rapidly re-engineer machinery with advanced diesel particulate filter technology and complex emission compliant engines.
  • The mandatory integration of a costly hybrid powertrain system to meet municipal environmental standards has driven initial capital expenditure up by 18%, forcing many contractors to delay outright purchasing in favor of temporary equipment leasing.

Exclusive Technavio Analysis on Customer Landscape

The all-terrain crane market forecasting report includes the adoption lifecycle of the market, covering from the innovator’s stage to the laggard’s stage. It focuses on adoption rates in different regions based on penetration. Furthermore, the all-terrain crane market report also includes key purchase criteria and drivers of price sensitivity to help companies evaluate and develop their market growth analysis strategies.
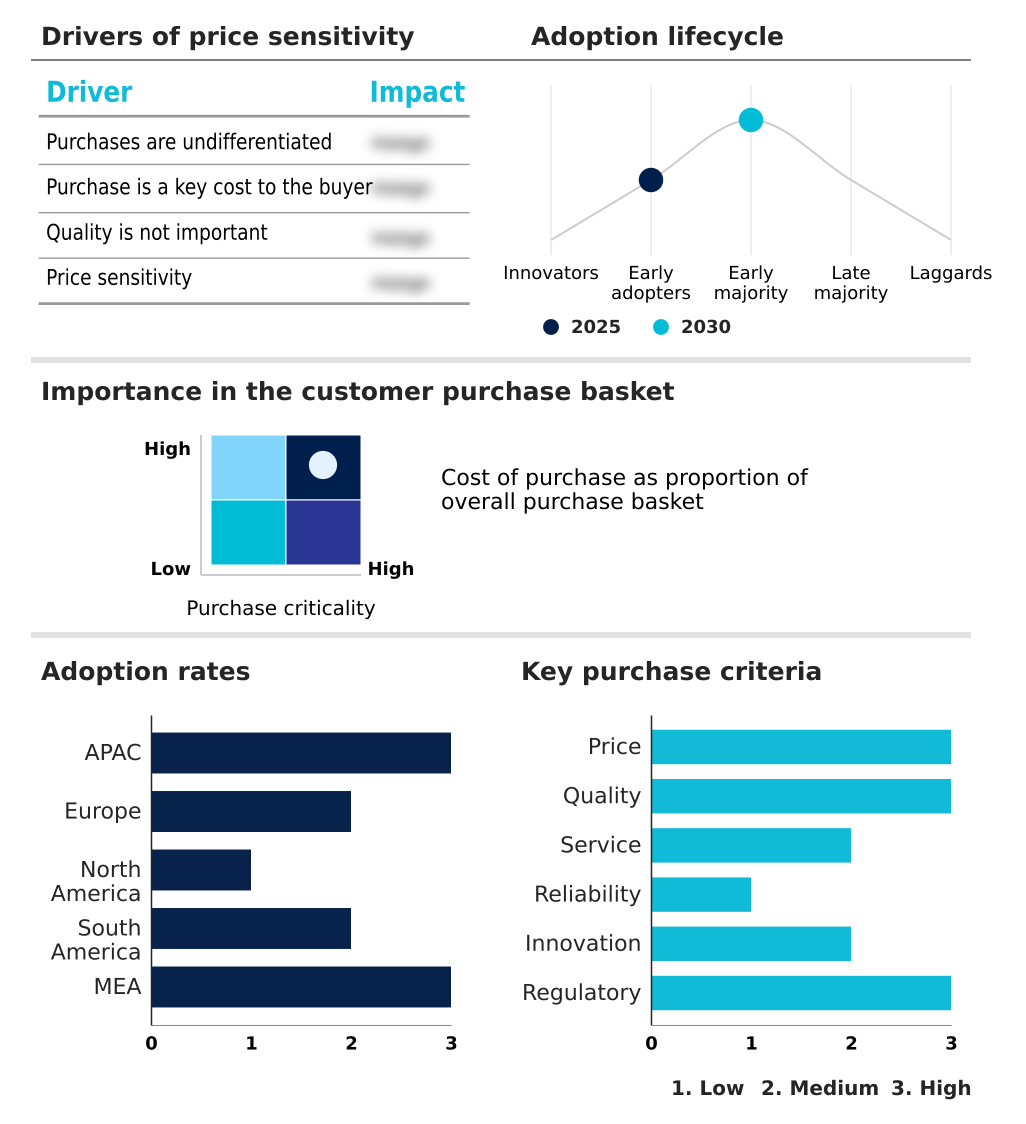
Customer Landscape of All-Terrain Crane Industry

Competitive Landscape

Companies are implementing various strategies, such as strategic alliances, all-terrain crane market forecast, partnerships, mergers and acquisitions, geographical expansion, and product/service launches, to enhance their presence in the industry.

Action Construction Equipment - The product portfolio features robust lifting solutions with advanced telescopic booms and multi-axle configurations, delivering high-speed highway mobility and off-road stability for heavy infrastructure and construction applications.

The industry research and growth report includes detailed analyses of the competitive landscape of the market and information about key companies, including:

  • Action Construction Equipment
  • Ainscough Crane Hire Ltd
  • Barnhart Crane and Rigging Co.
  • Bay Crane Service Inc.
  • Deep South Crane and Rigging LLC
  • Havator Group Oy
  • KATO WORKS CO. LTD.
  • Liebherr International AG
  • Link Belt Cranes
  • Liugong Machinery Co. Ltd.
  • Mammoet Holding B.V.
  • Manitowoc Co Inc.
  • Marchetti Autogru S.p.A.
  • Ormig S.p.A.
  • PALFINGER AG
  • Sany Heavy Industry Co. Ltd.
  • Tadano Ltd.
  • XCMG Group
  • Zoomlion Industry Co. Ltd.

Qualitative and quantitative analysis of companies has been conducted to help clients understand the wider business environment as well as the strengths and weaknesses of key industry players. Data is qualitatively analyzed to categorize companies as pure play, category-focused, industry-focused, and diversified; it is quantitatively analyzed to categorize companies as dominant, leading, strong, tentative, and weak.

Recent Development and News in All-terrain crane market

  • In the Industrial Machinery and Supplies and Components industry, the widespread adoption of stringent Stage V emission standards forced equipment manufacturers to integrate advanced diesel particulate filter technology and emission compliant engines, directly impacting All-terrain Crane demand by accelerating fleet modernization cycles among heavy equipment rigging operators targeting a 20% reduction in carbon outputs.
  • The acceleration of automation in large-scale manufacturing facilities introduced sophisticated predictive maintenance sensors and telematics load tracking into mobile crane axles and standard machinery architectures, driving All-terrain Crane operators to upgrade equipment to achieve a proven 15% decrease in unexpected downtime during critical industrial plant maintenance schedules.
  • Structural shifts toward modular construction methods within civil engineering demanded higher lifting capacities from compact machinery footprints, influencing All-terrain Crane fleet optimization by increasing the utilization of units equipped with high tensile steel structures capable of handling 30% heavier prefabricated component hoisting workloads.
  • The rapid scale-up of global renewable energy infrastructure projects necessitated specialized heavy lift attachment designs and robust slewing mechanism configurations, boosting All-terrain Crane procurement by wind turbine erection contractors requiring machinery that increases setup efficiency by 25% across challenging off road mobility environments.

Dive into Technavio’s robust research methodology, blending expert interviews, extensive data synthesis, and validated models for unparalleled All-Terrain Crane Market insights. See full methodology.

Market Scope
Page number 285
Base year 2025
Historic period 2020-2024
Forecast period 2026-2030
Growth momentum & CAGR Accelerate at a CAGR of 4.8%
Market growth 2026-2030 USD 4570.8 million
Market structure Fragmented
YoY growth 2025-2026(%) 4.4%
Key countries China, Japan, India, Australia, South Korea, Indonesia, Germany, UK, France, Italy, Spain, The Netherlands, US, Canada, Mexico, Brazil, Argentina, Chile, Saudi Arabia, UAE, South Africa, Israel and Turkey
Competitive landscape Leading Companies, Market Positioning of Companies, Competitive Strategies, and Industry Risks

Request Free Sample

Research Analyst Overview

  • The All-terrain Crane sector is fundamentally restructuring its technological baseline to address increasingly complex heavy-lifting parameters. Fleet managers are embedding digital safety protocols into strategic procurement decisions, moving away from manual oversight toward automated fail-safes.
  • The integration of an advanced load moment indicator coupled with an automated anti two block mechanism ensures that lifting operations remain within secure functional limits, reducing critical failure risks by over 30% compared to legacy mechanical systems. High-capacity operations now rely heavily on refined telescopic boom extension profiles and modular luffing jib attachments to execute intricate lifts in constrained airspace.
  • These structural capabilities, combined with a high-performance winch hoist system, allow operators to place heavy industrial components with millimeter precision. Furthermore, chassis stabilization has become a focal point for mobility optimization; the adoption of megatrak suspension and intelligent hydro pneumatic suspension architectures guarantees balanced load distribution across uneven terrain.
  • Sophisticated sensors constantly monitor the outrigger reaction force, preventing tipping incidents under extreme loads. Simultaneously, optimized ground clearance geometry significantly reduces axle wear and tear, enabling contractors to lower long-term maintenance overhead while expanding the operational footprint of their machinery.

What are the Key Data Covered in this All-Terrain Crane Market Research and Growth Report?

  • What is the expected growth of the All-Terrain Crane Market between 2026 and 2030?

    • USD 4.57 billion, at a CAGR of 4.8%

  • What segmentation does the market report cover?

    • The report is segmented by Capacity (Less than 200 tons, Between 200-500 tons, and More than 500 tons), Application (Construction, Industrial, and Utilities), Channel (Rental/operators, and Direct purchase) and Geography (APAC, Europe, North America, South America, Middle East and Africa)

  • Which regions are analyzed in the report?

    • APAC, Europe, North America, South America and Middle East and Africa

  • What are the key growth drivers and market challenges?

    • Expansion of global infrastructure and urban regeneration initiatives, Supply chain disruptions and high equipment manufacturing costs

  • Who are the major players in the All-Terrain Crane Market?

    • Action Construction Equipment, Ainscough Crane Hire Ltd, Barnhart Crane and Rigging Co., Bay Crane Service Inc., Deep South Crane and Rigging LLC, Havator Group Oy, KATO WORKS CO. LTD., Liebherr International AG, Link Belt Cranes, Liugong Machinery Co. Ltd., Mammoet Holding B.V., Manitowoc Co Inc., Marchetti Autogru S.p.A., Ormig S.p.A., PALFINGER AG, Sany Heavy Industry Co. Ltd., Tadano Ltd., XCMG Group and Zoomlion Industry Co. Ltd.

Market Research Insights

  • The All-terrain Crane market exhibits dynamic structural shifts as contractors prioritize rapid deployment capability over traditional stationary lifting solutions. Technological advancements in lift plan engineering and optimized axle load distribution allow operators to execute complex bridge span placement tasks with unprecedented accuracy.
  • Modern machinery integrating enhanced operator cab ergonomics has demonstrably reduced operator fatigue, contributing directly to a 14% improvement in daily operational productivity. Furthermore, advanced safety control units and automated leveling systems have driven a 20% decrease in site-related safety incidents.
  • These measurable efficiency gains enable construction firms to lower overall project execution costs, making versatile mobile lifting platforms indispensable for high-density infrastructure development and energy sector installations.

We can help! Our analysts can customize this all-terrain crane market research report to meet your requirements.

Get in touch

1. Executive Summary

1.1 Market overview

Executive Summary - Chart on Market Overview
Executive Summary - Data Table on Market Overview
Executive Summary - Chart on Global Market Characteristics
Executive Summary - Chart on Market by Geography
Executive Summary - Chart on Market Segmentation by Capacity
Executive Summary - Chart on Market Segmentation by Application
Executive Summary - Chart on Market Segmentation by Channel
Executive Summary - Chart on Incremental Growth
Executive Summary - Data Table on Incremental Growth
Executive Summary - Chart on Company Market Positioning

2. Technavio Analysis

2.1 Analysis of price sensitivity, lifecycle, customer purchase basket, adoption rates, and purchase criteria

2.2 Criticality of inputs and Factors of differentiation

Chart on Overview on criticality of inputs and factors of differentiation

2.3 Factors of disruption

Chart on Overview on factors of disruption

2.4 Impact of drivers and challenges

Chart on Impact of drivers and challenges in 2025 and 2030

3. Market Landscape

3.1 Market ecosystem

Chart on Parent Market
Data Table on - Parent Market

3.2 Market characteristics

Chart on Market characteristics analysis

3.3 Value chain analysis

Chart on Value chain analysis

4. Market Sizing

4.1 Market definition

Data Table on Offerings of companies included in the market definition

4.2 Market segment analysis

Market segments

4.3 Market size 2025

4.4 Market outlook: Forecast for 2025-2030

Chart on Global - Market size and forecast 2025-2030 ($ million)
Data Table on Global - Market size and forecast 2025-2030 ($ million)
Chart on Global Market: Year-over-year growth 2025-2030 (%)
Data Table on Global Market: Year-over-year growth 2025-2030 (%)

5. Historic Market Size

5.1 Global All-Terrain Crane Market 2020 - 2024

Historic Market Size - Data Table on Global All-Terrain Crane Market 2020 - 2024 ($ million)

5.2 Capacity segment analysis 2020 - 2024

Historic Market Size - Capacity Segment 2020 - 2024 ($ million)

5.3 Application segment analysis 2020 - 2024

Historic Market Size - Application Segment 2020 - 2024 ($ million)

5.4 Channel segment analysis 2020 - 2024

Historic Market Size - Channel Segment 2020 - 2024 ($ million)

5.5 Geography segment analysis 2020 - 2024

Historic Market Size - Geography Segment 2020 - 2024 ($ million)

5.6 Country segment analysis 2020 - 2024

Historic Market Size - Country Segment 2020 - 2024 ($ million)

6. Qualitative Analysis

6.1 Impact of AI on Global All-Terrain Crane Market

6.2 Impact of Geopolitical Conflict on Global All-Terrain Crane Market

7. Five Forces Analysis

7.1 Five forces summary

Five forces analysis - Comparison between 2025 and 2030

7.2 Bargaining power of buyers

Bargaining power of buyers - Impact of key factors 2025 and 2030

7.3 Bargaining power of suppliers

Bargaining power of suppliers - Impact of key factors in 2025 and 2030

7.4 Threat of new entrants

Threat of new entrants - Impact of key factors in 2025 and 2030

7.5 Threat of substitutes

Threat of substitutes - Impact of key factors in 2025 and 2030

7.6 Threat of rivalry

Threat of rivalry - Impact of key factors in 2025 and 2030

7.7 Market condition

Chart on Market condition - Five forces 2025 and 2030

8. Market Segmentation by Capacity

8.1 Market segments

Chart on Capacity - Market share 2025-2030 (%)
Data Table on Capacity - Market share 2025-2030 (%)

8.2 Comparison by Capacity

Chart on Comparison by Capacity
Data Table on Comparison by Capacity

8.3 Less than 200 tons - Market size and forecast 2025-2030

Chart on Less than 200 tons - Market size and forecast 2025-2030 ($ million)
Data Table on Less than 200 tons - Market size and forecast 2025-2030 ($ million)
Chart on Less than 200 tons - Year-over-year growth 2025-2030 (%)
Data Table on Less than 200 tons - Year-over-year growth 2025-2030 (%)

8.4 Between 200-500 tons - Market size and forecast 2025-2030

Chart on Between 200-500 tons - Market size and forecast 2025-2030 ($ million)
Data Table on Between 200-500 tons - Market size and forecast 2025-2030 ($ million)
Chart on Between 200-500 tons - Year-over-year growth 2025-2030 (%)
Data Table on Between 200-500 tons - Year-over-year growth 2025-2030 (%)

8.5 More than 500 tons - Market size and forecast 2025-2030

Chart on More than 500 tons - Market size and forecast 2025-2030 ($ million)
Data Table on More than 500 tons - Market size and forecast 2025-2030 ($ million)
Chart on More than 500 tons - Year-over-year growth 2025-2030 (%)
Data Table on More than 500 tons - Year-over-year growth 2025-2030 (%)

8.6 Market opportunity by Capacity

Market opportunity by Capacity ($ million)
Data Table on Market opportunity by Capacity ($ million)

9. Market Segmentation by Application

9.1 Market segments

Chart on Application - Market share 2025-2030 (%)
Data Table on Application - Market share 2025-2030 (%)

9.2 Comparison by Application

Chart on Comparison by Application
Data Table on Comparison by Application

9.3 Construction - Market size and forecast 2025-2030

Chart on Construction - Market size and forecast 2025-2030 ($ million)
Data Table on Construction - Market size and forecast 2025-2030 ($ million)
Chart on Construction - Year-over-year growth 2025-2030 (%)
Data Table on Construction - Year-over-year growth 2025-2030 (%)

9.4 Industrial - Market size and forecast 2025-2030

Chart on Industrial - Market size and forecast 2025-2030 ($ million)
Data Table on Industrial - Market size and forecast 2025-2030 ($ million)
Chart on Industrial - Year-over-year growth 2025-2030 (%)
Data Table on Industrial - Year-over-year growth 2025-2030 (%)

9.5 Utilities - Market size and forecast 2025-2030

Chart on Utilities - Market size and forecast 2025-2030 ($ million)
Data Table on Utilities - Market size and forecast 2025-2030 ($ million)
Chart on Utilities - Year-over-year growth 2025-2030 (%)
Data Table on Utilities - Year-over-year growth 2025-2030 (%)

9.6 Market opportunity by Application

Market opportunity by Application ($ million)
Data Table on Market opportunity by Application ($ million)

10. Market Segmentation by Channel

10.1 Market segments

Chart on Channel - Market share 2025-2030 (%)
Data Table on Channel - Market share 2025-2030 (%)

10.2 Comparison by Channel

Chart on Comparison by Channel
Data Table on Comparison by Channel

10.3 Rental/operators - Market size and forecast 2025-2030

Chart on Rental/operators - Market size and forecast 2025-2030 ($ million)
Data Table on Rental/operators - Market size and forecast 2025-2030 ($ million)
Chart on Rental/operators - Year-over-year growth 2025-2030 (%)
Data Table on Rental/operators - Year-over-year growth 2025-2030 (%)

10.4 Direct purchase - Market size and forecast 2025-2030

Chart on Direct purchase - Market size and forecast 2025-2030 ($ million)
Data Table on Direct purchase - Market size and forecast 2025-2030 ($ million)
Chart on Direct purchase - Year-over-year growth 2025-2030 (%)
Data Table on Direct purchase - Year-over-year growth 2025-2030 (%)

10.5 Market opportunity by Channel

Market opportunity by Channel ($ million)
Data Table on Market opportunity by Channel ($ million)

11. Customer Landscape

11.1 Customer landscape overview

Analysis of price sensitivity, lifecycle, customer purchase basket, adoption rates, and purchase criteria

12. Geographic Landscape

12.1 Geographic segmentation

Chart on Market share by geography 2025-2030 (%)
Data Table on Market share by geography 2025-2030 (%)

12.2 Geographic comparison

Chart on Geographic comparison
Data Table on Geographic comparison

12.3 APAC - Market size and forecast 2025-2030

Chart on APAC - Market size and forecast 2025-2030 ($ million)
Data Table on APAC - Market size and forecast 2025-2030 ($ million)
Chart on APAC - Year-over-year growth 2025-2030 (%)
Data Table on APAC - Year-over-year growth 2025-2030 (%)
Chart on Regional Comparison - APAC
Data Table on Regional Comparison - APAC

12.3.1 China - Market size and forecast 2025-2030

Chart on China - Market size and forecast 2025-2030 ($ million)
Data Table on China - Market size and forecast 2025-2030 ($ million)
Chart on China - Year-over-year growth 2025-2030 (%)
Data Table on China - Year-over-year growth 2025-2030 (%)

12.3.2 Japan - Market size and forecast 2025-2030

Chart on Japan - Market size and forecast 2025-2030 ($ million)
Data Table on Japan - Market size and forecast 2025-2030 ($ million)
Chart on Japan - Year-over-year growth 2025-2030 (%)
Data Table on Japan - Year-over-year growth 2025-2030 (%)

12.3.3 India - Market size and forecast 2025-2030

Chart on India - Market size and forecast 2025-2030 ($ million)
Data Table on India - Market size and forecast 2025-2030 ($ million)
Chart on India - Year-over-year growth 2025-2030 (%)
Data Table on India - Year-over-year growth 2025-2030 (%)

12.3.4 Australia - Market size and forecast 2025-2030

Chart on Australia - Market size and forecast 2025-2030 ($ million)
Data Table on Australia - Market size and forecast 2025-2030 ($ million)
Chart on Australia - Year-over-year growth 2025-2030 (%)
Data Table on Australia - Year-over-year growth 2025-2030 (%)

12.3.5 South Korea - Market size and forecast 2025-2030

Chart on South Korea - Market size and forecast 2025-2030 ($ million)
Data Table on South Korea - Market size and forecast 2025-2030 ($ million)
Chart on South Korea - Year-over-year growth 2025-2030 (%)
Data Table on South Korea - Year-over-year growth 2025-2030 (%)

12.3.6 Indonesia - Market size and forecast 2025-2030

Chart on Indonesia - Market size and forecast 2025-2030 ($ million)
Data Table on Indonesia - Market size and forecast 2025-2030 ($ million)
Chart on Indonesia - Year-over-year growth 2025-2030 (%)
Data Table on Indonesia - Year-over-year growth 2025-2030 (%)

12.4 Europe - Market size and forecast 2025-2030

Chart on Europe - Market size and forecast 2025-2030 ($ million)
Data Table on Europe - Market size and forecast 2025-2030 ($ million)
Chart on Europe - Year-over-year growth 2025-2030 (%)
Data Table on Europe - Year-over-year growth 2025-2030 (%)
Chart on Regional Comparison - Europe
Data Table on Regional Comparison - Europe

12.4.1 Germany - Market size and forecast 2025-2030

Chart on Germany - Market size and forecast 2025-2030 ($ million)
Data Table on Germany - Market size and forecast 2025-2030 ($ million)
Chart on Germany - Year-over-year growth 2025-2030 (%)
Data Table on Germany - Year-over-year growth 2025-2030 (%)

12.4.2 UK - Market size and forecast 2025-2030

Chart on UK - Market size and forecast 2025-2030 ($ million)
Data Table on UK - Market size and forecast 2025-2030 ($ million)
Chart on UK - Year-over-year growth 2025-2030 (%)
Data Table on UK - Year-over-year growth 2025-2030 (%)

12.4.3 France - Market size and forecast 2025-2030

Chart on France - Market size and forecast 2025-2030 ($ million)
Data Table on France - Market size and forecast 2025-2030 ($ million)
Chart on France - Year-over-year growth 2025-2030 (%)
Data Table on France - Year-over-year growth 2025-2030 (%)

12.4.4 Italy - Market size and forecast 2025-2030

Chart on Italy - Market size and forecast 2025-2030 ($ million)
Data Table on Italy - Market size and forecast 2025-2030 ($ million)
Chart on Italy - Year-over-year growth 2025-2030 (%)
Data Table on Italy - Year-over-year growth 2025-2030 (%)

12.4.5 Spain - Market size and forecast 2025-2030

Chart on Spain - Market size and forecast 2025-2030 ($ million)
Data Table on Spain - Market size and forecast 2025-2030 ($ million)
Chart on Spain - Year-over-year growth 2025-2030 (%)
Data Table on Spain - Year-over-year growth 2025-2030 (%)

12.4.6 The Netherlands - Market size and forecast 2025-2030

Chart on The Netherlands - Market size and forecast 2025-2030 ($ million)
Data Table on The Netherlands - Market size and forecast 2025-2030 ($ million)
Chart on The Netherlands - Year-over-year growth 2025-2030 (%)
Data Table on The Netherlands - Year-over-year growth 2025-2030 (%)

12.5 North America - Market size and forecast 2025-2030

Chart on North America - Market size and forecast 2025-2030 ($ million)
Data Table on North America - Market size and forecast 2025-2030 ($ million)
Chart on North America - Year-over-year growth 2025-2030 (%)
Data Table on North America - Year-over-year growth 2025-2030 (%)
Chart on Regional Comparison - North America
Data Table on Regional Comparison - North America

12.5.1 US - Market size and forecast 2025-2030

Chart on US - Market size and forecast 2025-2030 ($ million)
Data Table on US - Market size and forecast 2025-2030 ($ million)
Chart on US - Year-over-year growth 2025-2030 (%)
Data Table on US - Year-over-year growth 2025-2030 (%)

12.5.2 Canada - Market size and forecast 2025-2030

Chart on Canada - Market size and forecast 2025-2030 ($ million)
Data Table on Canada - Market size and forecast 2025-2030 ($ million)
Chart on Canada - Year-over-year growth 2025-2030 (%)
Data Table on Canada - Year-over-year growth 2025-2030 (%)

12.5.3 Mexico - Market size and forecast 2025-2030

Chart on Mexico - Market size and forecast 2025-2030 ($ million)
Data Table on Mexico - Market size and forecast 2025-2030 ($ million)
Chart on Mexico - Year-over-year growth 2025-2030 (%)
Data Table on Mexico - Year-over-year growth 2025-2030 (%)

12.6 South America - Market size and forecast 2025-2030

Chart on South America - Market size and forecast 2025-2030 ($ million)
Data Table on South America - Market size and forecast 2025-2030 ($ million)
Chart on South America - Year-over-year growth 2025-2030 (%)
Data Table on South America - Year-over-year growth 2025-2030 (%)
Chart on Regional Comparison - South America
Data Table on Regional Comparison - South America

12.6.1 Brazil - Market size and forecast 2025-2030

Chart on Brazil - Market size and forecast 2025-2030 ($ million)
Data Table on Brazil - Market size and forecast 2025-2030 ($ million)
Chart on Brazil - Year-over-year growth 2025-2030 (%)
Data Table on Brazil - Year-over-year growth 2025-2030 (%)

12.6.2 Argentina - Market size and forecast 2025-2030

Chart on Argentina - Market size and forecast 2025-2030 ($ million)
Data Table on Argentina - Market size and forecast 2025-2030 ($ million)
Chart on Argentina - Year-over-year growth 2025-2030 (%)
Data Table on Argentina - Year-over-year growth 2025-2030 (%)

12.6.3 Chile - Market size and forecast 2025-2030

Chart on Chile - Market size and forecast 2025-2030 ($ million)
Data Table on Chile - Market size and forecast 2025-2030 ($ million)
Chart on Chile - Year-over-year growth 2025-2030 (%)
Data Table on Chile - Year-over-year growth 2025-2030 (%)

12.7 Middle East and Africa - Market size and forecast 2025-2030

Chart on Middle East and Africa - Market size and forecast 2025-2030 ($ million)
Data Table on Middle East and Africa - Market size and forecast 2025-2030 ($ million)
Chart on Middle East and Africa - Year-over-year growth 2025-2030 (%)
Data Table on Middle East and Africa - Year-over-year growth 2025-2030 (%)
Chart on Regional Comparison - Middle East and Africa
Data Table on Regional Comparison - Middle East and Africa

12.7.1 Saudi Arabia - Market size and forecast 2025-2030

Chart on Saudi Arabia - Market size and forecast 2025-2030 ($ million)
Data Table on Saudi Arabia - Market size and forecast 2025-2030 ($ million)
Chart on Saudi Arabia - Year-over-year growth 2025-2030 (%)
Data Table on Saudi Arabia - Year-over-year growth 2025-2030 (%)

12.7.2 UAE - Market size and forecast 2025-2030

Chart on UAE - Market size and forecast 2025-2030 ($ million)
Data Table on UAE - Market size and forecast 2025-2030 ($ million)
Chart on UAE - Year-over-year growth 2025-2030 (%)
Data Table on UAE - Year-over-year growth 2025-2030 (%)

12.7.3 South Africa - Market size and forecast 2025-2030

Chart on South Africa - Market size and forecast 2025-2030 ($ million)
Data Table on South Africa - Market size and forecast 2025-2030 ($ million)
Chart on South Africa - Year-over-year growth 2025-2030 (%)
Data Table on South Africa - Year-over-year growth 2025-2030 (%)

12.7.4 Israel - Market size and forecast 2025-2030

Chart on Israel - Market size and forecast 2025-2030 ($ million)
Data Table on Israel - Market size and forecast 2025-2030 ($ million)
Chart on Israel - Year-over-year growth 2025-2030 (%)
Data Table on Israel - Year-over-year growth 2025-2030 (%)

12.7.5 Turkey - Market size and forecast 2025-2030

Chart on Turkey - Market size and forecast 2025-2030 ($ million)
Data Table on Turkey - Market size and forecast 2025-2030 ($ million)
Chart on Turkey - Year-over-year growth 2025-2030 (%)
Data Table on Turkey - Year-over-year growth 2025-2030 (%)

12.8 Market opportunity by geography

Market opportunity by geography ($ million)
Data Tables on Market opportunity by geography ($ million)

13. Drivers, Challenges, and Opportunity

13.1 Market drivers

Expansion of global infrastructure and urban regeneration initiatives
Rapid transition toward renewable energy and wind power infrastructure
Technological advancements and integration of smart digital systems

13.2 Market challenges

Supply chain disruptions and high equipment manufacturing costs
Severe shortage of skilled crane operators and technical personnel
Stringent environmental standards and decarbonization mandates

13.3 Impact of drivers and challenges

Impact of drivers and challenges in 2025 and 2030

13.4 Market opportunities

Accelerated digital transformation and integration of autonomous control systems
Transition toward sustainable power solutions and carbon neutrality
Technological convergence of AI and predictive maintenance

14. Competitive Landscape

14.1 Overview

14.2

Overview on criticality of inputs and factors of differentiation

14.3 Landscape disruption

Overview on factors of disruption

14.4 Industry risks

Impact of key risks on business

15. Competitive Analysis

15.1 Companies profiled

Companies covered

15.2 Company ranking index

15.3 Market positioning of companies

Matrix on companies position and classification

15.4 Action Construction Equipment

Action Construction Equipment - Overview
Action Construction Equipment - Business segments
Action Construction Equipment - Key offerings
Action Construction Equipment - Segment focus
SWOT

15.5 Barnhart Crane and Rigging Co.

Barnhart Crane and Rigging Co. - Overview
Barnhart Crane and Rigging Co. - Product / Service
Barnhart Crane and Rigging Co. - Key offerings
SWOT

15.6 Bay Crane Service Inc.

Bay Crane Service Inc. - Overview
Bay Crane Service Inc. - Product / Service
Bay Crane Service Inc. - Key offerings
SWOT

15.7 KATO WORKS CO. LTD.

KATO WORKS CO. LTD. - Overview
KATO WORKS CO. LTD. - Product / Service
KATO WORKS CO. LTD. - Key offerings
SWOT

15.8 Liebherr International AG

Liebherr International AG - Overview
Liebherr International AG - Product / Service
Liebherr International AG - Key offerings
SWOT

15.9 Link Belt Cranes

Link Belt Cranes - Overview
Link Belt Cranes - Product / Service
Link Belt Cranes - Key offerings
SWOT

15.10 Liugong Machinery Co. Ltd.

Liugong Machinery Co. Ltd. - Overview
Liugong Machinery Co. Ltd. - Business segments
Liugong Machinery Co. Ltd. - Key offerings
Liugong Machinery Co. Ltd. - Segment focus
SWOT

15.11 Manitowoc Co Inc.

Manitowoc Co Inc. - Overview
Manitowoc Co Inc. - Business segments
Manitowoc Co Inc. - Key offerings
Manitowoc Co Inc. - Segment focus
SWOT

15.12 Marchetti Autogru S.p.A.

Marchetti Autogru S.p.A. - Overview
Marchetti Autogru S.p.A. - Product / Service
Marchetti Autogru S.p.A. - Key offerings
SWOT

15.13 Ormig S.p.A.

Ormig S.p.A. - Overview
Ormig S.p.A. - Product / Service
Ormig S.p.A. - Key offerings
SWOT

15.14 PALFINGER AG

PALFINGER AG - Overview
PALFINGER AG - Business segments
PALFINGER AG - Key offerings
PALFINGER AG - Segment focus
SWOT

15.15 Sany Heavy Industry Co. Ltd.

Sany Heavy Industry Co. Ltd. - Overview
Sany Heavy Industry Co. Ltd. - Business segments
Sany Heavy Industry Co. Ltd. - Key offerings
Sany Heavy Industry Co. Ltd. - Segment focus
SWOT

15.16 Tadano Ltd.

Tadano Ltd. - Overview
Tadano Ltd. - Business segments
Tadano Ltd. - Key offerings
Tadano Ltd. - Segment focus
SWOT

15.17 XCMG Group

XCMG Group - Overview
XCMG Group - Business segments
XCMG Group - Key offerings
XCMG Group - Segment focus
SWOT

15.18 Zoomlion Industry Co. Ltd.

Zoomlion Industry Co. Ltd. - Overview
Zoomlion Industry Co. Ltd. - Business segments
Zoomlion Industry Co. Ltd. - Key offerings
Zoomlion Industry Co. Ltd. - Segment focus
SWOT

16. Appendix

16.1 Scope of the report

Market definition
Objectives
Notes and caveats

16.2 Inclusions and exclusions checklist

Inclusions checklist
Exclusions checklist

16.3 Currency conversion rates for US$

16.4 Research methodology

16.5 Data procurement

Information sources

16.6 Data validation

16.7 Validation techniques employed for market sizing

16.8 Data synthesis

16.9 360 degree market analysis

16.10 List of abbreviations

Research Methodology

Technavio presents a detailed picture of the market by way of study, synthesis, and summation of data from multiple sources. The analysts have presented the various facets of the market with a particular focus on identifying the key industry influencers. The data thus presented is comprehensive, reliable, and the result of extensive research, both primary and secondary.

INFORMATION SOURCES

Primary sources

  • Manufacturers and suppliers
  • Channel partners
  • Industry experts
  • Strategic decision makers

Secondary sources

  • Industry journals and periodicals
  • Government data
  • Financial reports of key industry players
  • Historical data
  • Press releases

DATA ANALYSIS

Data Synthesis

  • Collation of data
  • Estimation of key figures
  • Analysis of derived insights

Data Validation

  • Triangulation with data models
  • Reference against proprietary databases
  • Corroboration with industry experts

REPORT WRITING

Qualitative

  • Market drivers
  • Market challenges
  • Market trends
  • Five forces analysis

Quantitative

  • Market size and forecast
  • Market segmentation
  • Geographical insights
  • Competitive landscape

Interested in this report?

Get your sample now to see our research methodology and insights!

Download Now

Frequently Asked Questions

All-Terrain Crane market growth will increase by USD 4570.8 million during 2026-2030.

The All-Terrain Crane market is expected to grow at a CAGR of 4.8% during 2026-2030.

All-Terrain Crane market is segmented by Capacity (Less than 200 tons, Between 200-500 tons, More than 500 tons) Application (Construction, Industrial, Utilities) Channel (Rental/operators, Direct purchase)

Action Construction Equipment, Ainscough Crane Hire Ltd, Barnhart Crane and Rigging Co., Bay Crane Service Inc., Deep South Crane and Rigging LLC, Havator Group Oy, KATO WORKS CO. LTD., Liebherr International AG, Link Belt Cranes, Liugong Machinery Co. Ltd., Mammoet Holding B.V., Manitowoc Co Inc., Marchetti Autogru S.p.A., Ormig S.p.A., PALFINGER AG, Sany Heavy Industry Co. Ltd., Tadano Ltd., XCMG Group, Zoomlion Industry Co. Ltd. are a few of the key vendors in the All-Terrain Crane market.

APAC will register the highest growth rate of 49.3% among the other regions. Therefore, the All-Terrain Crane market in APAC is expected to garner significant business opportunities for the vendors during the forecast period.

China, Japan, India, Australia, South Korea, Indonesia, Germany, UK, France, Italy, Spain, The Netherlands, US, Canada, Mexico, Brazil, Argentina, Chile, Saudi Arabia, UAE, South Africa, Israel, Turkey

  • Expansion of global infrastructure and urban regeneration initiatives is the driving factor this market.

The All-Terrain Crane market vendors should focus on grabbing business opportunities from the Capacity segment as it accounted for the largest market share in the base year.
RIA - Research AI Assistant
Ask RIA
