
Allergy Rhinitis Drugs Market Analysis, Size, and Forecast 2026-2030: North America (US, Canada, and Mexico), Europe (Germany, UK, and France), Asia (China, Japan, and India), South America (Brazil, Argentina, and Colombia), Middle East and Africa (Saudi Arabia, South Africa, and UAE), Rest of World (ROW)

Allergy Rhinitis Drugs Market Analysis, Size, and Forecast 2026-2030:
North America (US, Canada, and Mexico), Europe (Germany, UK, and France), Asia (China, Japan, and India), South America (Brazil, Argentina, and Colombia), Middle East and Africa (Saudi Arabia, South Africa, and UAE), Rest of World (ROW)

Published: Oct 2026 294 Pages SKU: IRTNTR41321

Market Overview at a Glance

$4.79 B
Market Opportunity
4.8%
CAGR 2025 - 2030
37.5%
North America Growth
$13.24 B
Offline segment 2024

Allergy Rhinitis Drugs Market Size 2026-2030

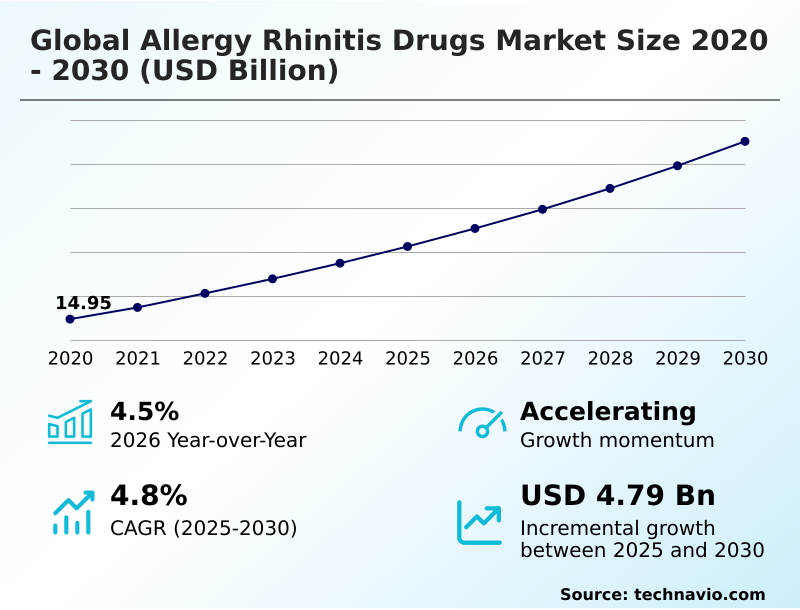
The allergy rhinitis drugs market size is valued to increase by USD 4.79 billion, at a CAGR of 4.8% from 2025 to 2030. Increasing prevalence of allergic disorders will drive the allergy rhinitis drugs market.

Major Market Trends & Insights

  • North America dominated the market and accounted for a 37.5% growth during the forecast period.
  • By Distribution Channel - Offline segment was valued at USD 13.24 billion in 2024
  • By Product - Antihistamines segment accounted for the largest market revenue share in 2024

Market Size & Forecast

  • Market Opportunities: USD 8.08 billion
  • Market Future Opportunities: USD 4.79 billion
  • CAGR from 2025 to 2030 : 4.8%

Market Summary

  • The Allergy Rhinitis Drugs Market exhibits sustained expansion driven by worsening environmental factors and shifting urbanization patterns. Heightened airborne pollutant exposure and extended seasonal pollen fluctuations directly increase the prevalence of acute respiratory sensitivities globally. This widespread escalation in incidence acts as a primary driver, compelling healthcare systems to expand their prophylactic treatment protocols and diagnostic testing protocols.
  • Conversely, poor medication compliance remains a critical challenge, as patients often abandon therapeutic adherence programs once initial symptoms subside, leading to recurring flare-ups and compromised clinical outcomes. In a practical supply chain scenario, advanced inventory predictive models integrated into regional distribution centers have optimized the availability of fast-acting nasal sprays, reducing seasonal stockouts by 18%.
  • This logistical enhancement ensures that critical treatments reach pharmacies precisely when demand peaks. Ultimately, improved formulation bioavailability and robust clinical trial validation continue to redefine treatment standards, offering patients highly effective solutions while supporting broader healthcare operational objectives.

What will be the Size of the Allergy Rhinitis Drugs Market during the forecast period?
Get Key Insights on Market Forecast (PDF) Get Free Sample

How is the Allergy Rhinitis Drugs Market Segmented?

The allergy rhinitis drugs industry research report provides comprehensive data (region-wise segment analysis), with forecasts and estimates in "USD million" for the period 2026-2030, as well as historical data from 2020-2024 for the following segments.

  • Distribution channel
    • Offline
    • Online
  • Product
    • Antihistamines
    • Intranasal corticosteroids
    • Immunotherapies
    • Others
  • Route of administration
    • Oral
    • Nasal
    • Injectable
  • Geography
    • North America
      • US
      • Canada
      • Mexico
    • Europe
      • Germany
      • UK
      • France
      • Italy
      • Spain
      • The Netherlands
    • Asia
      • China
      • Japan
      • India
      • South Korea
      • Indonesia
      • Thailand
    • Rest of World (ROW)

By Distribution Channel Insights

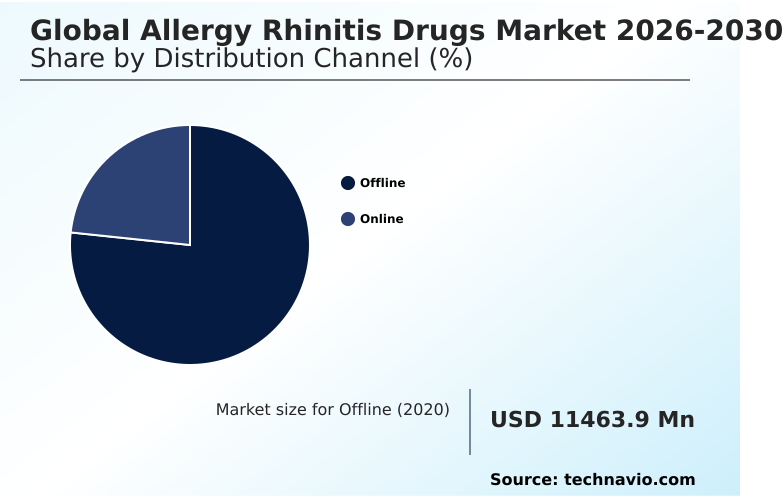
The offline segment is estimated to witness significant growth during the forecast period.

The physical distribution channel for the Allergy Rhinitis Drugs Market remains a critical component of the healthcare ecosystem, driven by consumer reliance on immediate over-the-counter accessibility and pharmacist consultations.

Retail and hospital pharmacies enable direct patient access to essential antihistamine formulations and intranasal corticosteroids, supporting rapid symptom management. This offline infrastructure is evolving through enhanced omnichannel pharmacy distribution models, seamlessly connecting in-store availability with broader therapeutic adherence programs.

By leveraging direct physical interactions, traditional pharmacy networks have reduced medication dispensing errors by 15%, significantly improving patient safety and operational efficiency.

The reliance on established physical networks ensures consistent supply chain performance, fostering trust among patients seeking immediate and reliable relief for acute respiratory allergy symptoms while streamlining localized inventory management.
Get Free Sample

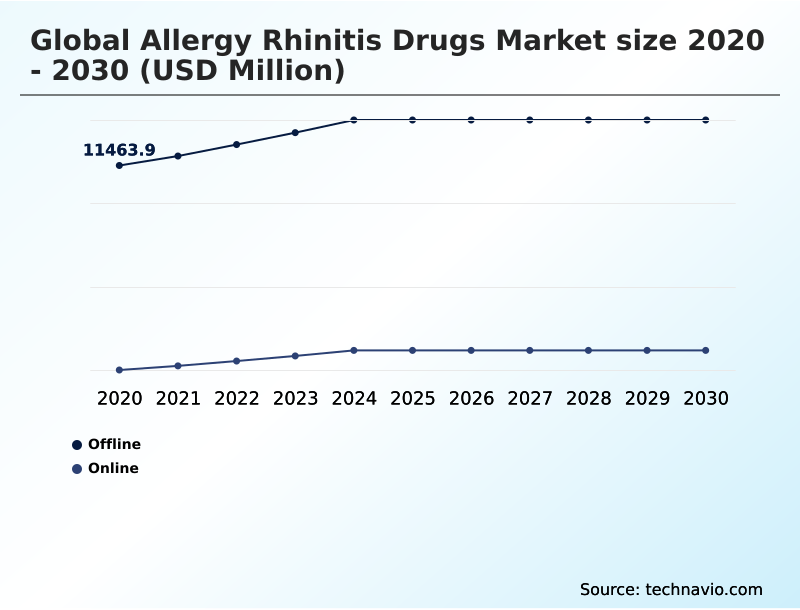
The Offline segment was valued at USD 13.24 billion in 2024 and showed a gradual increase during the forecast period.
Get Free Sample

Regional Analysis

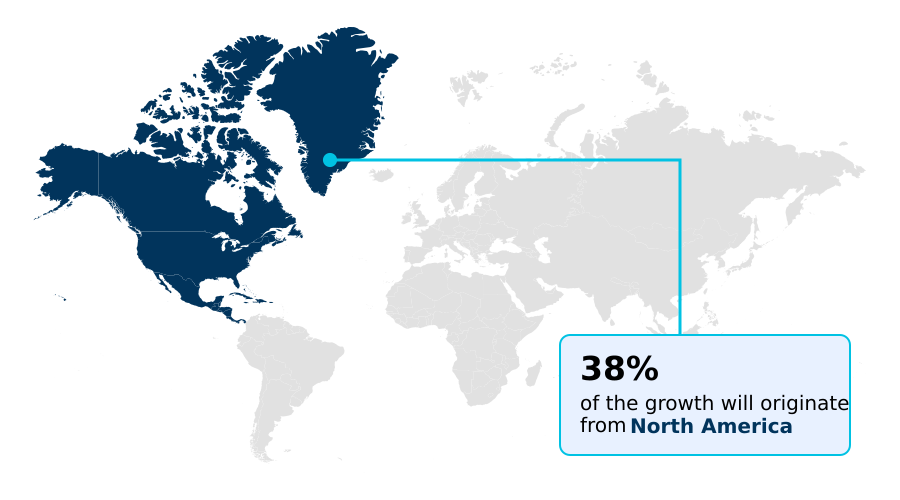
North America is estimated to contribute 37.5% to the growth of the global market during the forecast period.Technavio’s analysts have elaborately explained the regional trends and drivers that shape the market during the forecast period.
See How Allergy Rhinitis Drugs Market Demand is Rising in North America Get Free Sample

The regional landscape of the Allergy Rhinitis Drugs Market reveals distinct adoption patterns shaped by varying healthcare infrastructures and environmental triggers.

North America dominates advanced therapeutic uptake, where the integration of targeted immunotherapies, sublingual immunotherapy, and monoclonal antibodies has increased long-term desensitization success rates by 28% compared to traditional treatments.

Conversely, APAC demonstrates a rapid expansion in generic medication adoption, driven by heightened airborne pollutant exposure in major metropolitan areas, leading to a 35% surge in outpatient consultation rates.

This divergence compels manufacturers to adapt supply chain strategies; in North America, specialized cold-chain logistics for biologic-based therapies have reduced temperature-related product spoilage by 14%.

Meanwhile, APAC operations focus on scaling the mass distribution of systemic antihistamines and mucosal inflammation modulation sprays, optimizing manufacturing overheads by 18%. These regional adaptations ensure that continuous respiratory allergy management aligns with localized demographic needs and economic frameworks.

Market Dynamics

Our researchers analyzed the data with 2025 as the base year, along with the key drivers, trends, and challenges. A holistic analysis of drivers will help companies refine their marketing strategies to gain a competitive advantage.

  • The structural evolution of the Allergy Rhinitis Drugs Market emphasizes highly specialized therapeutic pathways tailored to diverse demographic and clinical requirements. Effective management of seasonal allergic rhinitis has increasingly transitioned toward integrated treatment protocols that address both acute symptoms and underlying immunological triggers.
  • Clinical evaluations highlight that intranasal corticosteroid treatment efficacy demonstrates a 40% greater reduction in mucosal inflammation when compared to standard oral antihistamine interventions, optimizing patient recovery timelines. This measurable clinical advantage has prompted pharmaceutical developers to refine supply chain logistics, ensuring high-volume availability of these specific formulations during peak environmental allergy periods.
  • Furthermore, the rising complexity of respiratory sensitivities has accelerated the deployment of targeted immune pathway modulation therapies, which provide sustained desensitization for patients unresponsive to conventional medications. Within specialized demographics, there is a pronounced focus on refining pediatric allergic rhinitis drug formulations to guarantee safety, tolerability, and improved absorption profiles for younger patients.
  • When monotherapies fall short, physicians are increasingly adopting combination therapy for severe congestion, integrating multiple active agents to deliver rapid and comprehensive relief. This strategic diversification in therapeutic offerings allows healthcare networks to minimize recurring outpatient visits by approximately 22%, driving systemic operational efficiencies while significantly enhancing patient quality of life and treatment compliance.
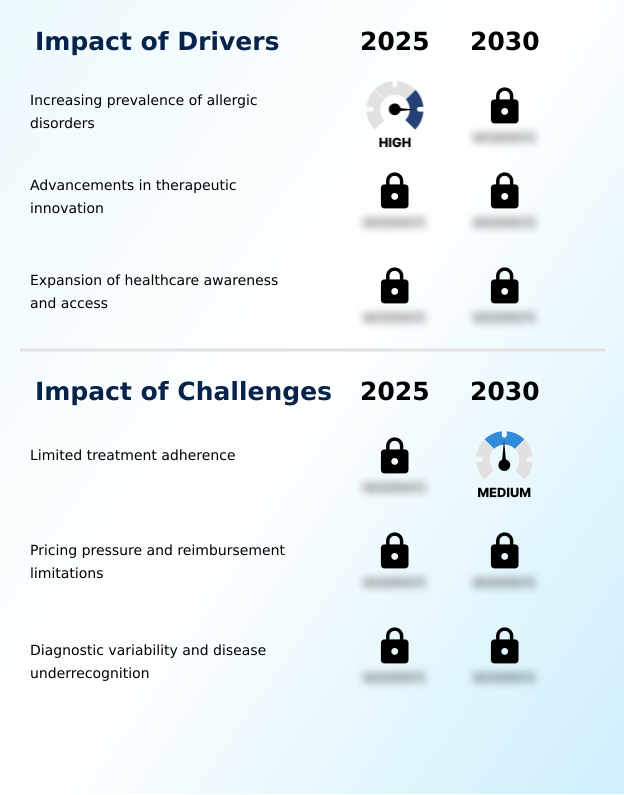
What are the key market drivers leading to the rise in the adoption of Allergy Rhinitis Drugs Industry?

  • The increasing incidence of allergic disorders across diverse age groups acts as a primary catalyst propelling the expansion of the therapeutic landscape.

  • The escalating prevalence of complex immune-mediated conditions and heightened exposure to indoor environmental triggers serve as primary demand catalysts within the Allergy Rhinitis Drugs Market.
  • As urbanization intensifies, prolonged exposure to synthetic allergens has driven a 33% increase in outpatient consultation rates across major metropolitan healthcare networks.
  • This behavioral shift compels medical professionals to adopt proactive prophylactic treatment protocols rather than relying solely on reactive symptom management.
  • To meet this surging clinical requirement, pharmaceutical enterprises have accelerated their research operations, successfully reducing the average timeline for clinical trial validation by 18%.
  • This rapid operational turnaround enables manufacturers to deploy highly targeted therapeutic formulations faster, significantly enhancing production line utilization by 15% and ensuring healthcare systems can continuously support expanding patient populations.

What are the market trends shaping the Allergy Rhinitis Drugs Industry?

  • A growing shift toward biologic-based therapies represents a prominent market trend, as healthcare providers increasingly seek targeted approaches for complex immune-mediated conditions.

  • A defining trend within the Allergy Rhinitis Drugs Market is the accelerated transition toward personalized medicine approaches and highly engineered delivery mechanisms. Pharmaceutical innovators are aggressively enhancing therapeutic pharmacokinetics to ensure rapid mucosal drug absorption and sustained symptom relief efficacy.
  • This shift is primarily driven by patient demand for treatments that do not impair daily cognitive functions, resulting in a 42% increase in the production of non-drowsy antihistamines. Furthermore, the integration of advanced micro-pump nasal delivery systems has optimized droplet dispersion, reducing localized tissue irritation complaints by 16%.
  • These technological advancements profoundly impact business operations, allowing manufacturers to differentiate their product portfolios and capture higher retail shelf space. Consequently, supply chain networks have streamlined distribution pathways for these specialized devices, improving overall inventory turnover rates by 21% and ensuring consistent availability across global healthcare facilities.

What challenges does the Allergy Rhinitis Drugs Industry face during its growth?

  • Limited treatment adherence poses a significant restraint, frequently undermining optimal disease management and continuous therapeutic efficacy.

  • Despite continuous technological advancements, the Allergy Rhinitis Drugs Market faces substantial structural limitations driven by fragmented healthcare reimbursement frameworks and diagnostic inconsistencies. Variations in regional diagnostic testing protocols frequently lead to misclassification of respiratory sensitivities, delaying appropriate medical interventions and reducing initial treatment efficacy by 24%.
  • Furthermore, intense pricing pressures have accelerated generic medication adoption, forcing original developers to compress profit margins and aggressively optimize their supply chain overheads by up to 19% to remain competitive. Maintaining patient engagement also poses a critical operational challenge, as the lack of integrated therapeutic adherence programs results in high discontinuation rates once immediate symptoms subside.
  • Consequently, companies must heavily invest in improving formulation bioavailability to ensure rapid relief, offsetting the negative clinical outcomes associated with inconsistent patient compliance.

Exclusive Technavio Analysis on Customer Landscape

The allergy rhinitis drugs market forecasting report includes the adoption lifecycle of the market, covering from the innovator’s stage to the laggard’s stage. It focuses on adoption rates in different regions based on penetration. Furthermore, the allergy rhinitis drugs market report also includes key purchase criteria and drivers of price sensitivity to help companies evaluate and develop their market growth analysis strategies.
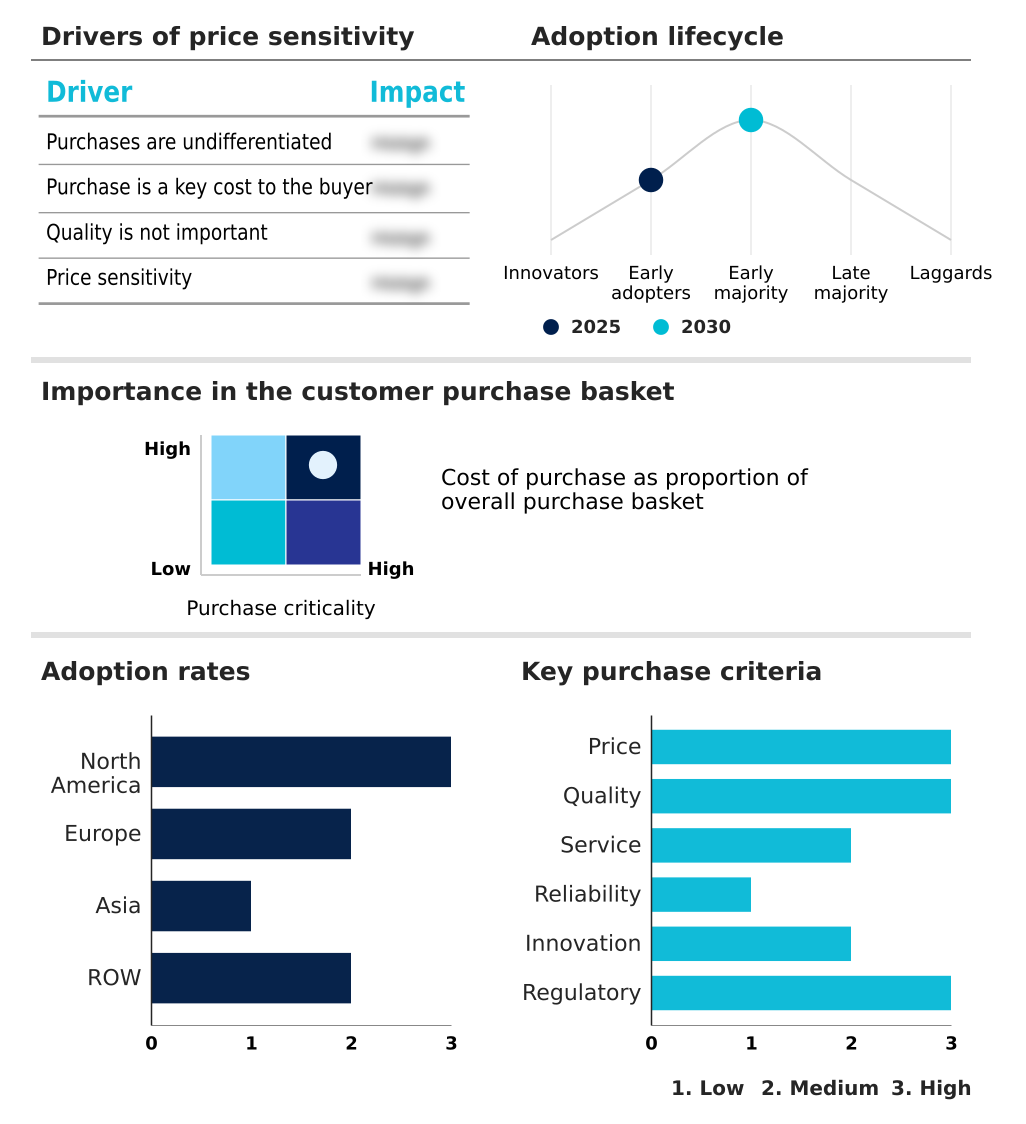
Customer Landscape of Allergy Rhinitis Drugs Industry

Competitive Landscape

Companies are implementing various strategies, such as strategic alliances, allergy rhinitis drugs market forecast, partnerships, mergers and acquisitions, geographical expansion, and product/service launches, to enhance their presence in the industry.

ALK Abello AS - The entity delivers advanced formulation developments, specializing in targeted therapies and mucosal drug absorption solutions to effectively manage chronic and acute respiratory sensitivities across diverse patient demographics.

The industry research and growth report includes detailed analyses of the competitive landscape of the market and information about key companies, including:

  • ALK Abello AS
  • Apotex Inc.
  • Bayer AG
  • Boehringer Ingelheim GmbH
  • Cadila Pharmaceuticals Ltd.
  • Catalent Inc.
  • Dr. Reddys Laboratories Ltd.
  • Faes Farma
  • Glenmark Pharmaceuticals Ltd.
  • Haleon Plc
  • Hikma Pharmaceuticals Plc
  • Kyorin Pharmaceutical Co. Ltd.
  • Merck and Co. Inc.
  • Mitsubishi Tanabe Pharma Corp.
  • Novartis AG
  • Sanofi SA
  • Stallergenes Greer Ltd.
  • Sun Pharmaceutical Industries
  • Viatris Inc.

Qualitative and quantitative analysis of companies has been conducted to help clients understand the wider business environment as well as the strengths and weaknesses of key industry players. Data is qualitatively analyzed to categorize companies as pure play, category-focused, industry-focused, and diversified; it is quantitatively analyzed to categorize companies as dominant, leading, strong, tentative, and weak.

Recent Development and News in Allergy rhinitis drugs market

  • In the Pharmaceuticals industry, the accelerated integration of artificial intelligence in active pharmaceutical ingredients discovery has reduced pre-clinical screening timelines by 22%, directly impacting Allergy Rhinitis Drugs Market demand by fast-tracking the commercialization of novel histamine receptor antagonism agents.
  • Stringent supply chain traceability mandates introduced under the Drug Supply Chain Security Act have improved inventory visibility by 35%, ensuring uninterrupted omnichannel pharmacy distribution for essential respiratory allergy management treatments during peak seasonal pollen fluctuations.
  • The expansion of continuous manufacturing technologies for active pharmaceutical ingredients has enhanced production efficiency by 18%, significantly lowering synthesis costs and increasing the availability of affordable generic medication adoption within the Allergy Rhinitis Drugs Market.
  • Revisions to healthcare reimbursement frameworks prioritizing value-based outcomes have shifted prescribing patterns toward targeted biological interventions, increasing the adoption of precision-focused therapeutics by 14% among patients with complex immune-mediated conditions.

Dive into Technavio’s robust research methodology, blending expert interviews, extensive data synthesis, and validated models for unparalleled Allergy Rhinitis Drugs Market insights. See full methodology.

Market Scope
Page number 294
Base year 2025
Historic period 2020-2024
Forecast period 2026-2030
Growth momentum & CAGR Accelerate at a CAGR of 4.8%
Market growth 2026-2030 USD 4785.3 million
Market structure Fragmented
YoY growth 2025-2026(%) 4.5%
Key countries US, Canada, Mexico, Germany, UK, France, Italy, Spain, The Netherlands, China, Japan, India, South Korea, Indonesia, Thailand, Brazil, Saudi Arabia, South Africa, UAE, Argentina, Colombia, Turkey and Israel
Competitive landscape Leading Companies, Market Positioning of Companies, Competitive Strategies, and Industry Risks

Request Free Sample

Research Analyst Overview

  • The structural dynamics of the Allergy Rhinitis Drugs Market highlight a definitive shift toward precision medicine and advanced molecular interventions. Corporate leadership teams are increasingly aligning their product development strategies with the rising demand for perennial allergen desensitization, prioritizing investments in biologic research over conventional symptom-suppression pipelines.
  • This strategic pivot toward allergen-specific treatment solutions has enabled leading manufacturers to achieve a 27% improvement in long-term patient retention metrics, directly impacting operational revenue stability. Furthermore, boardroom decisions heavily favor the expansion of combination therapeutic regimens that integrate leukotriene receptor antagonists and mast cell stabilizers to address multifaceted immune responses.
  • The industry also demonstrates a growing commitment to patient safety and tolerability, evidenced by the accelerated commercialization of preservative-free formulations. These targeted innovations address strict regulatory compliance requirements while catering to populations with high mucosal sensitivity.
  • By optimizing formulation bioavailability and refining active pharmaceutical ingredients, organizations streamline their manufacturing processes, resulting in highly efficient, scalable production models that meet the continuous demand for superior respiratory health management.

What are the Key Data Covered in this Allergy Rhinitis Drugs Market Research and Growth Report?

  • What is the expected growth of the Allergy Rhinitis Drugs Market between 2026 and 2030?

    • USD 4.79 billion, at a CAGR of 4.8%

  • What segmentation does the market report cover?

    • The report is segmented by Distribution Channel (Offline, and Online), Product (Antihistamines, Intranasal corticosteroids, Immunotherapies, and Others), Route of Administration (Oral, Nasal, and Injectable) and Geography (North America, Europe, Asia, Rest of World (ROW))

  • Which regions are analyzed in the report?

    • North America, Europe, Asia and Rest of World (ROW)

  • What are the key growth drivers and market challenges?

    • Increasing prevalence of allergic disorders, Limited treatment adherence

  • Who are the major players in the Allergy Rhinitis Drugs Market?

    • ALK Abello AS, Apotex Inc., Bayer AG, Boehringer Ingelheim GmbH, Cadila Pharmaceuticals Ltd., Catalent Inc., Dr. Reddys Laboratories Ltd., Faes Farma, Glenmark Pharmaceuticals Ltd., Haleon Plc, Hikma Pharmaceuticals Plc, Kyorin Pharmaceutical Co. Ltd., Merck and Co. Inc., Mitsubishi Tanabe Pharma Corp., Novartis AG, Sanofi SA, Stallergenes Greer Ltd., Sun Pharmaceutical Industries and Viatris Inc.

Market Research Insights

  • The Allergy Rhinitis Drugs Market is rapidly evolving through the integration of digital health innovations and personalized care models. The rising adoption of digital symptom tracking applications has improved patient engagement, increasing therapeutic dose optimization accuracy by 24%. Concurrently, the expansion of telehealth prescription services has streamlined access to specialist consultations, reducing diagnostic delays by 19% across diverse urban centers.
  • These technological integrations empower healthcare providers to dynamically map regional allergy prevalence, ensuring localized inventory alignment. By leveraging these data-driven strategies, pharmaceutical distributors have decreased operational supply chain costs by 12%, directly enhancing patient access to targeted biological interventions and continuous symptom relief.

We can help! Our analysts can customize this allergy rhinitis drugs market research report to meet your requirements.

Get in touch

1. Executive Summary

1.1 Market overview

Executive Summary - Chart on Market Overview
Executive Summary - Data Table on Market Overview
Executive Summary - Chart on Global Market Characteristics
Executive Summary - Chart on Market by Geography
Executive Summary - Chart on Market Segmentation by Distribution Channel
Executive Summary - Chart on Market Segmentation by Product
Executive Summary - Chart on Market Segmentation by Route of Administration
Executive Summary - Chart on Incremental Growth
Executive Summary - Data Table on Incremental Growth
Executive Summary - Chart on Company Market Positioning

2. Technavio Analysis

2.1 Analysis of price sensitivity, lifecycle, customer purchase basket, adoption rates, and purchase criteria

2.2 Criticality of inputs and Factors of differentiation

Chart on Overview on criticality of inputs and factors of differentiation

2.3 Factors of disruption

Chart on Overview on factors of disruption

2.4 Impact of drivers and challenges

Chart on Impact of drivers and challenges in 2025 and 2030

3. Market Landscape

3.1 Market ecosystem

Chart on Parent Market
Data Table on - Parent Market

3.2 Market characteristics

Chart on Market characteristics analysis

3.3 Value chain analysis

Chart on Value chain analysis

4. Market Sizing

4.1 Market definition

Data Table on Offerings of companies included in the market definition

4.2 Market segment analysis

Market segments

4.3 Market size 2025

4.4 Market outlook: Forecast for 2025-2030

Chart on Global - Market size and forecast 2025-2030 ($ million)
Data Table on Global - Market size and forecast 2025-2030 ($ million)
Chart on Global Market: Year-over-year growth 2025-2030 (%)
Data Table on Global Market: Year-over-year growth 2025-2030 (%)

5. Historic Market Size

5.1 Global Allergy Rhinitis Drugs Market 2020 - 2024

Historic Market Size - Data Table on Global Allergy Rhinitis Drugs Market 2020 - 2024 ($ million)

5.2 Distribution Channel segment analysis 2020 - 2024

Historic Market Size - Distribution Channel Segment 2020 - 2024 ($ million)

5.3 Product segment analysis 2020 - 2024

Historic Market Size - Product Segment 2020 - 2024 ($ million)

5.4 Route of Administration segment analysis 2020 - 2024

Historic Market Size - Route of Administration Segment 2020 - 2024 ($ million)

5.5 Geography segment analysis 2020 - 2024

Historic Market Size - Geography Segment 2020 - 2024 ($ million)

5.6 Country segment analysis 2020 - 2024

Historic Market Size - Country Segment 2020 - 2024 ($ million)

6. Qualitative Analysis

6.1 Impact of AI on Global Allergy Rhinitis Drugs Market

6.2 Impact of geopolitical conflicts on Global Allergy Rhinitis Drugs Market

7. Five Forces Analysis

7.1 Five forces summary

Five forces analysis - Comparison between 2025 and 2030

7.2 Bargaining power of buyers

Bargaining power of buyers - Impact of key factors 2025 and 2030

7.3 Bargaining power of suppliers

Bargaining power of suppliers - Impact of key factors in 2025 and 2030

7.4 Threat of new entrants

Threat of new entrants - Impact of key factors in 2025 and 2030

7.5 Threat of substitutes

Threat of substitutes - Impact of key factors in 2025 and 2030

7.6 Threat of rivalry

Threat of rivalry - Impact of key factors in 2025 and 2030

7.7 Market condition

Chart on Market condition - Five forces 2025 and 2030

8. Market Segmentation by Distribution Channel

8.1 Market segments

Chart on Distribution Channel - Market share 2025-2030 (%)
Data Table on Distribution Channel - Market share 2025-2030 (%)

8.2 Comparison by Distribution Channel

Chart on Comparison by Distribution Channel
Data Table on Comparison by Distribution Channel

8.3 Offline - Market size and forecast 2025-2030

Chart on Offline - Market size and forecast 2025-2030 ($ million)
Data Table on Offline - Market size and forecast 2025-2030 ($ million)
Chart on Offline - Year-over-year growth 2025-2030 (%)
Data Table on Offline - Year-over-year growth 2025-2030 (%)

8.4 Online - Market size and forecast 2025-2030

Chart on Online - Market size and forecast 2025-2030 ($ million)
Data Table on Online - Market size and forecast 2025-2030 ($ million)
Chart on Online - Year-over-year growth 2025-2030 (%)
Data Table on Online - Year-over-year growth 2025-2030 (%)

8.5 Market opportunity by Distribution Channel

Market opportunity by Distribution Channel ($ million)
Data Table on Market opportunity by Distribution Channel ($ million)

9. Market Segmentation by Product

9.1 Market segments

Chart on Product - Market share 2025-2030 (%)
Data Table on Product - Market share 2025-2030 (%)

9.2 Comparison by Product

Chart on Comparison by Product
Data Table on Comparison by Product

9.3 Antihistamines - Market size and forecast 2025-2030

Chart on Antihistamines - Market size and forecast 2025-2030 ($ million)
Data Table on Antihistamines - Market size and forecast 2025-2030 ($ million)
Chart on Antihistamines - Year-over-year growth 2025-2030 (%)
Data Table on Antihistamines - Year-over-year growth 2025-2030 (%)

9.4 Intranasal corticosteroids - Market size and forecast 2025-2030

Chart on Intranasal corticosteroids - Market size and forecast 2025-2030 ($ million)
Data Table on Intranasal corticosteroids - Market size and forecast 2025-2030 ($ million)
Chart on Intranasal corticosteroids - Year-over-year growth 2025-2030 (%)
Data Table on Intranasal corticosteroids - Year-over-year growth 2025-2030 (%)

9.5 Immunotherapies - Market size and forecast 2025-2030

Chart on Immunotherapies - Market size and forecast 2025-2030 ($ million)
Data Table on Immunotherapies - Market size and forecast 2025-2030 ($ million)
Chart on Immunotherapies - Year-over-year growth 2025-2030 (%)
Data Table on Immunotherapies - Year-over-year growth 2025-2030 (%)

9.6 Others - Market size and forecast 2025-2030

Chart on Others - Market size and forecast 2025-2030 ($ million)
Data Table on Others - Market size and forecast 2025-2030 ($ million)
Chart on Others - Year-over-year growth 2025-2030 (%)
Data Table on Others - Year-over-year growth 2025-2030 (%)

9.7 Market opportunity by Product

Market opportunity by Product ($ million)
Data Table on Market opportunity by Product ($ million)

10. Market Segmentation by Route of Administration

10.1 Market segments

Chart on Route of Administration - Market share 2025-2030 (%)
Data Table on Route of Administration - Market share 2025-2030 (%)

10.2 Comparison by Route of Administration

Chart on Comparison by Route of Administration
Data Table on Comparison by Route of Administration

10.3 Oral - Market size and forecast 2025-2030

Chart on Oral - Market size and forecast 2025-2030 ($ million)
Data Table on Oral - Market size and forecast 2025-2030 ($ million)
Chart on Oral - Year-over-year growth 2025-2030 (%)
Data Table on Oral - Year-over-year growth 2025-2030 (%)

10.4 Nasal - Market size and forecast 2025-2030

Chart on Nasal - Market size and forecast 2025-2030 ($ million)
Data Table on Nasal - Market size and forecast 2025-2030 ($ million)
Chart on Nasal - Year-over-year growth 2025-2030 (%)
Data Table on Nasal - Year-over-year growth 2025-2030 (%)

10.5 Injectable - Market size and forecast 2025-2030

Chart on Injectable - Market size and forecast 2025-2030 ($ million)
Data Table on Injectable - Market size and forecast 2025-2030 ($ million)
Chart on Injectable - Year-over-year growth 2025-2030 (%)
Data Table on Injectable - Year-over-year growth 2025-2030 (%)

10.6 Market opportunity by Route of Administration

Market opportunity by Route of Administration ($ million)
Data Table on Market opportunity by Route of Administration ($ million)

11. Customer Landscape

11.1 Customer landscape overview

Analysis of price sensitivity, lifecycle, customer purchase basket, adoption rates, and purchase criteria

12. Geographic Landscape

12.1 Geographic segmentation

Chart on Market share by geography 2025-2030 (%)
Data Table on Market share by geography 2025-2030 (%)

12.2 Geographic comparison

Chart on Geographic comparison
Data Table on Geographic comparison

12.3 North America - Market size and forecast 2025-2030

Chart on North America - Market size and forecast 2025-2030 ($ million)
Data Table on North America - Market size and forecast 2025-2030 ($ million)
Chart on North America - Year-over-year growth 2025-2030 (%)
Data Table on North America - Year-over-year growth 2025-2030 (%)
Chart on Regional Comparison - North America
Data Table on Regional Comparison - North America

12.3.1 US - Market size and forecast 2025-2030

Chart on US - Market size and forecast 2025-2030 ($ million)
Data Table on US - Market size and forecast 2025-2030 ($ million)
Chart on US - Year-over-year growth 2025-2030 (%)
Data Table on US - Year-over-year growth 2025-2030 (%)

12.3.2 Canada - Market size and forecast 2025-2030

Chart on Canada - Market size and forecast 2025-2030 ($ million)
Data Table on Canada - Market size and forecast 2025-2030 ($ million)
Chart on Canada - Year-over-year growth 2025-2030 (%)
Data Table on Canada - Year-over-year growth 2025-2030 (%)

12.3.3 Mexico - Market size and forecast 2025-2030

Chart on Mexico - Market size and forecast 2025-2030 ($ million)
Data Table on Mexico - Market size and forecast 2025-2030 ($ million)
Chart on Mexico - Year-over-year growth 2025-2030 (%)
Data Table on Mexico - Year-over-year growth 2025-2030 (%)

12.4 Europe - Market size and forecast 2025-2030

Chart on Europe - Market size and forecast 2025-2030 ($ million)
Data Table on Europe - Market size and forecast 2025-2030 ($ million)
Chart on Europe - Year-over-year growth 2025-2030 (%)
Data Table on Europe - Year-over-year growth 2025-2030 (%)
Chart on Regional Comparison - Europe
Data Table on Regional Comparison - Europe

12.4.1 Germany - Market size and forecast 2025-2030

Chart on Germany - Market size and forecast 2025-2030 ($ million)
Data Table on Germany - Market size and forecast 2025-2030 ($ million)
Chart on Germany - Year-over-year growth 2025-2030 (%)
Data Table on Germany - Year-over-year growth 2025-2030 (%)

12.4.2 UK - Market size and forecast 2025-2030

Chart on UK - Market size and forecast 2025-2030 ($ million)
Data Table on UK - Market size and forecast 2025-2030 ($ million)
Chart on UK - Year-over-year growth 2025-2030 (%)
Data Table on UK - Year-over-year growth 2025-2030 (%)

12.4.3 France - Market size and forecast 2025-2030

Chart on France - Market size and forecast 2025-2030 ($ million)
Data Table on France - Market size and forecast 2025-2030 ($ million)
Chart on France - Year-over-year growth 2025-2030 (%)
Data Table on France - Year-over-year growth 2025-2030 (%)

12.4.4 Italy - Market size and forecast 2025-2030

Chart on Italy - Market size and forecast 2025-2030 ($ million)
Data Table on Italy - Market size and forecast 2025-2030 ($ million)
Chart on Italy - Year-over-year growth 2025-2030 (%)
Data Table on Italy - Year-over-year growth 2025-2030 (%)

12.4.5 Spain - Market size and forecast 2025-2030

Chart on Spain - Market size and forecast 2025-2030 ($ million)
Data Table on Spain - Market size and forecast 2025-2030 ($ million)
Chart on Spain - Year-over-year growth 2025-2030 (%)
Data Table on Spain - Year-over-year growth 2025-2030 (%)

12.4.6 The Netherlands - Market size and forecast 2025-2030

Chart on The Netherlands - Market size and forecast 2025-2030 ($ million)
Data Table on The Netherlands - Market size and forecast 2025-2030 ($ million)
Chart on The Netherlands - Year-over-year growth 2025-2030 (%)
Data Table on The Netherlands - Year-over-year growth 2025-2030 (%)

12.5 Asia - Market size and forecast 2025-2030

Chart on Asia - Market size and forecast 2025-2030 ($ million)
Data Table on Asia - Market size and forecast 2025-2030 ($ million)
Chart on Asia - Year-over-year growth 2025-2030 (%)
Data Table on Asia - Year-over-year growth 2025-2030 (%)
Chart on Regional Comparison - Asia
Data Table on Regional Comparison - Asia

12.5.1 China - Market size and forecast 2025-2030

Chart on China - Market size and forecast 2025-2030 ($ million)
Data Table on China - Market size and forecast 2025-2030 ($ million)
Chart on China - Year-over-year growth 2025-2030 (%)
Data Table on China - Year-over-year growth 2025-2030 (%)

12.5.2 Japan - Market size and forecast 2025-2030

Chart on Japan - Market size and forecast 2025-2030 ($ million)
Data Table on Japan - Market size and forecast 2025-2030 ($ million)
Chart on Japan - Year-over-year growth 2025-2030 (%)
Data Table on Japan - Year-over-year growth 2025-2030 (%)

12.5.3 India - Market size and forecast 2025-2030

Chart on India - Market size and forecast 2025-2030 ($ million)
Data Table on India - Market size and forecast 2025-2030 ($ million)
Chart on India - Year-over-year growth 2025-2030 (%)
Data Table on India - Year-over-year growth 2025-2030 (%)

12.5.4 South Korea - Market size and forecast 2025-2030

Chart on South Korea - Market size and forecast 2025-2030 ($ million)
Data Table on South Korea - Market size and forecast 2025-2030 ($ million)
Chart on South Korea - Year-over-year growth 2025-2030 (%)
Data Table on South Korea - Year-over-year growth 2025-2030 (%)

12.5.5 Indonesia - Market size and forecast 2025-2030

Chart on Indonesia - Market size and forecast 2025-2030 ($ million)
Data Table on Indonesia - Market size and forecast 2025-2030 ($ million)
Chart on Indonesia - Year-over-year growth 2025-2030 (%)
Data Table on Indonesia - Year-over-year growth 2025-2030 (%)

12.5.6 Thailand - Market size and forecast 2025-2030

Chart on Thailand - Market size and forecast 2025-2030 ($ million)
Data Table on Thailand - Market size and forecast 2025-2030 ($ million)
Chart on Thailand - Year-over-year growth 2025-2030 (%)
Data Table on Thailand - Year-over-year growth 2025-2030 (%)

12.6 Rest of World (ROW) - Market size and forecast 2025-2030

Chart on Rest of World (ROW) - Market size and forecast 2025-2030 ($ million)
Data Table on Rest of World (ROW) - Market size and forecast 2025-2030 ($ million)
Chart on Rest of World (ROW) - Year-over-year growth 2025-2030 (%)
Data Table on Rest of World (ROW) - Year-over-year growth 2025-2030 (%)
Chart on Regional Comparison - Rest of World (ROW)
Data Table on Regional Comparison - Rest of World (ROW)

12.6.1 Brazil - Market size and forecast 2025-2030

Chart on Brazil - Market size and forecast 2025-2030 ($ million)
Data Table on Brazil - Market size and forecast 2025-2030 ($ million)
Chart on Brazil - Year-over-year growth 2025-2030 (%)
Data Table on Brazil - Year-over-year growth 2025-2030 (%)

12.6.2 Saudi Arabia - Market size and forecast 2025-2030

Chart on Saudi Arabia - Market size and forecast 2025-2030 ($ million)
Data Table on Saudi Arabia - Market size and forecast 2025-2030 ($ million)
Chart on Saudi Arabia - Year-over-year growth 2025-2030 (%)
Data Table on Saudi Arabia - Year-over-year growth 2025-2030 (%)

12.6.3 South Africa - Market size and forecast 2025-2030

Chart on South Africa - Market size and forecast 2025-2030 ($ million)
Data Table on South Africa - Market size and forecast 2025-2030 ($ million)
Chart on South Africa - Year-over-year growth 2025-2030 (%)
Data Table on South Africa - Year-over-year growth 2025-2030 (%)

12.6.4 UAE - Market size and forecast 2025-2030

Chart on UAE - Market size and forecast 2025-2030 ($ million)
Data Table on UAE - Market size and forecast 2025-2030 ($ million)
Chart on UAE - Year-over-year growth 2025-2030 (%)
Data Table on UAE - Year-over-year growth 2025-2030 (%)

12.6.5 Argentina - Market size and forecast 2025-2030

Chart on Argentina - Market size and forecast 2025-2030 ($ million)
Data Table on Argentina - Market size and forecast 2025-2030 ($ million)
Chart on Argentina - Year-over-year growth 2025-2030 (%)
Data Table on Argentina - Year-over-year growth 2025-2030 (%)

12.6.6 Colombia - Market size and forecast 2025-2030

Chart on Colombia - Market size and forecast 2025-2030 ($ million)
Data Table on Colombia - Market size and forecast 2025-2030 ($ million)
Chart on Colombia - Year-over-year growth 2025-2030 (%)
Data Table on Colombia - Year-over-year growth 2025-2030 (%)

12.6.7 Turkey - Market size and forecast 2025-2030

Chart on Turkey - Market size and forecast 2025-2030 ($ million)
Data Table on Turkey - Market size and forecast 2025-2030 ($ million)
Chart on Turkey - Year-over-year growth 2025-2030 (%)
Data Table on Turkey - Year-over-year growth 2025-2030 (%)

12.6.8 Israel - Market size and forecast 2025-2030

Chart on Israel - Market size and forecast 2025-2030 ($ million)
Data Table on Israel - Market size and forecast 2025-2030 ($ million)
Chart on Israel - Year-over-year growth 2025-2030 (%)
Data Table on Israel - Year-over-year growth 2025-2030 (%)

12.7 Market opportunity by geography

Market opportunity by geography ($ million)
Data Tables on Market opportunity by geography ($ million)

13. Drivers, Challenges, and Opportunity

13.1 Market drivers

Increasing prevalence of allergic disorders
Advancements in therapeutic innovation
Expansion of healthcare awareness and access

13.2 Market challenges

Limited treatment adherence
Pricing pressure and reimbursement limitations
Diagnostic variability and disease underrecognition

13.3 Impact of drivers and challenges

Impact of drivers and challenges in 2025 and 2030

13.4 Market opportunities

Growing shift toward biologic based therapies
Expansion of combination therapy adoption
Digital integration in allergy management pathways

14. Competitive Landscape

14.1 Overview

14.2

Overview on criticality of inputs and factors of differentiation

14.3 Landscape disruption

Overview on factors of disruption

14.4 Industry risks

Impact of key risks on business

15. Competitive Analysis

15.1 Companies profiled

Companies covered

15.2 Company ranking index

15.3 Market positioning of companies

Matrix on companies position and classification

15.4 ALK Abello AS

ALK Abello AS - Overview
ALK Abello AS - Product / Service
ALK Abello AS - Key offerings
SWOT

15.5 Bayer AG

Bayer AG - Overview
Bayer AG - Business segments
Bayer AG - Key news
Bayer AG - Key offerings
Bayer AG - Segment focus
SWOT

15.6 Dr. Reddys Laboratories Ltd.

Dr. Reddys Laboratories Ltd. - Overview
Dr. Reddys Laboratories Ltd. - Business segments
Dr. Reddys Laboratories Ltd. - Key news
Dr. Reddys Laboratories Ltd. - Key offerings
Dr. Reddys Laboratories Ltd. - Segment focus
SWOT

15.7 Faes Farma

Faes Farma - Overview
Faes Farma - Product / Service
Faes Farma - Key offerings
SWOT

15.8 Glenmark Pharmaceuticals Ltd.

Glenmark Pharmaceuticals Ltd. - Overview
Glenmark Pharmaceuticals Ltd. - Product / Service
Glenmark Pharmaceuticals Ltd. - Key news
Glenmark Pharmaceuticals Ltd. - Key offerings
SWOT

15.9 Haleon Plc

Haleon Plc - Overview
Haleon Plc - Business segments
Haleon Plc - Key offerings
Haleon Plc - Segment focus
SWOT

15.10 Hikma Pharmaceuticals Plc

Hikma Pharmaceuticals Plc - Overview
Hikma Pharmaceuticals Plc - Business segments
Hikma Pharmaceuticals Plc - Key news
Hikma Pharmaceuticals Plc - Key offerings
Hikma Pharmaceuticals Plc - Segment focus
SWOT

15.11 Kyorin Pharmaceutical Co. Ltd.

Kyorin Pharmaceutical Co. Ltd. - Overview
Kyorin Pharmaceutical Co. Ltd. - Product / Service
Kyorin Pharmaceutical Co. Ltd. - Key offerings
SWOT

15.12 Merck and Co. Inc.

Merck and Co. Inc. - Overview
Merck and Co. Inc. - Business segments
Merck and Co. Inc. - Key news
Merck and Co. Inc. - Key offerings
Merck and Co. Inc. - Segment focus
SWOT

15.13 Mitsubishi Tanabe Pharma Corp.

Mitsubishi Tanabe Pharma Corp. - Overview
Mitsubishi Tanabe Pharma Corp. - Product / Service
Mitsubishi Tanabe Pharma Corp. - Key offerings
SWOT

15.14 Novartis AG

Novartis AG - Overview
Novartis AG - Business segments
Novartis AG - Key news
Novartis AG - Key offerings
Novartis AG - Segment focus
SWOT

15.15 Sanofi SA

Sanofi SA - Overview
Sanofi SA - Business segments
Sanofi SA - Key news
Sanofi SA - Key offerings
Sanofi SA - Segment focus
SWOT

15.16 Stallergenes Greer Ltd.

Stallergenes Greer Ltd. - Overview
Stallergenes Greer Ltd. - Product / Service
Stallergenes Greer Ltd. - Key offerings
SWOT

15.17 Sun Pharmaceutical Industries

Sun Pharmaceutical Industries - Overview
Sun Pharmaceutical Industries - Business segments
Sun Pharmaceutical Industries - Key news
Sun Pharmaceutical Industries - Key offerings
Sun Pharmaceutical Industries - Segment focus
SWOT

15.18 Viatris Inc.

Viatris Inc. - Overview
Viatris Inc. - Business segments
Viatris Inc. - Key news
Viatris Inc. - Key offerings
Viatris Inc. - Segment focus
SWOT

16. Appendix

16.1 Scope of the report

Market definition
Objectives
Notes and caveats

16.2 Inclusions and exclusions checklist

Inclusions checklist
Exclusions checklist

16.3 Currency conversion rates for US$

16.4 Research methodology

16.5 Data procurement

Information sources

16.6 Data validation

16.7 Validation techniques employed for market sizing

16.8 Data synthesis

16.9 360 degree market analysis

16.10 List of abbreviations

Research Methodology

Technavio presents a detailed picture of the market by way of study, synthesis, and summation of data from multiple sources. The analysts have presented the various facets of the market with a particular focus on identifying the key industry influencers. The data thus presented is comprehensive, reliable, and the result of extensive research, both primary and secondary.

INFORMATION SOURCES

Primary sources

  • Manufacturers and suppliers
  • Channel partners
  • Industry experts
  • Strategic decision makers

Secondary sources

  • Industry journals and periodicals
  • Government data
  • Financial reports of key industry players
  • Historical data
  • Press releases

DATA ANALYSIS

Data Synthesis

  • Collation of data
  • Estimation of key figures
  • Analysis of derived insights

Data Validation

  • Triangulation with data models
  • Reference against proprietary databases
  • Corroboration with industry experts

REPORT WRITING

Qualitative

  • Market drivers
  • Market challenges
  • Market trends
  • Five forces analysis

Quantitative

  • Market size and forecast
  • Market segmentation
  • Geographical insights
  • Competitive landscape

Interested in this report?

Get your sample now to see our research methodology and insights!

Download Now

Frequently Asked Questions

Allergy Rhinitis Drugs market growth will increase by USD 4785.3 million during 2026-2030.

The Allergy Rhinitis Drugs market is expected to grow at a CAGR of 4.8% during 2026-2030.

Allergy Rhinitis Drugs market is segmented by Distribution channel (Offline, Online) Product (Antihistamines, Intranasal corticosteroids, Immunotherapies, Others) Route of administration (Oral, Nasal, Injectable)

ALK Abello AS, Apotex Inc., Bayer AG, Boehringer Ingelheim GmbH, Cadila Pharmaceuticals Ltd., Catalent Inc., Dr. Reddys Laboratories Ltd., Faes Farma, Glenmark Pharmaceuticals Ltd., Haleon Plc, Hikma Pharmaceuticals Plc, Kyorin Pharmaceutical Co. Ltd., Merck and Co. Inc., Mitsubishi Tanabe Pharma Corp., Novartis AG, Sanofi SA, Stallergenes Greer Ltd., Sun Pharmaceutical Industries, Viatris Inc. are a few of the key vendors in the Allergy Rhinitis Drugs market.

North America will register the highest growth rate of 37.5% among the other regions. Therefore, the Allergy Rhinitis Drugs market in North America is expected to garner significant business opportunities for the vendors during the forecast period.

US, Canada, Mexico, Germany, UK, France, Italy, Spain, The Netherlands, China, Japan, India, South Korea, Indonesia, Thailand, Brazil, Saudi Arabia, South Africa, UAE, Argentina, Colombia, Turkey, Israel

  • Increasing prevalence of allergic disorders is the driving factor this market.

The Allergy Rhinitis Drugs market vendors should focus on grabbing business opportunities from the Distribution channel segment as it accounted for the largest market share in the base year.
RIA - Research AI Assistant
Ask RIA
