Aloe Vera Extracts Market Size 2025-2029
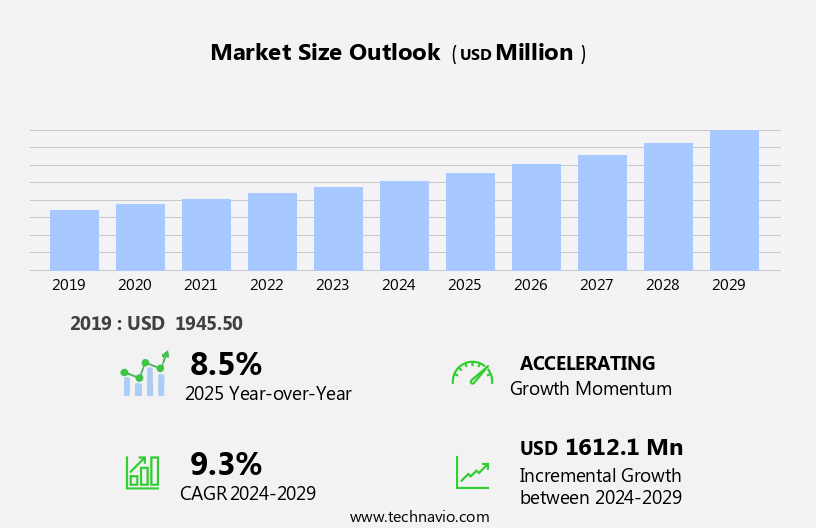
The aloe vera extracts market size is forecast to increase by USD 1.61 billion at a CAGR of 9.3% between 2024 and 2029.
- The market is witnessing significant growth due to several key trends. One of the primary factors driving market growth is the increasing preference for the Mediterranean diet, which includes the consumption of aloe vera for its numerous health benefits. Additionally, rising awareness regarding the medicinal properties of aloe vera is fueling market demand. The market is expanding as consumers seek products enriched with flaxseed oil and omega-3 fatty acids for their added skin-nourishing and anti-inflammatory benefits. However, quality control and supply chain issues remain challenges for market participants. Ensuring consistent product quality and maintaining a reliable supply chain are crucial for market success. Producers must focus on implementing stringent quality control measures and establishing strong supply chain networks to meet the growing demand for aloe vera extracts.
What will be the Size of the Aloe Vera Extracts Market During the Forecast Period?
- The global market for extracts from the succulent plant, specifically those belonging to the Aloe vera genus, has experienced significant growth in recent years. This trend is driven by the versatile applications of Aloe vera extracts in various industries, including food, medicinal use, and cosmetics. The tropical plant's leaves yield extracts in the form of powders, gels, capsules, drinks, concentrates, and supplements. In the cosmetics industry, Aloe vera extracts are sought after for their hydrating properties, making them a popular ingredient in natural beauty products and skincare routines. Medicinal uses of Aloe vera extracts include the treatment of various health conditions such as hepatitis, diabetes, osteoarthritis, inflammatory bowel diseases, asthma, fever, and stomach ulcers.
- Additionally, Aloe vera extracts are used as probiotics for digestion and natural health remedies. The natural ingredients found in Aloe vera, including acetylated mannan and poly mannan, contribute to its numerous benefits. The demand for organic beauty, healthy foods, and personal care products has further fueled the growth of the market.
How is this Aloe Vera Extracts Industry segmented and which is the largest segment?
The industry research report provides comprehensive data (region-wise segment analysis), with forecasts and estimates in "USD million" for the period 2025-2029, as well as historical data from 2019-2023 for the following segments.
- Distribution Channel
- Offline
- Online
- Application
- Cosmetics
- Pharmaceuticals
- Food and beverages
- Form Factor
- Liquid
- Gel
- Powder
- Others
- Geography
- APAC
- China
- India
- Japan
- South Korea
- North America
- Canada
- US
- Europe
- Germany
- UK
- France
- Italy
- South America
- Middle East and Africa
- APAC
By Distribution Channel Insights
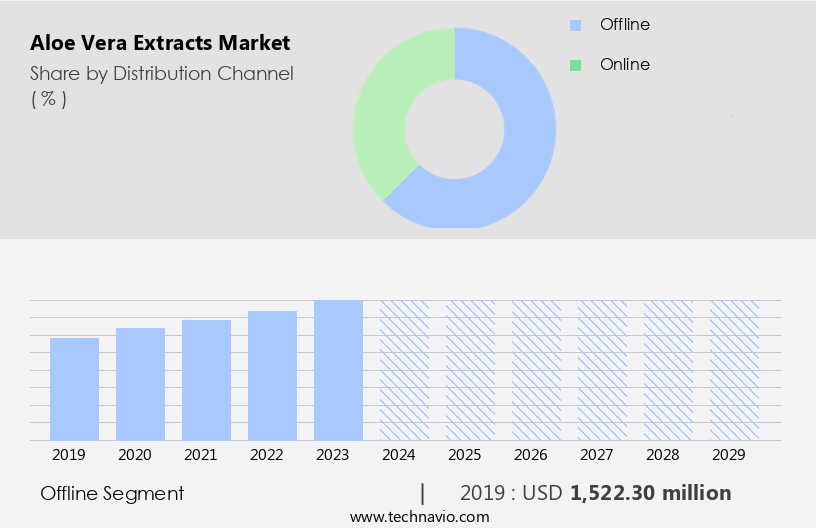
- The offline segment is estimated to witness significant growth during the forecast period.
Aloe Vera extract, derived from the succulent plant of the genus Aloe, is a highly sought-after ingredient in various industries due to its health benefits and versatile applications. The offline distribution segment holds the largest market share, with traditional channels such as grocery stores, pharmacies, specialized shops, and beauty salons dominating sales. Consumers continue to prefer purchasing aloe extracts in person for their familiarity and trust in these establishments. Key active ingredients include acetylated mannan and poly mannan, found in the inner portion of the aloe leaves. Aloe extracts are used in cosmetics for their skin hydrating and anti-inflammatory properties, in pharmaceuticals for treating burns, skin irritations, and digestive health, and in food and beverages for their natural sweetness and nutritional value.
The cosmetics industry utilizes aloe extracts in powders, gels, capsules, and drinks, while pharmaceutical applications include concentrates and supplements. The rising awareness of healthy lifestyles and natural ingredients has fueled demand for aloe extracts in skincare products, anti-aging remedies, and plant-based drinks. Despite the growth of e-commerce, the offline distribution segment's extensive reach and loyal customer base ensure its continued dominance.
Get a glance at the market report of share of various segments Request Free Sample
The Offline segment was valued at USD 1.52 billion in 2019 and showed a gradual increase during the forecast period.
Regional Analysis
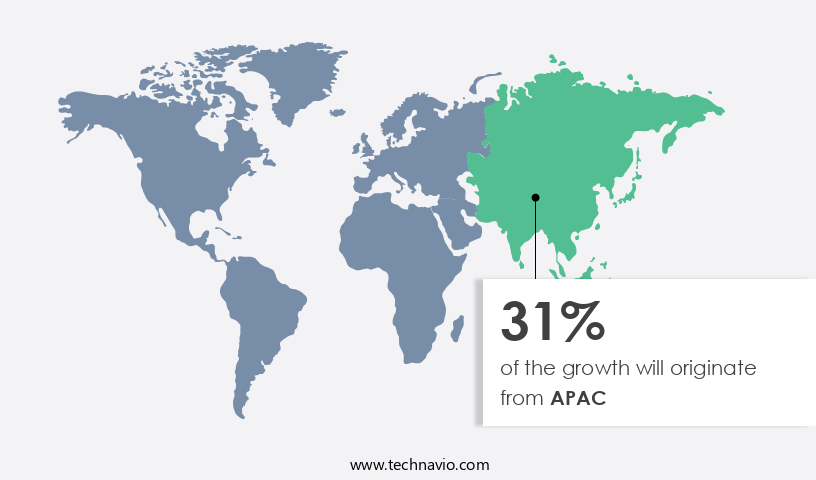
- APAC is estimated to contribute 31% to the growth of the global market during the forecast period.
Technavio's analysts have elaborately explained the regional trends and drivers that shape the market during the forecast period.
For more insights on the market size of various regions, Request Free Sample
The Asia-Pacific (APAC) region dominates the market, accounting for the largest share in 2024. Key contributors include China, India, Japan, and Australia, driven by rising consumer awareness of aloe vera's health benefits and its extensive use in cosmetics. Aloe vera extracts are utilized in various industries, including food, pharmaceuticals, and cosmetics. In the cosmetics industry, they are incorporated into skincare products, cosmetics, and personal care items as gels, powders, capsules, drinks, concentrates, and supplements.
The extracts are rich in active ingredients, such as acetylated mannan, poly mannan, and alkaloids, which offer skin health benefits, including anti-inflammatory, hydrating, and anti-aging properties. Additionally, aloe vera extracts are used to treat various skin conditions, such as burns, skin irritations, and inflammation, as well as digestive health issues and immune system support. Consumer preferences for natural, organic, and clean beauty products have further boosted market growth. The market is expected to continue expanding, driven by the rising awareness of the health benefits of this versatile plant and its applications in food and beverages, skincare products, and pharmaceuticals.
Market Dynamics
Our researchers analyzed the data with 2024 as the base year, along with the key drivers, trends, and challenges. A holistic analysis of drivers will help companies refine their marketing strategies to gain a competitive advantage.
What are the key market drivers leading to the rise In the adoption of Aloe Vera Extracts Industry?
Increasing preference in mediterranean diet is the key driver of the market.
- Aloe Vera extracts derived from the succulent plant of the genus Aloe are widely used in various industries for food, medicinal purposes, and cosmetic applications. The tropical plant's leaves contain active ingredients like acetylated mannan, poly mannan, and alkaloids, which offer skin health benefits, including anti-inflammatory, hydrating, and anti-aging properties. In the cosmetics industry, Aloe Vera extracts are used in powders, gels, capsules, drinks, concentrates, and supplements to promote healthy skin growth, soothe burns and skin irritations, and boost immunity. The natural ingredient is also used in skincare products, lotions, and liquid extracts for its moisturizing and soothing properties. In the food and beverage sector, Aloe Vera extracts are used in natural, zero sugar beverages, aloe-based drinks, and ketones to cater to consumer preferences for healthy lifestyle-related products.
- The complex processing method ensures the extraction of the inner portion of the leaves, preserving the therapeutic properties of the plant. The extracts have applications in pharmaceuticals for treating diseases such as Hepatitis, Diabetes, Osteoarthritis, Inflammatory bowel diseases, Asthma, Fever, Stomach ulcers, Itching, HIV/AIDS, Cancer, Interstitial Cystitis (IC), and skin conditions. Herbal extracts and skin creams also use Aloe Vera extracts for their hydration, hydrating properties, and anti-inflammatory benefits. The increasing awareness of the health benefits of natural ingredients and the growing demand for organic products have led to the rise of Aloe Vera extracts in the market. The market dynamics include price fluctuations, product differentiation, and targeted marketing to cater to various consumer needs and preferences.
What are the market trends shaping the Aloe Vera Extracts Industry?
Rising awareness of medicinal properties of aloe vera is the upcoming market trend.
- The global market is witnessing notable expansion due to escalating consumer awareness regarding the health benefits of this succulent plant from the genus Aloe. Aloe vera's medicinal uses span various sectors, including food, cosmetic purposes, and pharmaceuticals. Its active ingredients, such as acetylated mannan and poly mannan, are found primarily in the inner portion of the leaves. In the cosmetics industry, aloe vera extracts are utilized in powders, gels, capsules, and drinks, catering to the preferences of health-conscious consumers. Aloe vera's therapeutic properties extend to skin health, addressing issues like inflammation, burns, skin irritations, and promoting healthy skin growth.
- In the pharmaceutical sector, it is used to treat diseases like Hepatitis, Diabetes, Osteoarthritis, Inflammatory bowel diseases, Asthma, Fever, Stomach ulcers, Itching, HIV/AIDS, and Cancer. The natural ingredient's popularity is fueled by the increasing trend towards clean beauty, zero sugar beverages, and organic ingredients. Consumers are increasingly seeking natural remedies for lifestyle-related health issues, such as digestion and healthy food, and personal hygiene. Aloe vera extracts are also used in organic skincare and personal care products, including moisturizers, lotions, and liquid extracts. The market's growth is driven by the rising awareness of aloe vera's health benefits, its versatility across industries, and the increasing demand for natural and organic products.
What challenges does the Aloe Vera Extracts Industry face during its growth?
Quality control and supply chain issues is a key challenge affecting the industry growth.
- Aloe vera extracts are derived from the succulent plant of the genus Aloe, primarily found in tropical and subtropical areas. These extracts hold significant value in various industries, including food, medicinal use, and cosmetic purposes. The market demand for aloe vera extracts is increasing due to their active ingredients, such as acetylated mannan and poly mannan, which offer skin health benefits, including anti-inflammatory, hydrating, and anti-aging properties. However, ensuring consistent quality control is a challenge due to the variability of aloe plants and the intricate extraction processes. Stringent measures, including testing for purity, strength, and absence of impurities, are necessary to meet industry standards.
- Supply chain challenges also persist, as the demand for aloe vera extracts grows in pharmaceuticals, cosmetics, and food and beverage industries. Ensuring a well-functioning supply chain is crucial to maintaining the integrity and availability of these valuable extracts. Aloe vera extracts have numerous applications, including in the cosmetics industry products like powders, gels, capsules, and drinks, as well as in pharmaceuticals for conditions such as burns, skin irritations, digestive health, and immune system support. In the cosmetics industry, aloe vera extracts are used in skincare products, anti-aging remedies, and plant-based drinks. They offer hydrating, soothing, and moisturizing properties, making them a popular choice for organic skincare, personal care, and even zero sugar beverages.
Exclusive Customer Landscape
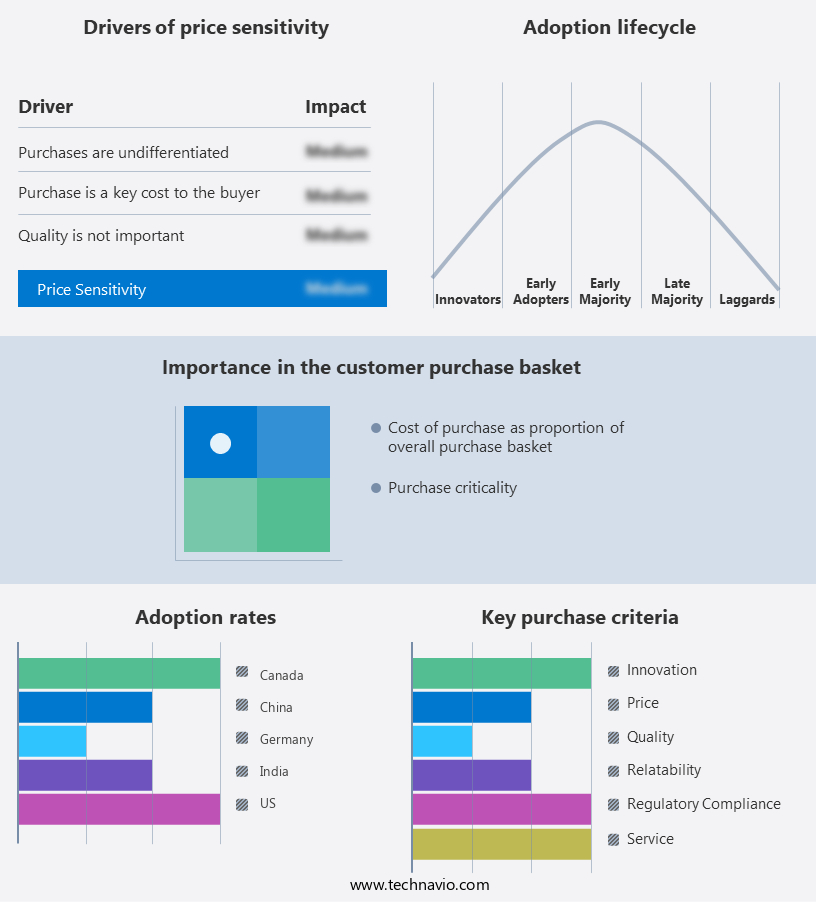
The market forecasting report includes the adoption lifecycle of the market, covering from the innovator's stage to the laggard's stage. It focuses on adoption rates in different regions based on penetration. Furthermore, the market report also includes key purchase criteria and drivers of price sensitivity to help companies evaluate and develop their market growth analysis strategies.
Customer Landscape
Key Companies & Market Insights
Companies are implementing various strategies, such as strategic alliances, market forecast, partnerships, mergers and acquisitions, geographical expansion, and product/service launches, to enhance their presence in the industry.
Alogenic: The company offers aloe vera extracts such as Aloe premium high quality juice powder 200, Cosmetic pure aloe juice, and Organic aloe juice.
The industry research and growth report includes detailed analyses of the competitive landscape of the market and information about key companies, including:
- Aloecorp Inc.
- Alogenic
- Alpspure Lifesciences Pvt. Ltd.
- Anwel Life Sciences Pvt. Ltd.
- AOS Products Pvt. Ltd.
- Arkure Health Care
- ASM Pharmaceuticals and RD Center
- Botanic Healthcare Group
- Changsha Vigorous Tech Co. Ltd.
- Forever Living Products International LLC
- Herbal Creations
- Herboil Chem
- HOAP Industries
- Medikonda Nutrients
- Natura Biotechnol Pvt. Ltd.
- Phyto Life Sciences P. Ltd.
- Power Health Products Ltd.
- Rudra Shakti Herbs Pvt. Ltd.
- Terry Laboratories LLC
- Vive Cosmetics
Qualitative and quantitative analysis of companies has been conducted to help clients understand the wider business environment as well as the strengths and weaknesses of key industry players. Data is qualitatively analyzed to categorize companies as pure play, category-focused, industry-focused, and diversified; it is quantitatively analyzed to categorize companies as dominant, leading, strong, tentative, and weak.
Research Analyst Overview
The succulent plant, belonging to the genus Aloe, is a popular choice in tropical areas due to its various applications in food, medicinal use, and cosmetic purposes. The extracts derived from the succulent's leaves have gained significant attention in recent years, particularly in the health and wellness industry. These extracts, which can be found in various forms such as powders, gels, capsules, drinks, concentrates, and supplements, offer numerous health benefits. The market is witnessing a rise in demand due to increasing consumer preferences for natural ingredients in their personal care and food products. The cosmetics industry is a significant consumer of these extracts, with their use in skincare products being particularly popular.
Moreover, the gel extracts and whole leaf extracts are widely used in the production of cosmetics, as they provide hydrating and soothing properties. They contain several active ingredients, including acetylated mannan and poly mannan, which contribute to their therapeutic properties. These extracts have been used to treat various skin conditions, such as burns, skin irritations, and inflammation. The market is experiencing growth as consumers increasingly favor products that combine aloe vera with olive oil, aligning with the rising demand for clean beauty and natural skincare solutions. They also offer benefits for digestive health and the immune system, making them a popular ingredient in health supplements and zero sugar beverages. The natural ingredient's anti-inflammatory and antioxidant properties make it an attractive addition to a wide range of products, from skincare products and lotions to personal hygiene items and natural remedies.
|
Market Scope |
|
|
Report Coverage |
Details |
|
Page number |
201 |
|
Base year |
2024 |
|
Historic period |
2019-2023 |
|
Forecast period |
2025-2029 |
|
Growth momentum & CAGR |
Accelerate at a CAGR of 9.3% |
|
Market growth 2025-2029 |
USD 1.61 billion |
|
Market structure |
Fragmented |
|
YoY growth 2024-2025(%) |
8.5 |
|
Key countries |
US, China, Japan, Canada, India, UK, Germany, South Korea, Italy, and France |
|
Competitive landscape |
Leading Companies, Market Positioning of Companies, Competitive Strategies, and Industry Risks |
What are the Key Data Covered in this Market Research and Growth Report?
- CAGR of the industry during the forecast period
- Detailed information on factors that will drive the market growth and forecasting between 2025 and 2029
- Precise estimation of the size of the market and its contribution of the industry in focus to the parent market
- Accurate predictions about upcoming growth and trends and changes in consumer behaviour
- Growth of the market across APAC, North America, Europe, South America, and Middle East and Africa
- Thorough analysis of the market's competitive landscape and detailed information about companies
- Comprehensive analysis of factors that will challenge the market growth of industry companies
We can help! Our analysts can customize this market research report to meet your requirements.
 RIA -
RIA - 
