India Aluminum Casting Market Size 2025-2029
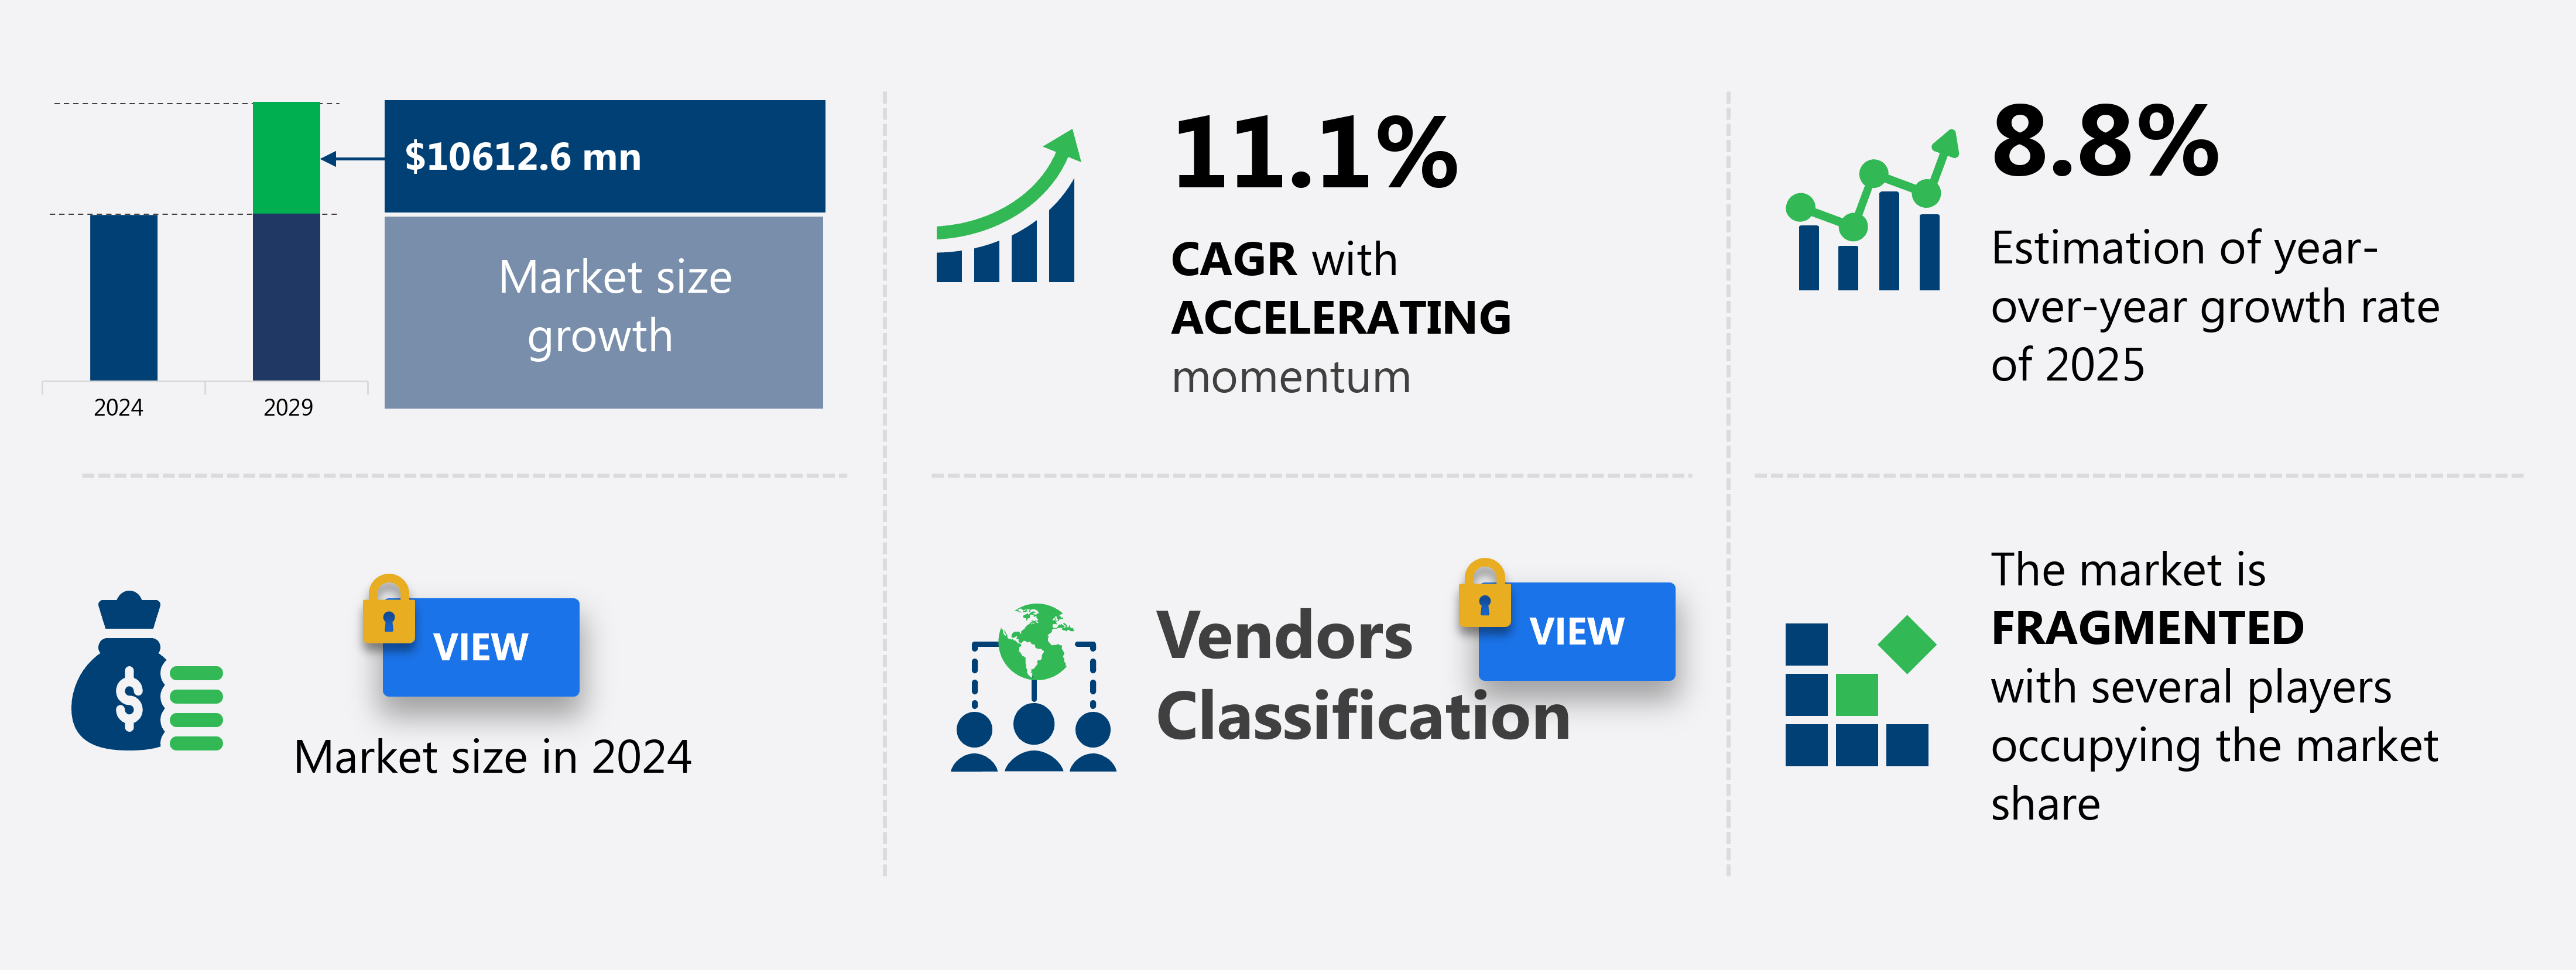
The India aluminum casting market size is forecast to increase by USD 10.61 billion at a CAGR of 11.1% between 2024 and 2029.
- The market is experiencing significant growth, driven by the increasing demand for aluminum in various industries. In the construction sector, the use of aluminum casting in constructing buildings and infrastructure is on the rise due to its lightweight and durability. Additionally, the renewable energy sector, particularly wind energy, is a key consumer of aluminum castings, as they are essential components in wind turbines. The automotive industry is another major market for aluminum casting, with the growing trend towards lightweight vehicles. However, the market is also facing challenges, including the volatility in raw material prices, which can impact the profitability of aluminum casting manufacturers.
- Furthermore, the emergence of alternative materials, such as steel and hydrogen, may pose a threat to the market's growth. The adoption of energy-efficient technologies, such as LED lighting, is expected to match the increasing demand for aluminum castings in various applications. In summary, the market is poised for growth due to its applications in various industries, but faces challenges from raw material price volatility and emerging alternatives.
What will be the Size of the market During the Forecast Period?
- The market is characterized by strong growth driven by the increasing demand for lightweight, high-performance materials in various industries. Aluminum, an abundant element found in the earth's crust, is refined from mineral ores through an energy-intensive process involving extraction, refining, and electrolysis to produce alumina, which is then smelted to produce aluminum. Environmental protection regulations have fueled the adoption of aluminum casting in place of traditional steel and iron materials due to its lower carbon footprint. In the industrial sector, aluminum casting is extensively used in heavy machinery, aerospace, defense, and construction. The wind energy generation sector also contributes significantly to the market's growth due to aluminum's lightweight properties and high strength-to-weight ratio.
- Innovations in aluminum material and alloy development continue to expand the market's scope, with applications ranging from automotive components to high-tech electronics. Two common casting processes, die casting and permanent mold casting, are used to manufacture aluminum components. Secondary aluminum casting, which involves the recycling of scrap aluminum, is another growing trend In the market. Overall, the market is expected to continue its upward trajectory, driven by the demand for sustainable, lightweight, and high-performance materials.
How is this market segmented and which is the largest segment?
The market research report provides comprehensive data (region-wise segment analysis), with forecasts and estimates in "USD million" for the period 2025-2029, as well as historical data from 2019-2023 for the following segments.
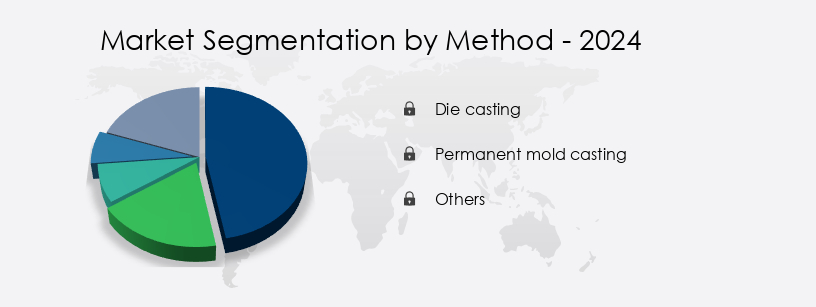
- Method
- Die casting
- Permanent mold casting
- Others
- Application
- Automotive
- Heavy machinery and industrial
- Aerospace and defense
- Construction
- Others
- Geography
- India
By Method Insights
- The die casting segment is estimated to witness significant growth during the forecast period. Aluminum casting is a prominent process In the metal industry, characterized by the use of die casting techniques to shape liquid aluminum into desired forms. Aluminum, an abundant element found In the Earth's crust, is the primary material for die casting due to its desirable properties, including lightweight nature, high-performance, and excellent corrosion resistance. The aluminum casting market is driven by the growing demand for lightweight materials in various industries, such as wind energy generation, aerospace, defense, and heavy machinery. Two common die casting methods are die casting (hot chamber and cold chamber), with cold chamber casting being the preferred choice for aluminum due to its resistance to mold dissolution.
- Aluminum material innovations and alloy development continue to expand the market, with casting alloys offering improved mechanical properties, weldability, and hydrogen gas resistance. The aluminum casting process includes refining, extraction from mineral ores, and the use of electrolysis to produce alumina, cryolite, and liquid aluminum. The process culminates in casting, which can be achieved through methods such as sand casting, permanent mold casting, or die casting. The market for aluminum casting is diverse, with applications ranging from mechanical components and alloy wheels to various industries, including the steel industry. The market is energy-intensive, with processes such as electrolysis and refining requiring significant energy inputs.
Get a glance at the market report of share of various segments Request Free Sample
Market Dynamics
Our market researchers analyzed the data with 2024 as the base year, along with the key drivers, trends, and challenges. A holistic analysis of drivers will help companies refine their marketing strategies to gain a competitive advantage.
What are the key market drivers leading to the rise in adoption of India Aluminum Casting Market?
- Growing use of aluminium casting in the automotive industry is the key driver of the market. The market experiences significant growth due to the increasing demand for lightweight and high-performance materials in various industries. Aluminum's optimal corrosion resistance, durability, and aesthetic appeal make it an ideal substitute for iron and steel in automotive applications. Additionally, aluminum's beneficial characteristics, such as good electrical and thermal conductivity, complete recyclability, competitive cost, and attractive appearance, contribute to the rising demand for die cast aluminum parts. Sustainability and energy efficiency are crucial factors driving the market's expansion. In the wind energy sector, aluminum's lightweight properties make it an excellent choice for manufacturing wind turbine blades and towers, contributing to the industry's growth.
- Furthermore, aluminum's use in heavy machinery, aerospace, and defense industries is increasing due to its high strength-to-weight ratio and excellent mechanical properties. Aluminum material innovations and alloy development continue to advance, leading to improved grain structure, weldability, and hydrogen gas tolerance. These advancements enhance the versatility of aluminum casting, expanding its applications in various industries. The aluminum casting process, including die casting, permanent mold casting, and sand casting, continues to evolve, leading to the production of high-quality aluminum castings with superior mechanical properties. Secondary aluminum casting, using recycled aluminum, is gaining popularity due to its environmental benefits and cost-effectiveness.
What are the market trends shaping the India Aluminum Casting Market?
- Growing importance of secondary aluminum casting is the upcoming trend in the market. Aluminum, an abundant element found in the Earth's crust, is recognized for its lightweight and high-performance properties, making it a preferred choice for various industries. The aluminum casting market encompasses processes such as die casting and permanent mold casting, which utilize aluminum alloys for producing metal products.
- Environmental protection is a significant factor driving the aluminum casting industry. Secondary aluminum casting, which involves the reuse of aluminum scrap, is 92% more energy efficient than primary aluminum production. This process reduces the need for extracting aluminum from mineral ores through energy-intensive processes like electrolysis and refining. Aluminum material innovations and alloy development continue to expand the application scope of aluminum castings in industries like wind energy generation, heavy machinery, aerospace, and defense.
What challenges does India Aluminum Casting Market face during the growth?
- Volatility in aluminum casting raw material prices is a key challenge affecting the market growth. Aluminum casting is a critical process in manufacturing high-performance and lightweight components for various industries, including automotive, construction, aerospace, defense, and wind energy generation. The market for aluminum casting is driven by the abundant availability of aluminum in the Earth's crust, which makes it an attractive choice for manufacturers seeking to reduce the weight of their products without compromising mechanical properties. However, the prices of raw materials used in aluminum casting, such as mineral ores and alumina, can be volatile. Factors such as high demand-to-supply ratios, taxes, duties, and tariffs, as well as production disruptions in aluminum ore-mining countries, can lead to increased raw material prices.
- This situation forces manufacturers to procure raw materials before scheduled production to maintain price and product mix control. Consumers of aluminum, including the automotive and construction industries, face high premium charges when purchasing aluminum from manufacturers. These premiums, which are in addition to the main prices, are necessary for consumers to receive timely delivery of the metal from warehouses. Aluminum innovations, such as alloy development and refining processes like electrolysis, cryolite, reduction pots, and liquefaction, have led to the production of casting alloys with superior mechanical properties, weldability, corrosion resistance, and heat treatment capabilities. The market also offers various finishes and coatings, including PVDF coatings, liquid paints, and anodizing, to enhance the appearance and durability of the final products.
Exclusive Customer Landscape
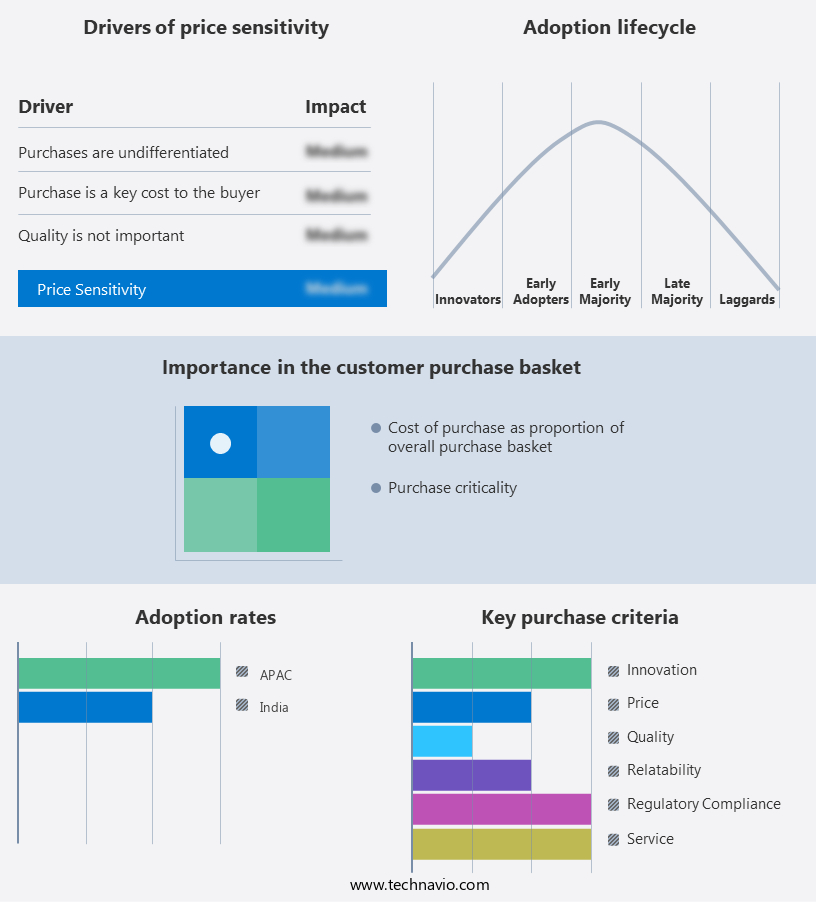
The market forecasting report includes the adoption lifecycle of the market, covering from the innovator's stage to the laggard's stage. It focuses on adoption rates in different regions based on penetration. Furthermore, the market report also includes key purchase criteria and drivers of price sensitivity to help companies evaluate and develop their market growth analysis strategies.
Customer Landscape
Key Companies & Market Insights
Companies are implementing various strategies, such as strategic alliances, market forecast , partnerships, mergers and acquisitions, geographical expansion, and product/service launches, to enhance their presence In the market.
Buhler AG - The company offers Carat, Evolution, and Fusion models.
The market research and growth report includes detailed analyses of the competitive landscape of the market and information about key companies, including:
- Buhler AG
- Endurance Technologies Ltd.
- Form Technologies
- Hero Group
- IBEX ENGINEERING PVT. LTD.
- Jaya Hind Industries
- Magna International Inc.
- Minda Corp. Ltd.
- Motherson Group
- NEMAK SAB de CV
- Rheinmetall AG
- Rico Auto Industries Ltd.
- Sandhar Technologies Ltd.
- Sipra Engineers
- Sundaram Clayton Ltd.
- Tattvan Alumicast Pvt. Ltd.
- VJP Aluminium Foundry
Qualitative and quantitative analysis of companies has been conducted to help clients understand the wider business environment as well as the strengths and weaknesses of key market players. Data is qualitatively analyzed to categorize companies as pure play, category-focused, industry-focused, and diversified; it is quantitatively analyzed to categorize companies as dominant, leading, strong, tentative, and weak.
Research Analyst Overview
The market is driven by the increasing demand for lightweight and high-performance materials in various industries. Aluminum, an abundant element found in the earth's crust, is gaining popularity due to its environmental benefits and superior mechanical properties. The metal's low density makes it an ideal choice for reducing the weight of machinery and vehicles, thereby improving fuel efficiency and reducing carbon emissions. The aluminum industry is witnessing significant innovations in material development, with a focus on improving the performance and properties of aluminum alloys. Secondary aluminum casting, which involves the reuse of scrap aluminum, is also gaining traction due to its environmental advantages.
Moreover, one of the major industries driving the growth of the aluminum casting market is the renewable energy sector, particularly wind energy generation. Aluminum's lightweight and high strength make it an ideal material for wind turbine components, including blades and towers. The aluminum casting process involves the use of different techniques such as die casting and permanent mold casting. Die casting is a high-pressure process that involves injecting molten aluminum into a die cavity using a hydraulic press. Permanent mold casting, on the other hand, involves pouring molten aluminum into a reusable mold. Both processes have their unique advantages and are used based on the specific requirements of the application.
Furthermore, the market also caters to industries such as heavy machinery, aerospace, and defense. Aluminum's excellent mechanical properties, including weldability, corrosion resistance, and heat treatment, make it an ideal choice for these industries. The production of aluminum involves the extraction of aluminum from mineral ores using energy-intensive processes such as electrolysis. The process generates by-products such as alumina, red mud, and cryolite, which can be recycled and used in various applications. The use of aluminum in place of steel in various applications is a significant trend In the metal products industry. Aluminum's lighter weight and superior mechanical properties make it an attractive alternative to steel in industries such as automotive and construction.
|
Market Scope |
|
|
Report Coverage |
Details |
|
Page number |
159 |
|
Base year |
2024 |
|
Historic period |
2019-2023 |
|
Forecast period |
2025-2029 |
|
Growth momentum & CAGR |
Accelerate at a CAGR of 11.1% |
|
Market growth 2025-2029 |
USD 10.61 billion |
|
Market structure |
Fragmented |
|
YoY growth 2024-2025(%) |
8.8 |
|
Competitive landscape |
Leading Companies, Market Positioning of Companies, Competitive Strategies, and Industry Risks |
What are the Key Data Covered in this Market Research and Growth Report?
- CAGR of the market during the forecast period
- Detailed information on factors that will drive the market growth and forecasting between 2025 and 2029
- Precise estimation of the size of the market and its contribution of the market in focus to the parent market
- Accurate predictions about upcoming market growth and trends and changes in consumer behaviour
- Growth of the market across India
- Thorough analysis of the market's competitive landscape and detailed information about companies
- Comprehensive analysis of factors that will challenge the growth of market companies
We can help! Our analysts can customize this market research report to meet your requirements. Get in touch
 RIA -
RIA - 
