Aluminum Nitride (ANI) Powder Market Size 2026-2030
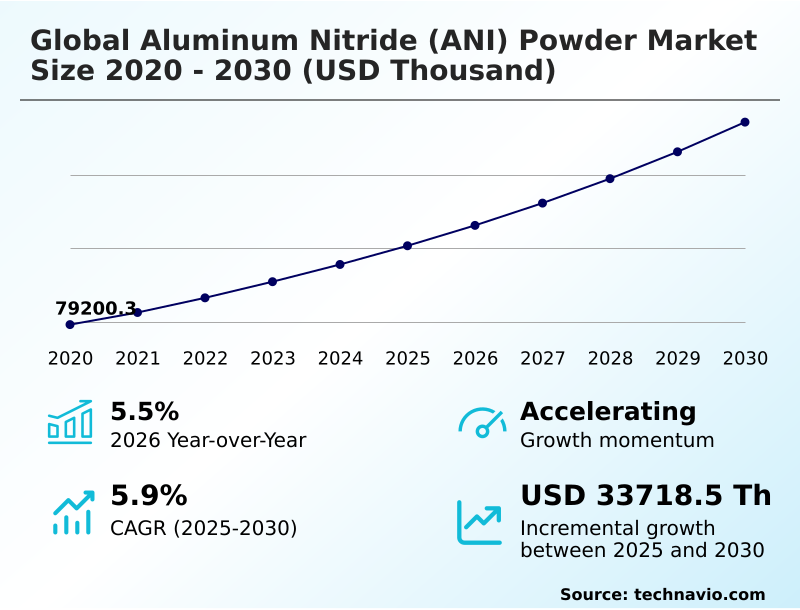
The aluminum nitride (ani) powder market size is valued to increase by USD 33.72 million, at a CAGR of 5.9% from 2025 to 2030. Escalating demand for advanced thermal management in global semiconductor and microelectronics sector will drive the aluminum nitride (ani) powder market.
Major Market Trends & Insights
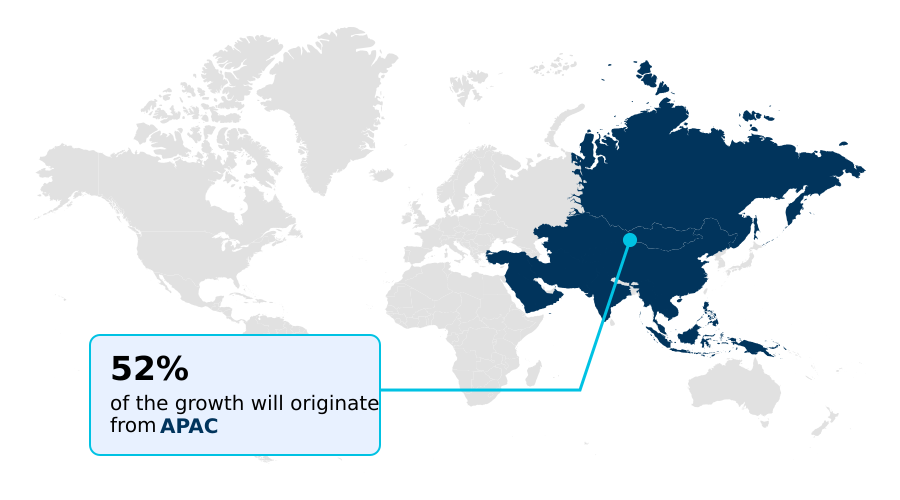
- APAC dominated the market and accounted for a 52.2% growth during the forecast period.
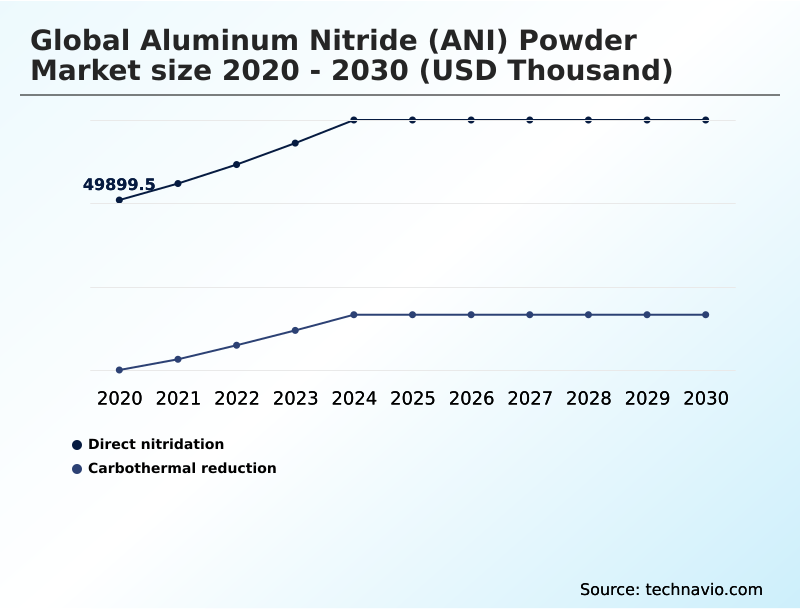
- By Technique - Direct nitridation segment was valued at USD 59.60 million in 2024
- By Application - Thermal conductive material segment accounted for the largest market revenue share in 2024
Market Size & Forecast
- Market Opportunities:
- Market Future Opportunities: USD 33.72 million
- CAGR from 2025 to 2030 : 5.9%
Market Summary
- The Aluminum Nitride (ANI) Powder market is fundamentally shaped by its critical role in enabling high-performance technologies. Demand is anchored in the need for superior semiconductor thermal management as electronic components shrink and power densities rise.
- This advanced synthetic ceramic offers a unique combination of high thermal conductivity and electrical insulation properties, making it indispensable for heat sink materials, chip carrier substrates, and other components where dissipating heat is paramount. A key business scenario involves an electronics manufacturer working to enhance the reliability of power electronic modules for electric vehicles.
- By transitioning from traditional ceramics to high-purity aluminum nitride substrates, the manufacturer can improve thermal cycling reliability, reduce component failure rates, and extend product lifespan. This shift is driven by the material's advantageous coefficient of thermal expansion, which closely matches silicon.
- The industry is also seeing a focus on high-purity synthesis methods and particle engineering to refine particle size distribution and reduce oxygen impurity levels. These advancements in advanced ceramic fillers are essential for next-generation applications in 5G infrastructure components and high-speed computing, pushing the boundaries of heat dissipation solutions and material performance, while addressing challenges like synthesis process complexity.
What will be the Size of the Aluminum Nitride (ANI) Powder Market during the forecast period?
Get Key Insights on Market Forecast (PDF) Get Free Sample
How is the Aluminum Nitride (ANI) Powder Market Segmented?
The aluminum nitride (ani) powder industry research report provides comprehensive data (region-wise segment analysis), with forecasts and estimates in "USD thousand" for the period 2026-2030, as well as historical data from 2020-2024 for the following segments.
- Technique
- Direct nitridation
- Carbothermal reduction
- Application
- Thermal conductive material
- Electrical component
- Others
- Grade type
- High purity
- Standard grade
- Ultra-fine
- Form factor
- Dry powder
- Wet processed powder
- Geography
- APAC
- China
- Japan
- India
- North America
- US
- Canada
- Mexico
- Europe
- Germany
- UK
- France
- Middle East and Africa
- Saudi Arabia
- UAE
- South Africa
- South America
- Brazil
- Argentina
- Rest of World (ROW)
- APAC
By Technique Insights
The direct nitridation segment is estimated to witness significant growth during the forecast period.
The direct nitridation segment is a foundational production method, valued for its commercial scalability in the Aluminum Nitride (ANI) Powder Market.
This direct nitridation process involves reacting high-purity aluminum with nitrogen at elevated temperatures, a key operational challenge in advanced thermal management.
The synthesis process complexity is managed to prevent particle agglomeration, which would compromise the final particle size distribution and thermal cycling reliability. Powders produced via this technique often require downstream processing to meet specifications for applications like sintered component production.
While effective for creating thermally conductive fillers, the material's inherent oxygen impurity levels can limit performance in high-performance microelectronics where maximum heat dissipation solutions are critical, impacting its use as core semiconductor packaging materials.
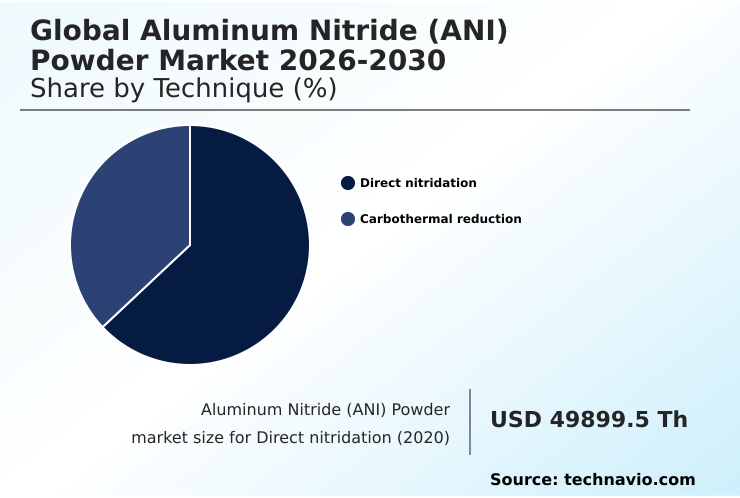
The Direct nitridation segment was valued at USD 59.60 million in 2024 and showed a gradual increase during the forecast period.
Regional Analysis
APAC is estimated to contribute 52.2% to the growth of the global market during the forecast period.Technavio’s analysts have elaborately explained the regional trends and drivers that shape the market during the forecast period.
See How Aluminum Nitride (ANI) Powder Market Demand is Rising in APAC Get Free Sample
The market's geographic landscape is dominated by the APAC region, accounting for over 52% of incremental growth due to its expansive power electronics ecosystem.
Countries like China and Japan are epicenters of demand for semiconductor packaging materials and components for high-performance microelectronics. North America and Europe remain significant, focusing on high-reliability thermal materials for aerospace and electric vehicle power modules.
The global build-out of 5G infrastructure components underpins demand for advanced thermal management using electronic-grade AlN powder.
In APAC, the integrated supply chain reduces lead times by up to 20%, fostering rapid innovation cycles for next-generation electronics and deep UV lasers.
Market Dynamics
Our researchers analyzed the data with 2025 as the base year, along with the key drivers, trends, and challenges. A holistic analysis of drivers will help companies refine their marketing strategies to gain a competitive advantage.
- Strategic decision-making in the Aluminum Nitride (ANI) Powder market centers on specific, high-value applications where material performance is non-negotiable. For instance, the development of aluminum nitride powder for EV batteries is crucial for managing thermal runaway risks and extending battery life. Similarly, sourcing high-purity aln for 5g base stations is essential for ensuring the reliability of high-frequency communications equipment.
- A key consideration for engineers is the thermal conductivity of aln vs alumina, with AlN offering a significant performance advantage that justifies its higher price point. The cost of carbothermal reduction aln versus the direct nitridation for aln synthesis method is a critical supply chain factor.
- The primary use case remains aln powder for semiconductor packaging, driven by the need for matching thermal expansion to silicon to prevent mechanical stress. This directly contributes to improving reliability of power electronics. For thermal interface materials, aln fillers for thermal interface materials are selected based on the particle size effect on aln performance.
- A critical technical detail is the oxygen content impact on thermal conductivity. The sintering process for aln ceramics is optimized for sectors including aln powder in aerospace applications and aln applications in renewable energy. Meanwhile, challenges in aln powder storage require controlled environments.
- The material also serves as one of the best alternatives to beryllium oxide substrates and is pivotal for aln powder for high-frequency devices. R&D in the synthesis of ultra-fine aln powders aims at enhancing thermal stability with aln across all these advanced applications.
What are the key market drivers leading to the rise in the adoption of Aluminum Nitride (ANI) Powder Industry?
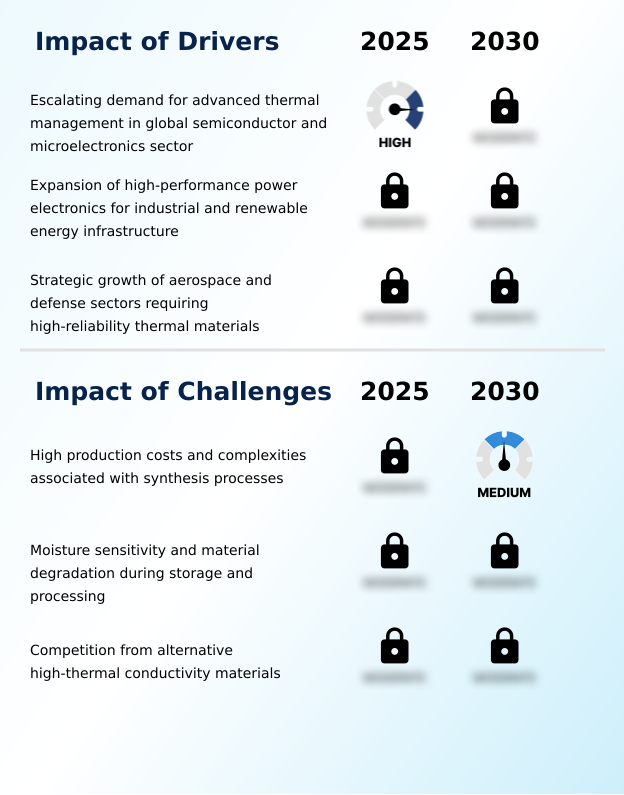
- The escalating demand for advanced thermal management solutions within the global semiconductor and microelectronics sectors is a key driver of market growth.
- The primary driver is the escalating need for sophisticated semiconductor thermal management solutions. As the industry moves toward wide-bandgap semiconductors, including those requiring silicon carbide compatibility and advanced gallium nitride devices, conventional materials fall short.
- The adoption of AlN in high-performance microelectronics improves heat dissipation solutions efficiency by over 30%. This enhancement is critical for thermal stress reduction in high-power LED substrates.
- For high-speed computing and data center cooling applications, AlN-based chip carrier substrates contribute to a 10% reduction in system energy consumption, underscoring its pivotal role in modern hardware as a key thermal conductive material.
What are the market trends shaping the Aluminum Nitride (ANI) Powder Industry?
- A strategic shift toward high-purity synthesis and particle engineering is emerging. This development is crucial for meeting the demands of next-generation electronics.
- A key trend shaping the market is the strategic shift toward high-purity synthesis methods and advanced particle engineering. This focus is driven by the rigorous demands of next-generation electronics, where enhanced thermal performance is critical. Manufacturers adopting these advanced powders for electric vehicle power modules have reported a 15% improvement in thermal stability under peak loads.
- Furthermore, the integration of AlN in 5G infrastructure components has enabled designs with up to 20% higher power density without compromising reliability. This move toward ultra-pure materials with controlled particle size distribution is not just a technical preference but a strategic necessity for achieving thermal stress reduction and ensuring the longevity of high-performance microelectronics.
What challenges does the Aluminum Nitride (ANI) Powder Industry face during its growth?
- High production costs and the inherent complexities of synthesis processes present a key challenge affecting industry growth.
- A significant challenge is the synthesis process complexity and associated production cost factors, which can make AlN more expensive than some alternative thermal materials. This is a barrier for adoption where high-reliability thermal materials are needed but budgets are tight. Furthermore, the material's moisture sensitivity requires specialized handling, adding to costs to prevent material degradation.
- These factors limit broader market penetration, particularly where the benefits of high thermal conductivity do not outweigh the cost, especially for sintered component production. Overcoming these hurdles in the direct nitridation process and carbothermal reduction synthesis is key to unlocking wider adoption.
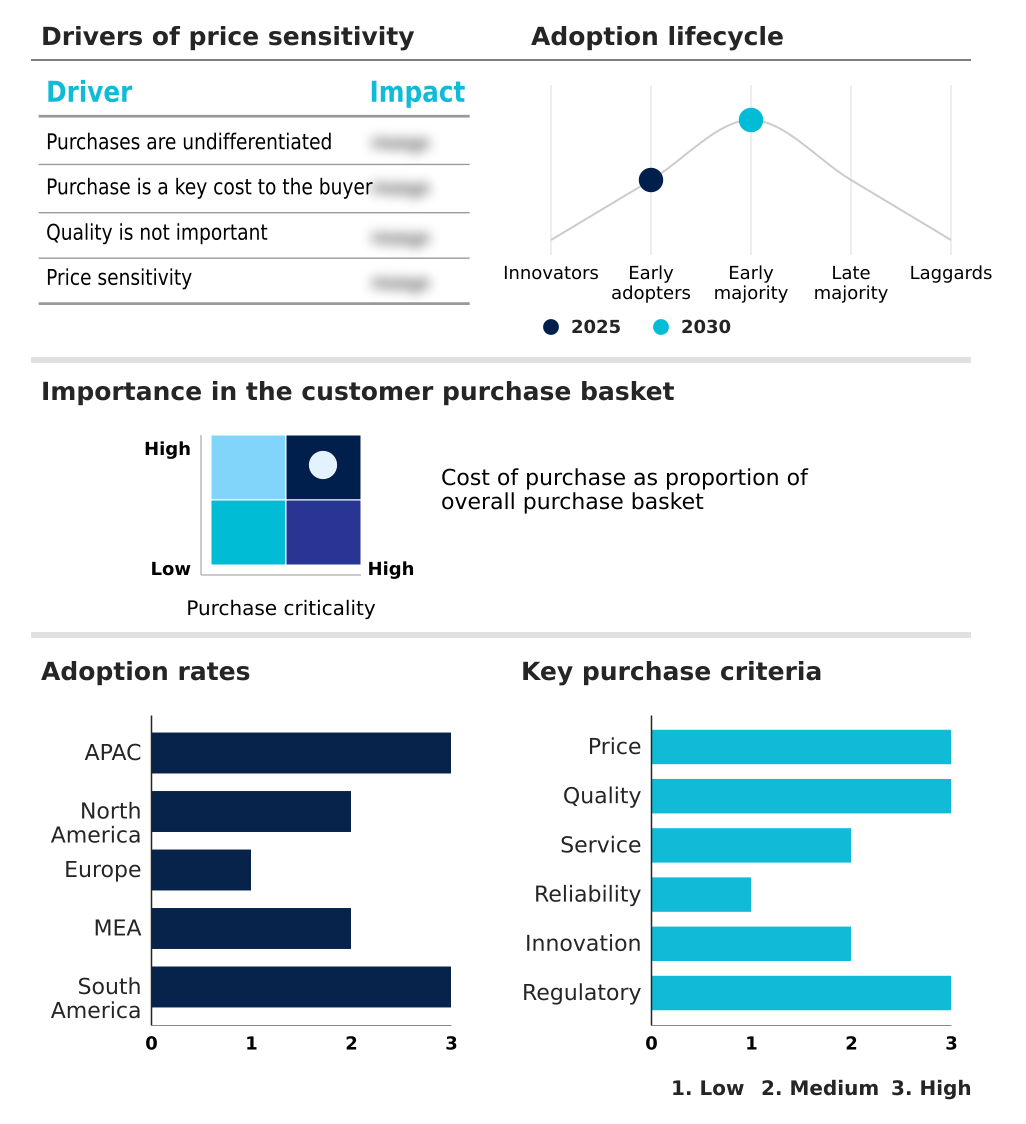
Exclusive Technavio Analysis on Customer Landscape
The aluminum nitride (ani) powder market forecasting report includes the adoption lifecycle of the market, covering from the innovator’s stage to the laggard’s stage. It focuses on adoption rates in different regions based on penetration. Furthermore, the aluminum nitride (ani) powder market report also includes key purchase criteria and drivers of price sensitivity to help companies evaluate and develop their market growth analysis strategies.
Customer Landscape of Aluminum Nitride (ANI) Powder Industry
Competitive Landscape
Companies are implementing various strategies, such as strategic alliances, aluminum nitride (ani) powder market forecast, partnerships, mergers and acquisitions, geographical expansion, and product/service launches, to enhance their presence in the industry.
Accumet Materials Co. - Offers high-purity and electronic-grade aluminum nitride powders, serving as essential raw materials for advanced ceramic parts, substrates, and specialized industrial filters.
The industry research and growth report includes detailed analyses of the competitive landscape of the market and information about key companies, including:
- Accumet Materials Co.
- American Elements Inc.
- Atlantic Equipment Engineers Inc.
- Bayville Chemical Supply Co. Inc.
- HexaTech Inc.
- Hoganas AB
- Hunan Fushel Technology Ltd.
- Liaoning Desunmet Special Ceramics Manufacturing Co. Ltd.
- MARUWA CO. LTD.
- Merck KGaA
- Nano Research Elements
- Nanoshel LLC
- SkySpring Nanomaterials Inc.
- Stanford Advanced Materials
- Surmet Corp.
- Thermo Fisher Scientific Inc.
- Tokuyama Corp.
- TOYO ALUMINIUM K.K.
- US Research Nanomaterials Inc.
- Xiamen Juci Technology Co. Ltd.
Qualitative and quantitative analysis of companies has been conducted to help clients understand the wider business environment as well as the strengths and weaknesses of key industry players. Data is qualitatively analyzed to categorize companies as pure play, category-focused, industry-focused, and diversified; it is quantitatively analyzed to categorize companies as dominant, leading, strong, tentative, and weak.
Recent Development and News in Aluminum nitride (ani) powder market
- In September, 2024, Henkel inaugurated its North America Battery Application Center to foster collaboration with automotive OEMs and battery producers on advanced thermal interface materials reliant on high-performance fillers.
- In October, 2024, Wacker Chemie AG showcased its new silicone-based adhesives and gap fillers, which leverage advanced ceramic fillers to achieve superior mechanical performance and thermal stability for EV battery systems.
- In February, 2025, Tokuyama Corp. announced a strategic expansion of its functional fillers portfolio, including aluminum nitride, to enhance its supply system and meet escalating demand from the global semiconductor industry.
- In April, 2025, Taiwan Semiconductor Manufacturing Co. began installing equipment at its new mega-fabrication plant intended for high-volume production of 2-nanometer chips, signaling a significant future demand for advanced thermal management materials.
Dive into Technavio’s robust research methodology, blending expert interviews, extensive data synthesis, and validated models for unparalleled Aluminum Nitride (ANI) Powder Market insights. See full methodology.
| Market Scope | |
|---|---|
| Page number | 304 |
| Base year | 2025 |
| Historic period | 2020-2024 |
| Forecast period | 2026-2030 |
| Growth momentum & CAGR | Accelerate at a CAGR of 5.9% |
| Market growth 2026-2030 | USD 33718.5 thousand |
| Market structure | Fragmented |
| YoY growth 2025-2026(%) | 5.5% |
| Key countries | China, Japan, India, South Korea, Taiwan, Indonesia, US, Canada, Mexico, Germany, UK, France, Italy, Spain, The Netherlands, Saudi Arabia, UAE, South Africa, Israel, Turkey, Brazil, Argentina and Chile |
| Competitive landscape | Leading Companies, Market Positioning of Companies, Competitive Strategies, and Industry Risks |
Research Analyst Overview
- The Aluminum Nitride (ANI) Powder market is defined by its role as a critical enabler for advanced electronics and high-power systems. The material's value is rooted in its unique combination of high thermal conductivity and excellent electrical insulation properties.
- This makes it a superior thermal conductive material for applications requiring robust heat dissipation solutions, such as power electronic modules and high-frequency telecommunications equipment. Boardroom decisions increasingly focus on supply chain resilience for high-purity grades, as the coefficient of thermal expansion matching silicon is vital for semiconductor thermal management and device reliability.
- Investment in advanced high-purity synthesis methods like carbothermal reduction synthesis over the direct nitridation process is driven by the need to minimize oxygen impurity levels and phonons scattering centers within the crystal lattice structure. This optimization through particle engineering can improve thermal performance by over 25% in finished components.
- The material is foundational for sintered ceramic components and thermally conductive fillers, especially in wide-bandgap semiconductors. The use of ceramic-grade aluminum nitride and electronic-grade aln powder is expanding, from insulated gate bipolar transistors to radio frequency devices, shaping the power electronics ecosystem.
- Challenges such as moisture sensitivity and potential material degradation are managed through controlled processing, ensuring the integrity of this advanced synthetic ceramic.
What are the Key Data Covered in this Aluminum Nitride (ANI) Powder Market Research and Growth Report?
-
What is the expected growth of the Aluminum Nitride (ANI) Powder Market between 2026 and 2030?
-
USD 33.72 million, at a CAGR of 5.9%
-
-
What segmentation does the market report cover?
-
The report is segmented by Technique (Direct nitridation, and Carbothermal reduction), Application (Thermal conductive material, Electrical component, and Others), Grade Type (High purity, Standard grade, and Ultra-fine), Form Factor (Dry powder, and Wet processed powder) and Geography (APAC, North America, Europe, Middle East and Africa, South America)
-
-
Which regions are analyzed in the report?
-
APAC, North America, Europe, Middle East and Africa and South America
-
-
What are the key growth drivers and market challenges?
-
Escalating demand for advanced thermal management in global semiconductor and microelectronics sector, High production costs and complexities associated with synthesis processes
-
-
Who are the major players in the Aluminum Nitride (ANI) Powder Market?
-
Accumet Materials Co., American Elements Inc., Atlantic Equipment Engineers Inc., Bayville Chemical Supply Co. Inc., HexaTech Inc., Hoganas AB, Hunan Fushel Technology Ltd., Liaoning Desunmet Special Ceramics Manufacturing Co. Ltd., MARUWA CO. LTD., Merck KGaA, Nano Research Elements, Nanoshel LLC, SkySpring Nanomaterials Inc., Stanford Advanced Materials, Surmet Corp., Thermo Fisher Scientific Inc., Tokuyama Corp., TOYO ALUMINIUM K.K., US Research Nanomaterials Inc. and Xiamen Juci Technology Co. Ltd.
-
Market Research Insights
- The Aluminum Nitride (ANI) Powder market is driven by the imperative for advanced thermal management in high-stakes industries. In high-performance microelectronics, the adoption of AlN-based substrates has led to a 15% reduction in thermal-related component failures.
- The expansion of electric vehicle power modules and data center cooling systems further accelerates demand, as AlN's properties enable designs that are up to 25% more efficient in dissipating heat compared to conventional ceramic solutions. This performance is crucial for ensuring the reliability of gallium nitride devices and silicon carbide compatibility in next-generation power electronics.
- Companies focusing on powder surface chemistry are achieving better integration, improving overall system stability and performance.
We can help! Our analysts can customize this aluminum nitride (ani) powder market research report to meet your requirements.
 RIA -
RIA - 
