Aluminum Powders, Pastes, And Flakes Market Size 2026-2030
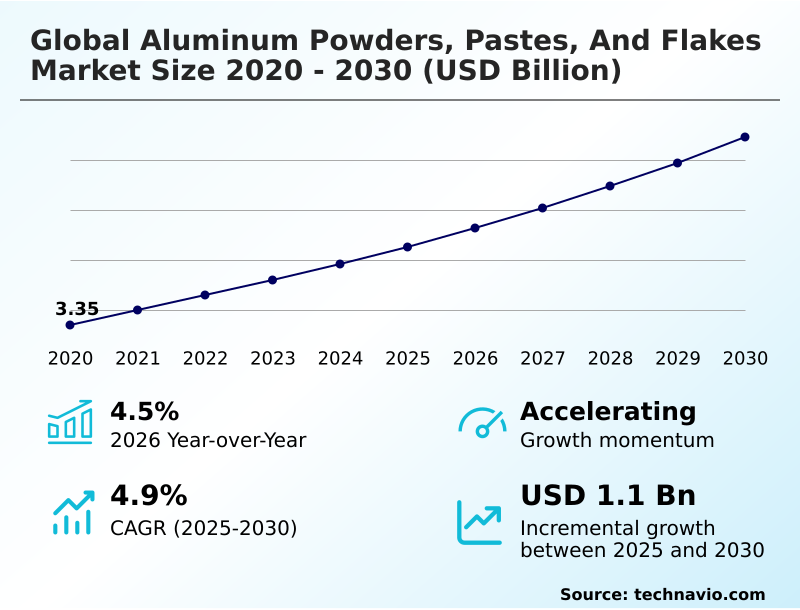
The aluminum powders, pastes, and flakes market size is valued to increase by USD 1.10 billion, at a CAGR of 4.9% from 2025 to 2030. Integration of additive manufacturing and advanced aerospace engineering will drive the aluminum powders, pastes, and flakes market.
Major Market Trends & Insights
- APAC dominated the market and accounted for a 49% growth during the forecast period.
- By End-user - Automotive segment was valued at USD 948.2 million in 2024
- By Product - Aluminum paste segment accounted for the largest market revenue share in 2024
Market Size & Forecast
- Market Opportunities: USD 1.88 billion
- Market Future Opportunities: USD 1.10 billion
- CAGR from 2025 to 2030 : 4.9%
Market Summary
- The aluminum powders, pastes, and flakes market is undergoing a significant transformation, driven by technological advancements and evolving industrial requirements. Key sectors such as aerospace and automotive are increasingly adopting high-purity aluminum powder for additive manufacturing, enabling the production of lightweight, complex components that were previously unachievable.
- For instance, an aerospace manufacturer can leverage powder bed fusion to consolidate multiple parts into a single, optimized design, reducing both weight and assembly time. This shift is supported by innovations in aluminum powder atomization, which yields spherical aluminum powders with consistent particle size distribution. Simultaneously, the demand for photovoltaic metallization paste is surging as the renewable energy sector expands.
- However, the market faces challenges related to the safe handling of reactive aluminum materials and supply chain volatility. The development of advanced surface-treated aluminum flakes and sustainable pigment solutions is creating new opportunities in decorative and functional coatings, driving further market evolution.
What will be the Size of the Aluminum Powders, Pastes, And Flakes Market during the forecast period?
Get Key Insights on Market Forecast (PDF) Get Free Sample
How is the Aluminum Powders, Pastes, And Flakes Market Segmented?
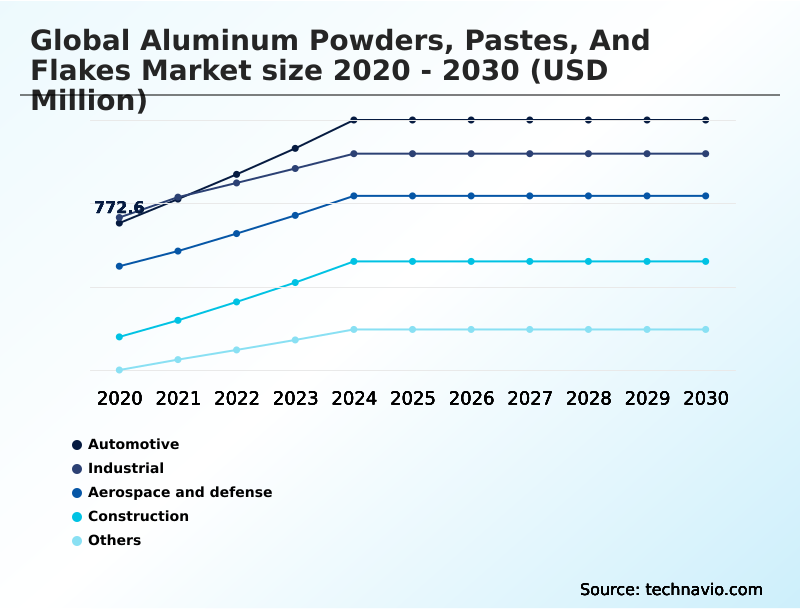
The aluminum powders, pastes, and flakes industry research report provides comprehensive data (region-wise segment analysis), with forecasts and estimates in "USD million" for the period 2026-2030, as well as historical data from 2020-2024 for the following segments.
- End-user
- Automotive
- Industrial
- Aerospace and defense
- Construction
- Others
- Product
- Aluminum paste
- Aluminum flakes and flake pigment
- Aluminum powder
- Application
- Paints and coatings
- Chemical processing
- Additive manufacturing
- Thermal insulation
- Geography
- APAC
- China
- Japan
- India
- Europe
- Germany
- UK
- France
- Middle East and Africa
- Saudi Arabia
- UAE
- South Africa
- North America
- US
- Canada
- Mexico
- South America
- Brazil
- Argentina
- Rest of World (ROW)
- APAC
By End-user Insights
The automotive segment is estimated to witness significant growth during the forecast period.
The automotive sector is a primary consumer in the aluminum powders, pastes, and flakes market, driven by the systemic shift toward electric mobility and advanced lightweighting strategies.
Aluminum powders are integral to powder metallurgy components and additive manufacturing processes, enabling the production of complex, high-strength structural parts that contribute to significant mass reduction. This lightweighting directly addresses the need to offset heavy battery packs in EVs.
In coatings, non-leafing aluminum pigments and leafing flake pigments are essential for OEM finishes, delivering both metallic brilliance and corrosion-resistant coatings.
The automotive sector now accounts for over 35% of the total volume in the metal powder market, a trend supported by the need for optimized thermal management materials and aluminum-silicon alloys (AlSi).
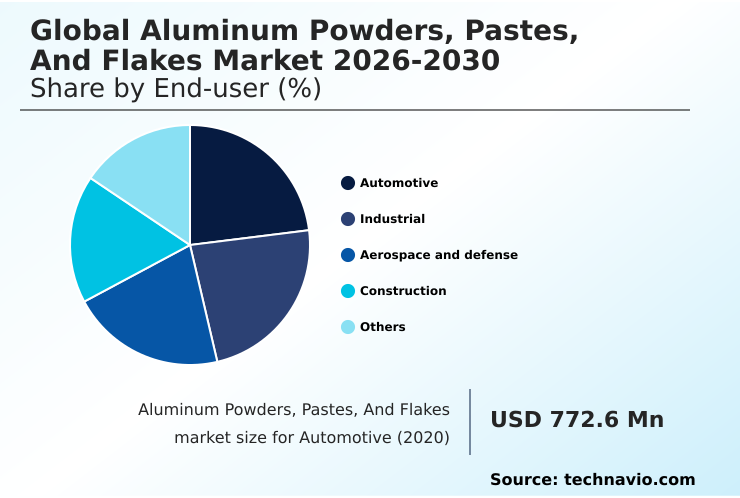
The Automotive segment was valued at USD 948.2 million in 2024 and showed a gradual increase during the forecast period.
Regional Analysis
APAC is estimated to contribute 49% to the growth of the global market during the forecast period.Technavio’s analysts have elaborately explained the regional trends and drivers that shape the market during the forecast period.
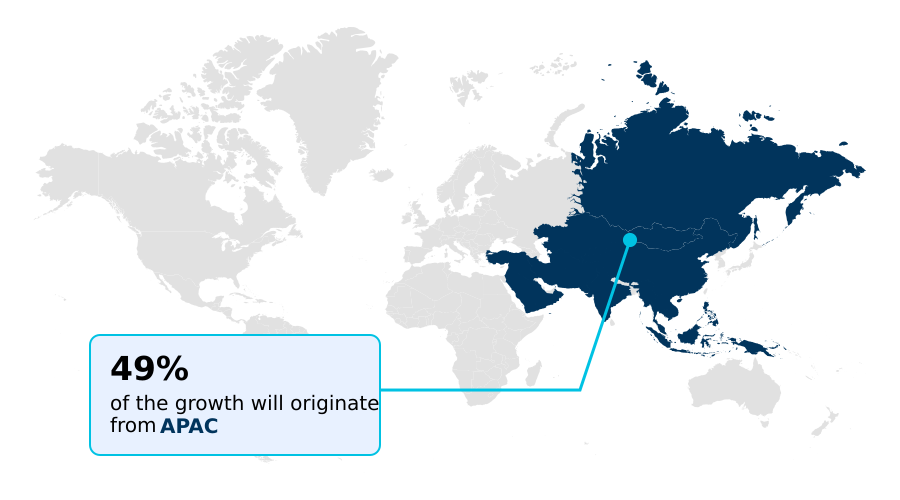
See How Aluminum Powders, Pastes, And Flakes Market Demand is Rising in APAC Get Free Sample
The APAC region stands as the largest and most dynamic segment, driven by large-scale automotive production and expanding renewable energy infrastructure in China and India.
This regional dominance is reinforced by a concentrated supply chain for primary aluminum and integrated manufacturing ecosystems for solar panels and electronics.
Recent industry data shows aluminum prices in the region saw a 25% year-on-year increase, fueled by supply constraints and high demand from the electric vehicle sector.
This economic climate compels manufacturers to innovate with high-yield aluminum powder atomization techniques and increase the use of secondary aluminum to preserve margins.
The growth of India's manufacturing sector is also boosting demand for aluminum flakes in decorative effect pigments and industrial coatings.
This makes APAC the primary engine for global volume growth and a key area for high-energy ball milling and aluminum nanopowder synthesis.
Market Dynamics
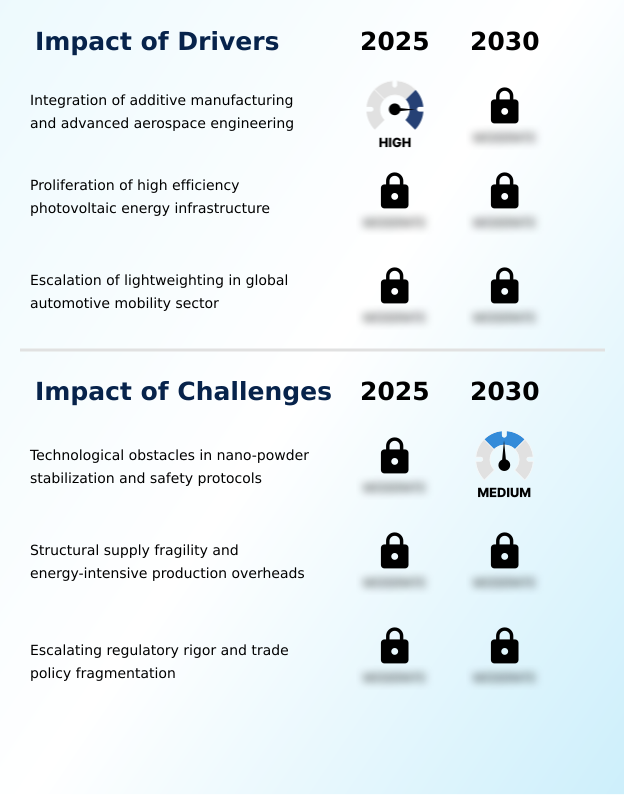
Our researchers analyzed the data with 2025 as the base year, along with the key drivers, trends, and challenges. A holistic analysis of drivers will help companies refine their marketing strategies to gain a competitive advantage.
- The global aluminum powders, pastes, and flakes market is evolving through specialization in key application areas. The demand for aluminum powder for additive manufacturing is a primary growth driver, particularly as industries seek lightweight and complex components. In the renewable energy sector, the efficiency of photovoltaic paste for solar cells is a critical factor for manufacturers.
- Similarly, automotive lightweighting with aluminum powder is essential for improving the range and performance of electric vehicles. The use of aluminum pigments in decorative coatings continues to be a major application, with an emphasis on creating unique aesthetic finishes. Navigating this market requires addressing key operational factors.
- For example, handling explosive aluminum dust safely is a non-negotiable aspect of production, influencing facility design and process management. The supply chain for high-purity aluminum is another critical area, where logistical efficiencies can significantly impact profitability. Companies that master localized production of specialized powders have reported up to a 15% reduction in supply chain lead times.
- The stabilization of nano-scale aluminum powders and the choice between water-based vs. solvent-based pastes present ongoing technical challenges. Furthermore, applications in defense, such as aluminum powder in solid rocket fuel, require stringent quality controls. Understanding the nuances between leafing vs. non-leafing aluminum pigments and the requirements of spherical powder for powder bed fusion is crucial for market success.
What are the key market drivers leading to the rise in the adoption of Aluminum Powders, Pastes, And Flakes Industry?
- The integration of additive manufacturing with advanced aerospace engineering serves as a key market driver.
- The escalation of lightweighting strategies in the automotive sector, particularly for electric vehicles, is a significant market driver.
- Utilizing aluminum powders, pastes, and flakes for premium coatings and lightweight structural alloys helps offset the mass of heavy battery packs, with some designs achieving a 10% improvement in EV range.
- Aluminum-based pigments are favored for their reflective properties, providing the metallic finishes synonymous with modern automotive design. The adoption of powder metallurgy also allows for producing high-precision components with less material waste, reducing manufacturing costs by up to 15%.
- This underscores the automotive industry's role as a primary engine for aluminum pigments and powders. The demand for materials enabling thermal management and electromagnetic shielding, such as cold spray technology, will continue to expand with the move toward autonomous vehicles.
What are the market trends shaping the Aluminum Powders, Pastes, And Flakes Industry?
- The industrialization of metal additive manufacturing solutions is a significant upcoming trend. This reflects a market shift from using metal powders primarily for prototyping to adopting them for full-scale industrial production.
- The market is undergoing a structural transformation as metal additive manufacturing transitions from prototyping to industrial-scale production. In aerospace and defense, the use of spherical aluminum powders for fabricating complex, lightweight geometries is increasing, with some applications achieving a 40% part consolidation. This trend is driven by the need for weight reduction to improve fuel efficiency.
- Advanced techniques like laser powder bed fusion (LPBF) and electron beam melting (EBM) rely on specialized aluminum alloys. The demand for high-purity powders for 3D printing is growing, reflecting a shift toward decentralized manufacturing. This evolution is supported by powder flowability and advancements in air-jet milling process, which are critical for achieving deterministic mechanical properties in final parts.
- The competitive landscape is now defined by the ability to supply consistent, certified powder quality.
What challenges does the Aluminum Powders, Pastes, And Flakes Industry face during its growth?
- Technological obstacles related to nano-powder stabilization and associated safety protocols present a significant challenge affecting industry growth.
- A primary challenge in the market is the stabilization and safe handling of nano-scale aluminum particles. The high reactivity of these materials increases the risk of spontaneous oxidation or dust explosions, which can lead to a 20% increase in insurance premiums for facilities with inadequate safety protocols. This requires strictly controlled inert environments.
- The high capital expenditure for specialized milling and atomization equipment also restricts market entry for smaller innovators. Supply chain fragility is another concern, with the production of atomized powders being highly energy-intensive and subject to electricity price fluctuations.
- These operational risks are compounded by a shortage of skilled labor for advanced manufacturing, hindering the full adoption of technologies like reactive aluminum materials and explosive ordnance disposal.
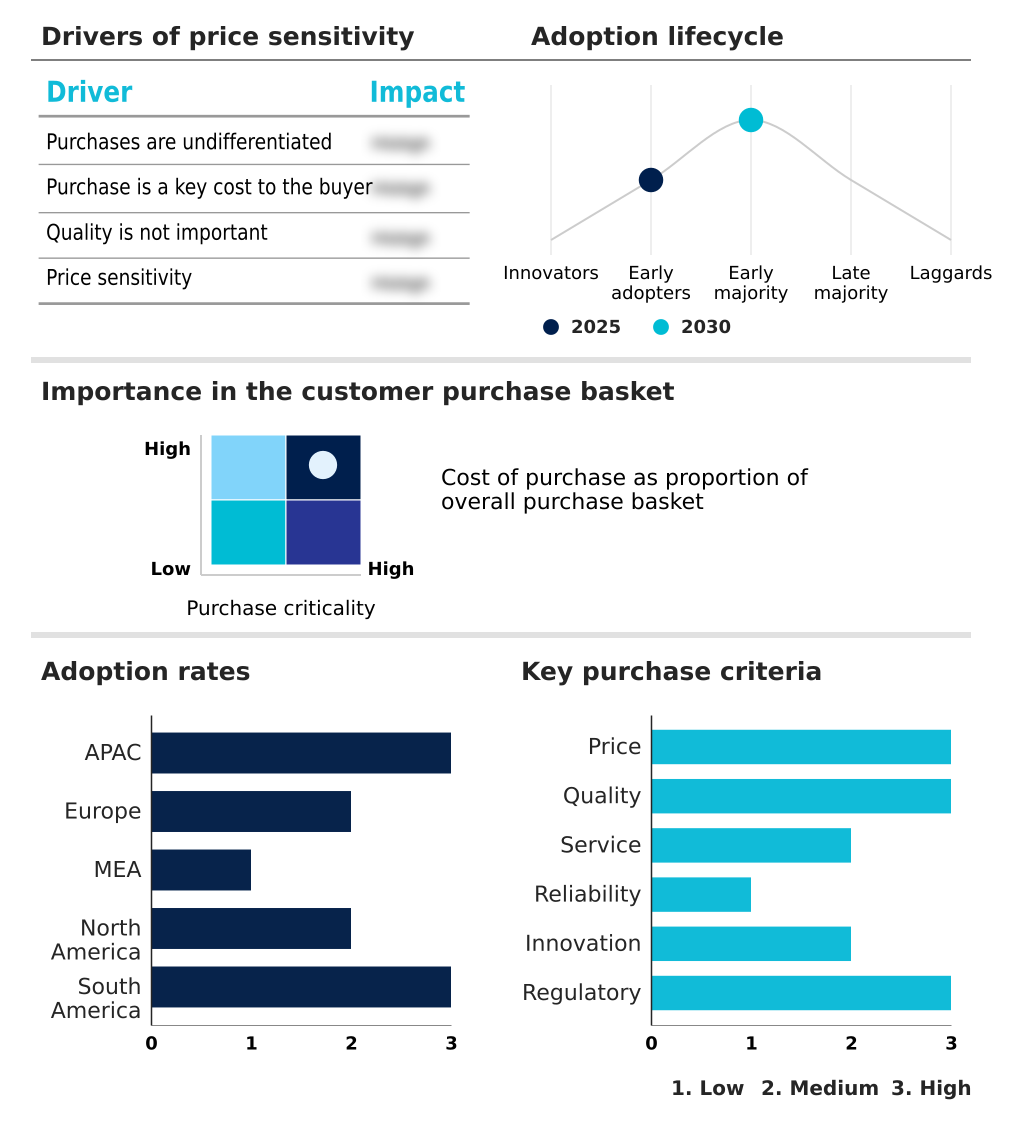
Exclusive Technavio Analysis on Customer Landscape
The aluminum powders, pastes, and flakes market forecasting report includes the adoption lifecycle of the market, covering from the innovator’s stage to the laggard’s stage. It focuses on adoption rates in different regions based on penetration. Furthermore, the aluminum powders, pastes, and flakes market report also includes key purchase criteria and drivers of price sensitivity to help companies evaluate and develop their market growth analysis strategies.
Customer Landscape of Aluminum Powders, Pastes, And Flakes Industry
Competitive Landscape
Companies are implementing various strategies, such as strategic alliances, aluminum powders, pastes, and flakes market forecast, partnerships, mergers and acquisitions, geographical expansion, and product/service launches, to enhance their presence in the industry.
Alcoa Corp. - The company offers a range of aluminum powders, pastes, and flakes, including atomized aluminum powder and flake powder for various industrial applications.
The industry research and growth report includes detailed analyses of the competitive landscape of the market and information about key companies, including:
- Alcoa Corp.
- Altana AG
- AMG Aluminum
- Arasan Aluminium Industries
- Asahi Kasei Corp.
- AVL Metal Powders NV
- BASF SE
- Carlfors Bruk AB
- CNPC Powder Group Co. Ltd.
- ECKART GmbH
- Hoganas AB
- Kymera International
- Metaflake Ltd.
- Metal Powder Company Limited
- MMP Industries Ltd.
- Novamet Specialty Products Corp
- SCHLENK SE
- Silberline Manufacturing Co Inc
- Sun Chemical Corp.
- United Co. RUSAL
Qualitative and quantitative analysis of companies has been conducted to help clients understand the wider business environment as well as the strengths and weaknesses of key industry players. Data is qualitatively analyzed to categorize companies as pure play, category-focused, industry-focused, and diversified; it is quantitatively analyzed to categorize companies as dominant, leading, strong, tentative, and weak.
Recent Development and News in Aluminum powders, pastes, and flakes market
- In April, 2025, APWORKS GmbH and a major materials partner signed a non-binding agreement to initiate the domestic atomization of Scalmalloy alloy powder in the United States, targeting the expansion of additive manufacturing capabilities.
- In March, 2025, Hunan Jinhai finalized the acquisition of Zhangjiagang Fuhua Aluminum Paste Company, a strategic move to expand high-grade production capacity to meet the quality standards of the global electronics and automotive sectors.
- In November, 2025, Kaiser Aluminum announced the completion of a major production expansion project aimed at supporting manufacturers with high-quality aluminum solutions for the building and construction sectors.
- In July, 2025, AMPAL, Inc., a subsidiary of United States Metal Powders, Inc., inaugurated a new production line for nodular and spherical aluminum powder at its facility in Palmerton, Pennsylvania, to address demand in the domestic additive manufacturing sector.
Dive into Technavio’s robust research methodology, blending expert interviews, extensive data synthesis, and validated models for unparalleled Aluminum Powders, Pastes, And Flakes Market insights. See full methodology.
| Market Scope | |
|---|---|
| Page number | 304 |
| Base year | 2025 |
| Historic period | 2020-2024 |
| Forecast period | 2026-2030 |
| Growth momentum & CAGR | Accelerate at a CAGR of 4.9% |
| Market growth 2026-2030 | USD 1104.8 million |
| Market structure | Fragmented |
| YoY growth 2025-2026(%) | 4.5% |
| Key countries | China, Japan, India, South Korea, Indonesia, Australia, Germany, UK, France, Italy, The Netherlands, Spain, Saudi Arabia, UAE, South Africa, Turkey, Israel, US, Canada, Mexico, Brazil, Argentina and Chile |
| Competitive landscape | Leading Companies, Market Positioning of Companies, Competitive Strategies, and Industry Risks |
Research Analyst Overview
- The aluminum powders, pastes, and flakes market is characterized by a strategic pivot toward high-value, specialized materials. This shift is driven by the stringent demands of advanced manufacturing sectors. The increasing adoption of powder bed fusion and other additive techniques necessitates high-purity aluminum powder with specific characteristics, such as controlled particle size distribution.
- Innovations in aluminum powder atomization are critical, enabling the production of gas atomized aluminum powder and spherical aluminum powders essential for aerospace and automotive applications. A key boardroom consideration is the capital investment in aluminum flake manufacturing and aluminum nanopowder synthesis versus outsourcing, a decision influenced by the demand for products like thermal spray powders and metal matrix composites.
- Organizations that have vertically integrated their production of aluminum-silicon alloys (AlSi) report a 20% improvement in material consistency. The market's evolution also encompasses developments in aluminum paste formulation for applications ranging from photovoltaic metallization paste to conductive aluminum pastes.
- This includes a focus on non-leafing aluminum pigments, leafing flake pigments, and surface-treated aluminum flakes for corrosion-resistant coatings and decorative effect pigments. Applications extend to pyrotechnic compositions, solid rocket propellants, powder metallurgy components, and aerated concrete production.
What are the Key Data Covered in this Aluminum Powders, Pastes, And Flakes Market Research and Growth Report?
-
What is the expected growth of the Aluminum Powders, Pastes, And Flakes Market between 2026 and 2030?
-
USD 1.10 billion, at a CAGR of 4.9%
-
-
What segmentation does the market report cover?
-
The report is segmented by End-user (Automotive, Industrial, Aerospace and defense, Construction, and Others), Product (Aluminum paste, Aluminum flakes and flake pigment, and Aluminum powder), Application (Paints and coatings, Chemical processing, Additive manufacturing, and Thermal insulation) and Geography (APAC, Europe, Middle East and Africa, North America, South America)
-
-
Which regions are analyzed in the report?
-
APAC, Europe, Middle East and Africa, North America and South America
-
-
What are the key growth drivers and market challenges?
-
Integration of additive manufacturing and advanced aerospace engineering, Technological obstacles in nano-powder stabilization and safety protocols
-
-
Who are the major players in the Aluminum Powders, Pastes, And Flakes Market?
-
Alcoa Corp., Altana AG, AMG Aluminum, Arasan Aluminium Industries, Asahi Kasei Corp., AVL Metal Powders NV, BASF SE, Carlfors Bruk AB, CNPC Powder Group Co. Ltd., ECKART GmbH, Hoganas AB, Kymera International, Metaflake Ltd., Metal Powder Company Limited, MMP Industries Ltd., Novamet Specialty Products Corp, SCHLENK SE, Silberline Manufacturing Co Inc, Sun Chemical Corp. and United Co. RUSAL
-
Market Research Insights
- The market is defined by a dynamic interplay of innovation and industrial demand. The adoption of advanced pyrotechnics and binder jetting technology is enhancing manufacturing capabilities, with some firms reporting a 25% reduction in production cycle times. Concurrently, the focus on sustainable pigment solutions and circular economy in metals is reshaping material sourcing.
- The transition to water-borne paste systems from traditional solvent-based paste systems is accelerating, driven by regulations that have led to a 40% decrease in VOC emissions for compliant manufacturers. This shift requires sophisticated particle morphology control to maintain decorative automotive finishes.
- As a result, the market is characterized by a push for materials that offer both high performance and a reduced environmental footprint, influencing investment in research and development across the value chain.
We can help! Our analysts can customize this aluminum powders, pastes, and flakes market research report to meet your requirements.
 RIA -
RIA - 
