AMT In Commercial Vehicles Market Analysis, Size, and Forecast 2026-2030: Europe (Germany, UK, and France), North America (US, Canada, and Mexico), APAC (China, Japan, and India), South America (Brazil, Argentina, and Colombia), Middle East and Africa (South Africa, Saudi Arabia, and UAE), and Rest of World (ROW)

AMT In Commercial Vehicles Market Analysis, Size, and Forecast 2026-2030:
Europe (Germany, UK, and France), North America (US, Canada, and Mexico), APAC (China, Japan, and India), South America (Brazil, Argentina, and Colombia), Middle East and Africa (South Africa, Saudi Arabia, and UAE), and Rest of World (ROW)

Published: Dec 2025 302 Pages SKU: IRTNTR80132

Market Overview at a Glance

$1.35 B
Market Opportunity
5.1%
CAGR 2025 - 2030
48.5%
Europe Growth
$4.05 B
OEM segment 2024

AMT In Commercial Vehicles Market Size 2026-2030

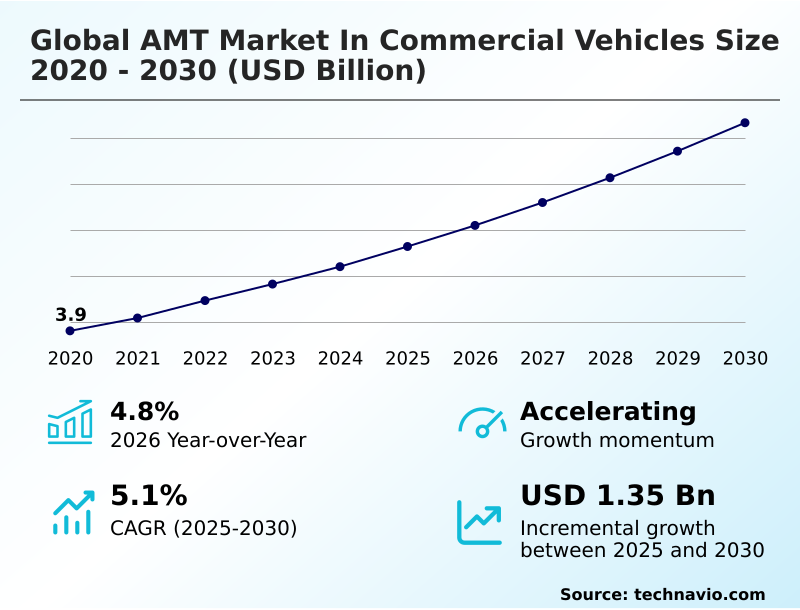
The amt in commercial vehicles market size is valued to increase by USD 1.35 billion, at a CAGR of 5.1% from 2025 to 2030. Enhanced fuel efficiency will drive the amt in commercial vehicles market.

Major Market Trends & Insights

  • Europe dominated the market and accounted for a 48.5% growth during the forecast period.
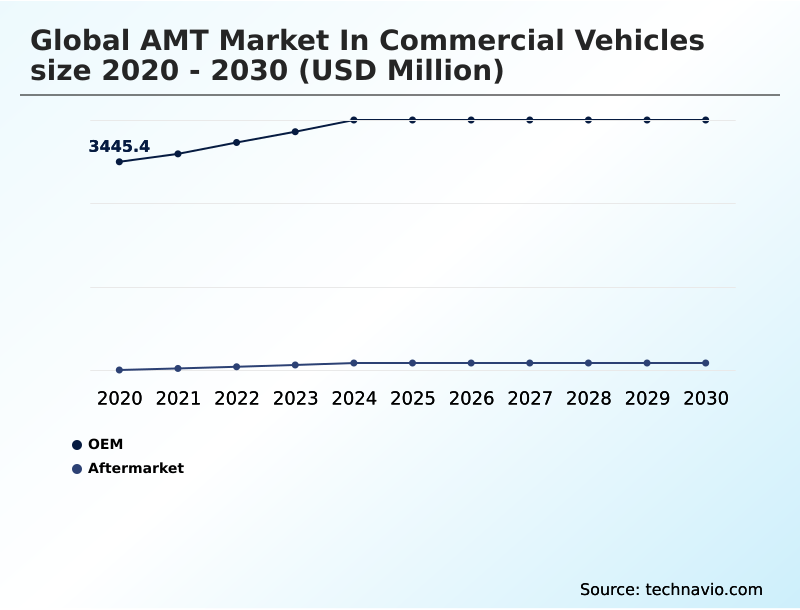
  • By Type - OEM segment was valued at USD 4.05 billion in 2024
  • By Vehicle Type - Light commercial vehicles segment accounted for the largest market revenue share in 2024

Market Size & Forecast

  • Market Opportunities: USD 2.27 billion
  • Market Future Opportunities: USD 1.35 billion
  • CAGR from 2025 to 2030 : 5.1%

Market Summary

  • The AMT market in commercial vehicles is defined by the advancement of powertrain technology that merges manual gearbox efficiency with automatic convenience. At its core, an automated manual transmission utilizes an electronic control unit to manage a clutch actuator and gear shift actuator, eliminating manual driver input. This shift towards automation enhances overall powertrain performance.
  • The technology's relevance is propelled by the need for greater operational efficiency. For instance, a logistics company can leverage systems with predictive shifting to reduce fuel consumption across its fleet, as the transmission software communicates with the engine management system for optimized gear selection. This not only lowers operational costs but also reduces driveline component wear.
  • Innovations are pushing the industry from hydraulic actuation toward more precise electro-mechanical actuation. The sophisticated transmission control unit uses complex algorithms to deliver superior torque management, improving drivability in both long-haul and urban-centric commercial vehicles.
  • Despite challenges like initial costs, the long-term benefits in fuel savings, reduced emissions, and improved driver ergonomics continue to drive adoption, making it a cornerstone of modern commercial vehicle design and fleet management strategies.

What will be the Size of the AMT In Commercial Vehicles Market during the forecast period?

Get Key Insights on Market Forecast (PDF) Request Free Sample

How is the AMT In Commercial Vehicles Market Segmented?

The amt in commercial vehicles industry research report provides comprehensive data (region-wise segment analysis), with forecasts and estimates in "USD million" for the period 2026-2030, as well as historical data from 2020-2024 for the following segments.

  • Type
    • OEM
    • Aftermarket
  • Vehicle type
    • Light commercial vehicles
    • Medium and heavy commercial vehicles
  • Category
    • Between 10 to 12 gears
    • Between 6 to 8 gears
    • Equal to 16 gears and above
    • Others
  • Geography
    • Europe
      • Germany
      • UK
      • France
    • North America
      • US
      • Canada
      • Mexico
    • APAC
      • China
      • Japan
      • India
    • South America
      • Brazil
      • Argentina
      • Colombia
    • Middle East and Africa
      • South Africa
      • Saudi Arabia
      • UAE
    • Rest of World (ROW)

By Type Insights

The oem segment is estimated to witness significant growth during the forecast period.

The Original Equipment Manufacturer (OEM) segment is central to the market, focusing on the factory integration of automated manual transmission systems into new commercial vehicles.

This approach to powertrain technology ensures optimal powertrain calibration and seamless functionality within the vehicle's drivetrain system.

Manufacturers are increasingly making heavy-duty transmission options with automated gear shifting a standard feature to meet demand for fleet modernization and enhanced operational ergonomics. This integration supports intelligent transport systems and future vehicle-to-everything communication, contributing to logistics optimization.

Real-world validation shows these systems can improve fuel consumption by 4-7%. The direct installation by OEMs guarantees that the complex gearbox mechanics are perfectly harmonized with the overall vehicle propulsion solutions, a critical factor for long-term performance.

Request Free Sample

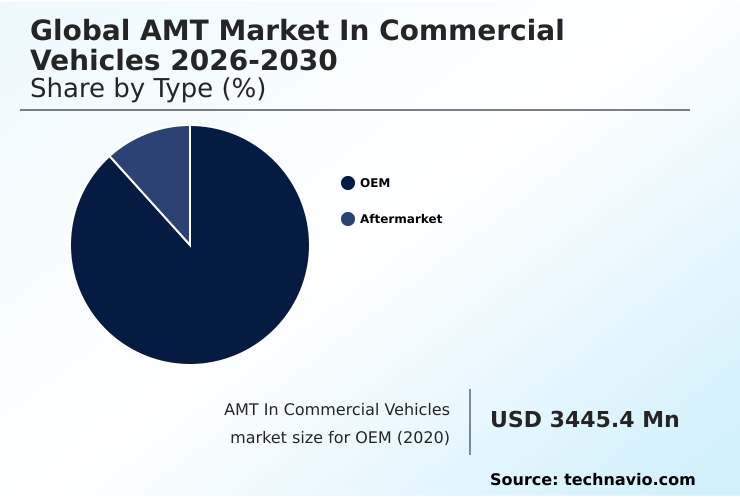
The OEM segment was valued at USD 4.05 billion in 2024 and showed a gradual increase during the forecast period.

Request Free Sample

Regional Analysis

Europe is estimated to contribute 48.5% to the growth of the global market during the forecast period.Technavio’s analysts have elaborately explained the regional trends and drivers that shape the market during the forecast period.

See How AMT In Commercial Vehicles Market Demand is Rising in Europe Request Free Sample

The market landscape shows distinct regional adoption patterns. Europe leads, accounting for 48.46% of incremental growth, driven by stringent regulations on real-world driving emissions and a focus on commercial vehicle safety.

North America is rapidly catching up, with a high adoption rate in the heavy-duty transmission sector for logistics optimization. In APAC, adoption is accelerating, particularly for urban delivery vehicle fleets where automated clutch system technology proves beneficial.

Advanced powertrain technology, including predictive powertrain control, is key across all regions for achieving gear ratio optimization.

The integration of dual-clutch transmission concepts and the future of powertrain electrification are influencing regional strategies, while the maintenance of driveline components remains a universal operational focus.

Market Dynamics

Our researchers analyzed the data with 2025 as the base year, along with the key drivers, trends, and challenges. A holistic analysis of drivers will help companies refine their marketing strategies to gain a competitive advantage.

  • Analyzing the Global AMT Market In Commercial Vehicles 2026-2030 requires a deep dive into specific use cases and technological nuances. A frequent point of discussion is the comparison of amt vs fully automatic transmissions, where AMTs often provide a better balance of efficiency and cost.
  • The role of amt in heavy-duty long-haul trucking is particularly significant, as its fuel efficiency benefits of amt technology directly impact profitability on long routes. For another segment, amt systems for urban delivery vehicles are gaining traction due to the impact of amt on commercial vehicle driver fatigue in stop-and-go traffic.
  • In fact, fleets adopting these systems for urban routes have noted up to a 15% reduction in minor incidents related to driver distraction, enhancing supply chain reliability. However, operators must consider the maintenance costs of automated manual transmissions. The debate over electro-mechanical vs hydraulic amt actuators continues, with newer systems favoring the former for precision.
  • As adoption grows, so does the need for effective training programs for amt-equipped truck drivers and aftermarket amt conversion kits for trucks. The ability of an AMT to perform on steep grade terrain is a critical performance metric, as is its role in meeting vehicle emission standards.
  • Furthermore, optimizing amt performance in vocational trucks and understanding how amt systems improve passenger bus comfort are key considerations. For fleet managers, a thorough total cost of ownership analysis for amt fleets is essential before investment. The future will likely see software upgrades for amt predictive shifting and next-generation amt for electric commercial vehicles, further expanding their application and utility.

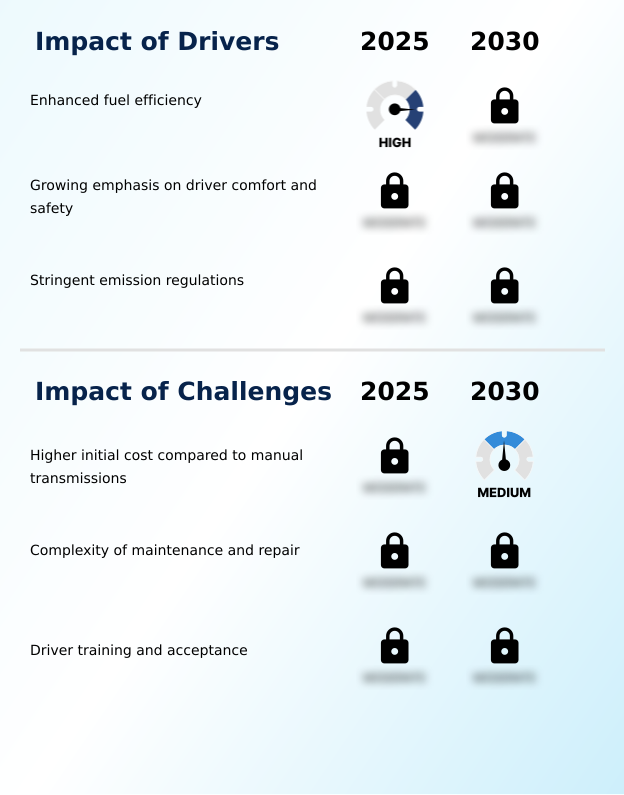
What are the key market drivers leading to the rise in the adoption of AMT In Commercial Vehicles Industry?

  • Enhanced fuel efficiency, which directly reduces operational costs for fleet operators, stands out as the primary driver for the adoption of automated manual transmissions in commercial vehicles.

  • The primary driver is fuel efficiency optimization, with advanced systems delivering a 4-7% improvement in consumption through optimized gear selection. This directly supports operational cost reduction and a lower total cost of ownership for the road freight transport sector.
  • Enhanced powertrain performance, achieved by interfacing with the engine management system for superior torque management, is another key factor. These systems represent a critical emission reduction technology.
  • Moreover, improved driveline efficiency and features like clutch wear compensation and hill start aid enhance the driving experience, supporting driver retention strategies.
  • A less fatigued driver is also linked to a 20% decrease in critical safety events, reinforcing the technology's value beyond just financial metrics.

What are the market trends shaping the AMT In Commercial Vehicles Industry?

  • A key market trend is the increasing integration of automated manual transmissions with advanced driver-assistance systems (ADAS), creating a synergistic relationship to enhance vehicle safety and operational efficiency.

  • Key trends are reshaping commercial vehicle dynamics, led by the integration of advanced driver-assistance systems which enables sophisticated predictive shifting. This synergy improves the vehicle's shift logic algorithm and elevates vehicle automation levels. The move towards electro-mechanical actuation in multi-speed transmission designs offers response times up to 40% faster than older systems, enhancing performance.
  • Furthermore, a focus on modular powertrain platforms simplifies manufacturing and supports easier updates to transmission software and the transmission control unit. These platforms improve supply chain logistics for manufacturers. Such advancements, including refined creep mode functionality, not only boost efficiency but also contribute significantly to driver fatigue reduction, a critical factor in today's transport industry.

What challenges does the AMT In Commercial Vehicles Industry face during its growth?

  • The higher initial acquisition cost of automated manual transmissions compared to traditional manual gearboxes remains a significant challenge affecting broader market adoption.

  • A key challenge is the higher initial cost, which can be 10-15% more than manual equivalents, impacting procurement decisions for some fleets. Maintenance complexity for systems involving components like the electronic control unit, clutch actuator, and gear shift actuator—whether using pneumatic actuation or hydraulic actuation—also presents a hurdle.
  • Servicing a powershift transmission requires specialized diagnostic tools and technician training, affecting vehicle uptime. This is particularly relevant for long-haul trucking efficiency and specialized vocational vehicle application where reliability is paramount. Integrating preventive maintenance schedules through fleet management systems is crucial.
  • While transmission sensors provide valuable data, misinterpretation without proper training can lead to inefficient operation, initially offsetting some performance gains.

Exclusive Technavio Analysis on Customer Landscape

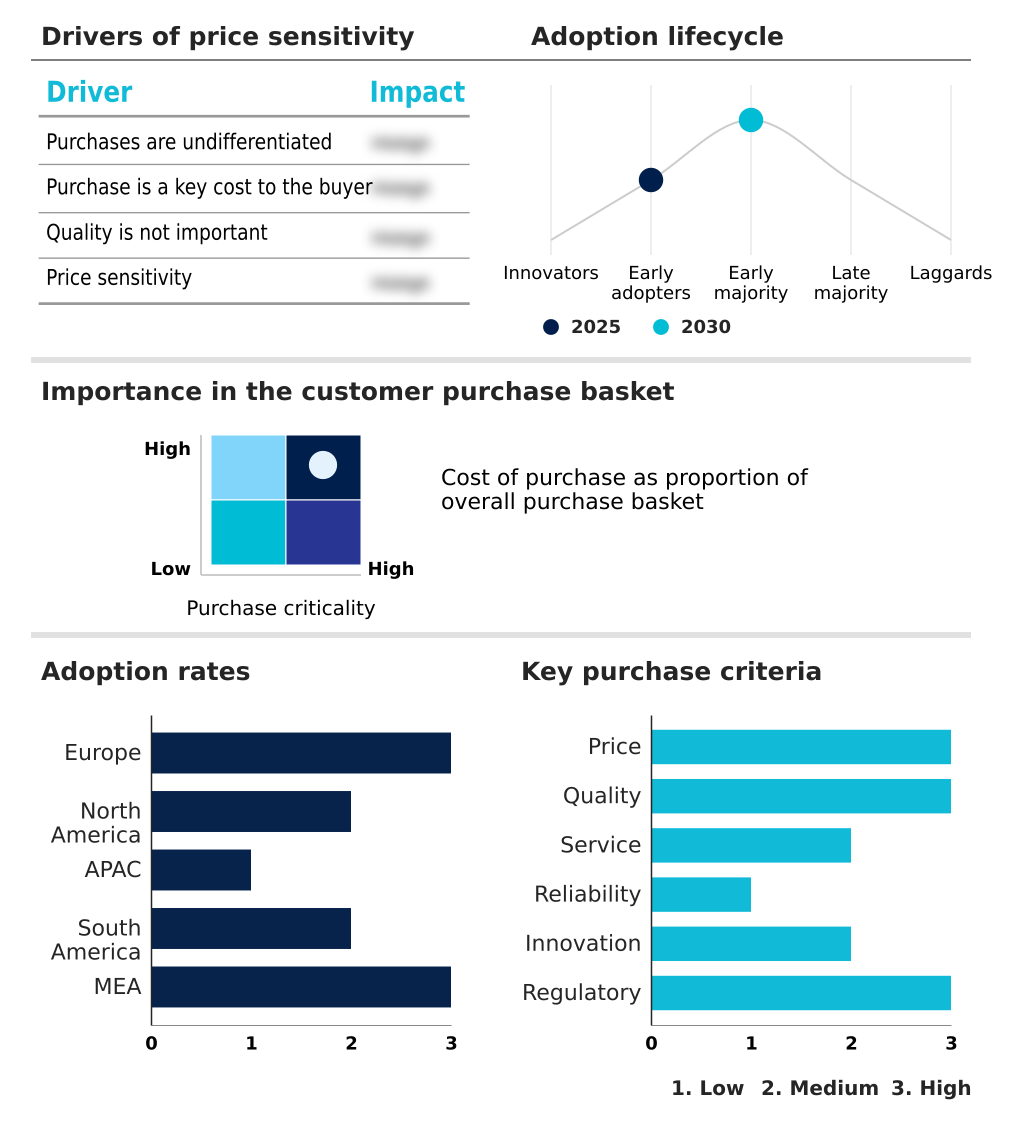
The amt in commercial vehicles market forecasting report includes the adoption lifecycle of the market, covering from the innovator’s stage to the laggard’s stage. It focuses on adoption rates in different regions based on penetration. Furthermore, the amt in commercial vehicles market report also includes key purchase criteria and drivers of price sensitivity to help companies evaluate and develop their market growth analysis strategies.

Customer Landscape of AMT In Commercial Vehicles Industry

Competitive Landscape

Companies are implementing various strategies, such as strategic alliances, amt in commercial vehicles market forecast, partnerships, mergers and acquisitions, geographical expansion, and product/service launches, to enhance their presence in the industry.

AB Volvo - Key offerings include advanced automated manual transmissions, with specialized systems for heavy-duty trucks and light commercial vehicles, enhancing powertrain efficiency and overall vehicle performance.

The industry research and growth report includes detailed analyses of the competitive landscape of the market and information about key companies, including:

  • AB Volvo
  • AISIN Corp.
  • Allison Transmission Holdings Inc.
  • BorgWarner Inc.
  • Carraro SpA
  • Chery Commercial Co. Ltd.
  • Dana Inc.
  • Detroit Diesel Corp.
  • Eaton Corp. Plc
  • Eaton Cummins LLC
  • HYUNDAI TRANSYS
  • Mercedes Benz Group AG
  • Robert Bosch GmbH
  • SAIC Motor Corp. Ltd.
  • Scania AB
  • Schaeffler AG
  • Tsingshan Holding Group Co. Ltd.
  • Volkswagen Group
  • Wuling Motors Holdings Ltd.
  • ZF Friedrichshafen AG

Qualitative and quantitative analysis of companies has been conducted to help clients understand the wider business environment as well as the strengths and weaknesses of key industry players. Data is qualitatively analyzed to categorize companies as pure play, category-focused, industry-focused, and diversified; it is quantitatively analyzed to categorize companies as dominant, leading, strong, tentative, and weak.

Recent Development and News in Amt in commercial vehicles market

  • In March 2025, Eaton Cummins LLC announced a collaboration with a leading logistics software firm to integrate predictive cruise control data directly into its Endurant HD transmission logic, aiming to improve fuel efficiency by an additional 2%.
  • In January 2025, ZF Friedrichshafen AG launched its next-generation TraXon Modular+ automated manual transmission, featuring a new electro-mechanical actuation system designed for electric heavy-duty commercial vehicles.
  • In November 2024, BorgWarner Inc. confirmed the expansion of its production facility in Mexico to manufacture advanced clutch modules for AMTs, specifically targeting the growing North American light commercial vehicle market.
  • In September 2024, AB Volvo initiated a comprehensive driver training program across its North American dealer network, focusing on maximizing the efficiency and safety benefits of its I-Shift AMT system.

Dive into Technavio’s robust research methodology, blending expert interviews, extensive data synthesis, and validated models for unparalleled AMT In Commercial Vehicles Market insights. See full methodology.

Market Scope
Page number 302
Base year 2025
Historic period 2020-2024
Forecast period 2026-2030
Growth momentum & CAGR Accelerate at a CAGR of 5.1%
Market growth 2026-2030 USD 1353.8 million
Market structure Fragmented
YoY growth 2025-2026(%) 4.8%
Key countries Germany, UK, France, Italy, Spain, The Netherlands, US, Canada, Mexico, China, Japan, India, South Korea, Australia, Indonesia, Brazil, Argentina, Colombia, South Africa, Saudi Arabia, UAE, Nigeria and Turkey
Competitive landscape Leading Companies, Market Positioning of Companies, Competitive Strategies, and Industry Risks

Request Free Sample

Research Analyst Overview

  • The evolution of powertrain technology is fundamentally reshaping commercial vehicle propulsion solutions, with the automated manual transmission at the forefront. This system's intricate gearbox mechanics, managed by an electronic control unit and transmission sensors, deliver superior driveline efficiency. The shift logic algorithm enables automated gear shifting, optimizing powertrain performance through precise clutch engagement control and torque management.
  • The move from pneumatic actuation and hydraulic actuation to advanced electro-mechanical actuation marks a significant leap in precision for both the clutch actuator and gear shift actuator. For boardroom consideration, the integration of predictive powertrain control, which facilitates predictive shifting based on topographical data, directly impacts capital budgeting for fleet upgrades and ESG reporting.
  • Fleets leveraging this technology report over 30% reduction in unscheduled maintenance on driveline components. With features like clutch wear compensation, hill start aid, and creep mode functionality, the modern heavy-duty transmission enhances the overall drivetrain system.
  • Advancements in transmission software ensure optimized gear selection and gear ratio optimization in multi-speed transmission designs, including powershift transmission and dual-clutch transmission concepts, moving beyond the traditional torque converter to offer a more direct and efficient automated clutch system.

What are the Key Data Covered in this AMT In Commercial Vehicles Market Research and Growth Report?

  • What is the expected growth of the AMT In Commercial Vehicles Market between 2026 and 2030?

    • USD 1.35 billion, at a CAGR of 5.1%

  • What segmentation does the market report cover?

    • The report is segmented by Type (OEM, and Aftermarket), Vehicle Type (Light commercial vehicles, and Medium and heavy commercial vehicles), Category (Between 10 to 12 gears, Between 6 to 8 gears, Equal to 16 gears and above, and Others) and Geography (Europe, North America, APAC, South America, Middle East and Africa)

  • Which regions are analyzed in the report?

    • Europe, North America, APAC, South America and Middle East and Africa

  • What are the key growth drivers and market challenges?

    • Enhanced fuel efficiency, Higher initial cost compared to manual transmissions

  • Who are the major players in the AMT In Commercial Vehicles Market?

    • AB Volvo, AISIN Corp., Allison Transmission Holdings Inc., BorgWarner Inc., Carraro SpA, Chery Commercial Co. Ltd., Dana Inc., Detroit Diesel Corp., Eaton Corp. Plc, Eaton Cummins LLC, HYUNDAI TRANSYS, Mercedes Benz Group AG, Robert Bosch GmbH, SAIC Motor Corp. Ltd., Scania AB, Schaeffler AG, Tsingshan Holding Group Co. Ltd., Volkswagen Group, Wuling Motors Holdings Ltd. and ZF Friedrichshafen AG

Market Research Insights

  • Market dynamics are increasingly shaped by a focus on total cost of ownership and driver retention strategies. The adoption of advanced commercial vehicle dynamics through automated systems is a key lever for achieving operational cost reduction.
  • Fleets implementing this technology report not only fuel efficiency optimization of 4-7% but also a significant extension of driveline component life by over 50% due to reduced driveline wear reduction. Furthermore, the technology’s contribution to driver fatigue reduction is a critical factor in improving commercial vehicle safety and supporting fleet modernization efforts.
  • The integration with fleet management systems provides actionable data, enabling proactive preventive maintenance and enhancing logistics optimization across the supply chain, which in turn boosts overall vehicle uptime.

We can help! Our analysts can customize this amt in commercial vehicles market research report to meet your requirements.

Get in touch

1. Executive Summary

1.1 Market overview

Executive Summary - Chart on Market Overview
Executive Summary - Data Table on Market Overview
Executive Summary - Chart on Global Market Characteristics
Executive Summary - Chart on Market by Geography
Executive Summary - Chart on Market Segmentation by Type
Executive Summary - Chart on Market Segmentation by Vehicle Type
Executive Summary - Chart on Market Segmentation by Category
Executive Summary - Chart on Incremental Growth
Executive Summary - Data Table on Incremental Growth
Executive Summary - Chart on Company Market Positioning

2. Technavio Analysis

2.1 Analysis of price sensitivity, lifecycle, customer purchase basket, adoption rates, and purchase criteria

2.2 Criticality of inputs and Factors of differentiation

Chart on Overview on criticality of inputs and factors of differentiation

2.3 Factors of disruption

Chart on Overview on factors of disruption

2.4 Impact of drivers and challenges

Chart on Impact of drivers and challenges in 2025 and 2030

3. Market Landscape

3.1 Market ecosystem

Chart on Parent Market
Data Table on - Parent Market

3.2 Market characteristics

Chart on Market characteristics analysis

3.3 Value chain analysis

Chart on Value chain analysis

4. Market Sizing

4.1 Market definition

Data Table on Offerings of companies included in the market definition

4.2 Market segment analysis

Market segments

4.3 Market size 2025

4.4 Market outlook: Forecast for 2025-2030

Chart on Global - Market size and forecast 2025-2030 ($ million)
Data Table on Global - Market size and forecast 2025-2030 ($ million)
Chart on Global Market: Year-over-year growth 2025-2030 (%)
Data Table on Global Market: Year-over-year growth 2025-2030 (%)

5. Historic Market Size

5.1 Global AMT Market In Commercial Vehicles 2020 - 2024

Historic Market Size - Data Table on Global AMT Market In Commercial Vehicles 2020 - 2024 ($ million)

5.2 Type segment analysis 2020 - 2024

Historic Market Size - Type Segment 2020 - 2024 ($ million)

5.3 Vehicle Type segment analysis 2020 - 2024

Historic Market Size - Vehicle Type Segment 2020 - 2024 ($ million)

5.4 Category segment analysis 2020 - 2024

Historic Market Size - Category Segment 2020 - 2024 ($ million)

5.5 Geography segment analysis 2020 - 2024

Historic Market Size - Geography Segment 2020 - 2024 ($ million)

5.6 Country segment analysis 2020 - 2024

Historic Market Size - Country Segment 2020 - 2024 ($ million)

6. Qualitative Analysis

6.1 Impact of AI on global AMT market in commercial vehicles

7. Five Forces Analysis

7.1 Five forces summary

Five forces analysis - Comparison between 2025 and 2030

7.2 Bargaining power of buyers

Bargaining power of buyers - Impact of key factors 2025 and 2030

7.3 Bargaining power of suppliers

Bargaining power of suppliers - Impact of key factors in 2025 and 2030

7.4 Threat of new entrants

Threat of new entrants - Impact of key factors in 2025 and 2030

7.5 Threat of substitutes

Threat of substitutes - Impact of key factors in 2025 and 2030

7.6 Threat of rivalry

Threat of rivalry - Impact of key factors in 2025 and 2030

7.7 Market condition

Chart on Market condition - Five forces 2025 and 2030

8. Market Segmentation by Type

8.1 Market segments

Chart on Type - Market share 2025-2030 (%)
Data Table on Type - Market share 2025-2030 (%)

8.2 Comparison by Type

Chart on Comparison by Type
Data Table on Comparison by Type

8.3 OEM - Market size and forecast 2025-2030

Chart on OEM - Market size and forecast 2025-2030 ($ million)
Data Table on OEM - Market size and forecast 2025-2030 ($ million)
Chart on OEM - Year-over-year growth 2025-2030 (%)
Data Table on OEM - Year-over-year growth 2025-2030 (%)

8.4 Aftermarket - Market size and forecast 2025-2030

Chart on Aftermarket - Market size and forecast 2025-2030 ($ million)
Data Table on Aftermarket - Market size and forecast 2025-2030 ($ million)
Chart on Aftermarket - Year-over-year growth 2025-2030 (%)
Data Table on Aftermarket - Year-over-year growth 2025-2030 (%)

8.5 Market opportunity by Type

Market opportunity by Type ($ million)
Data Table on Market opportunity by Type ($ million)

9. Market Segmentation by Vehicle Type

9.1 Market segments

Chart on Vehicle Type - Market share 2025-2030 (%)
Data Table on Vehicle Type - Market share 2025-2030 (%)

9.2 Comparison by Vehicle Type

Chart on Comparison by Vehicle Type
Data Table on Comparison by Vehicle Type

9.3 Light commercial vehicles - Market size and forecast 2025-2030

Chart on Light commercial vehicles - Market size and forecast 2025-2030 ($ million)
Data Table on Light commercial vehicles - Market size and forecast 2025-2030 ($ million)
Chart on Light commercial vehicles - Year-over-year growth 2025-2030 (%)
Data Table on Light commercial vehicles - Year-over-year growth 2025-2030 (%)

9.4 Medium and heavy commercial vehicles - Market size and forecast 2025-2030

Chart on Medium and heavy commercial vehicles - Market size and forecast 2025-2030 ($ million)
Data Table on Medium and heavy commercial vehicles - Market size and forecast 2025-2030 ($ million)
Chart on Medium and heavy commercial vehicles - Year-over-year growth 2025-2030 (%)
Data Table on Medium and heavy commercial vehicles - Year-over-year growth 2025-2030 (%)

9.5 Market opportunity by Vehicle Type

Market opportunity by Vehicle Type ($ million)
Data Table on Market opportunity by Vehicle Type ($ million)

10. Market Segmentation by Category

10.1 Market segments

Chart on Market Segmentation by Category - Market share 2025-2030 (%)
Data Table on Market Segmentation by Category - Market share 2025-2030 (%)

10.2 Comparison by Market Segmentation by Category

Chart on Comparison by Market Segmentation by Category
Data Table on Comparison by Market Segmentation by Category

10.3 Between 10 to 12 gears - Market size and forecast 2025-2030

Chart on Between 10 to 12 gears - Market size and forecast 2025-2030 ($ million)
Data Table on Between 10 to 12 gears - Market size and forecast 2025-2030 ($ million)
Chart on Between 10 to 12 gears - Year-over-year growth 2025-2030 (%)
Data Table on Between 10 to 12 gears - Year-over-year growth 2025-2030 (%)

10.4 Between 6 to 8 gears - Market size and forecast 2025-2030

Chart on Between 6 to 8 gears - Market size and forecast 2025-2030 ($ million)
Data Table on Between 6 to 8 gears - Market size and forecast 2025-2030 ($ million)
Chart on Between 6 to 8 gears - Year-over-year growth 2025-2030 (%)
Data Table on Between 6 to 8 gears - Year-over-year growth 2025-2030 (%)

10.5 Equal to 16 gears and above - Market size and forecast 2025-2030

Chart on Equal to 16 gears and above - Market size and forecast 2025-2030 ($ million)
Data Table on Equal to 16 gears and above - Market size and forecast 2025-2030 ($ million)
Chart on Equal to 16 gears and above - Year-over-year growth 2025-2030 (%)
Data Table on Equal to 16 gears and above - Year-over-year growth 2025-2030 (%)

10.6 Others - Market size and forecast 2025-2030

Chart on Others - Market size and forecast 2025-2030 ($ million)
Data Table on Others - Market size and forecast 2025-2030 ($ million)
Chart on Others - Year-over-year growth 2025-2030 (%)
Data Table on Others - Year-over-year growth 2025-2030 (%)

10.7 Market opportunity by Market Segmentation by Category

Market opportunity by Market Segmentation by Category ($ million)
Data Table on Market opportunity by Market Segmentation by Category ($ million)

11. Customer Landscape

11.1 Customer landscape overview

Analysis of price sensitivity, lifecycle, customer purchase basket, adoption rates, and purchase criteria

12. Geographic Landscape

12.1 Geographic segmentation

Chart on Market share by geography 2025-2030 (%)
Data Table on Market share by geography 2025-2030 (%)

12.2 Geographic comparison

Chart on Geographic comparison
Data Table on Geographic comparison

12.3 Europe - Market size and forecast 2025-2030

Chart on Europe - Market size and forecast 2025-2030 ($ million)
Data Table on Europe - Market size and forecast 2025-2030 ($ million)
Chart on Europe - Year-over-year growth 2025-2030 (%)
Data Table on Europe - Year-over-year growth 2025-2030 (%)
Chart on Regional Comparison - Europe
Data Table on Regional Comparison - Europe

12.3.1 Germany - Market size and forecast 2025-2030

Chart on Germany - Market size and forecast 2025-2030 ($ million)
Data Table on Germany - Market size and forecast 2025-2030 ($ million)
Chart on Germany - Year-over-year growth 2025-2030 (%)
Data Table on Germany - Year-over-year growth 2025-2030 (%)

12.3.2 UK - Market size and forecast 2025-2030

Chart on UK - Market size and forecast 2025-2030 ($ million)
Data Table on UK - Market size and forecast 2025-2030 ($ million)
Chart on UK - Year-over-year growth 2025-2030 (%)
Data Table on UK - Year-over-year growth 2025-2030 (%)

12.3.3 France - Market size and forecast 2025-2030

Chart on France - Market size and forecast 2025-2030 ($ million)
Data Table on France - Market size and forecast 2025-2030 ($ million)
Chart on France - Year-over-year growth 2025-2030 (%)
Data Table on France - Year-over-year growth 2025-2030 (%)

12.3.4 Italy - Market size and forecast 2025-2030

Chart on Italy - Market size and forecast 2025-2030 ($ million)
Data Table on Italy - Market size and forecast 2025-2030 ($ million)
Chart on Italy - Year-over-year growth 2025-2030 (%)
Data Table on Italy - Year-over-year growth 2025-2030 (%)

12.3.5 Spain - Market size and forecast 2025-2030

Chart on Spain - Market size and forecast 2025-2030 ($ million)
Data Table on Spain - Market size and forecast 2025-2030 ($ million)
Chart on Spain - Year-over-year growth 2025-2030 (%)
Data Table on Spain - Year-over-year growth 2025-2030 (%)

12.3.6 The Netherlands - Market size and forecast 2025-2030

Chart on The Netherlands - Market size and forecast 2025-2030 ($ million)
Data Table on The Netherlands - Market size and forecast 2025-2030 ($ million)
Chart on The Netherlands - Year-over-year growth 2025-2030 (%)
Data Table on The Netherlands - Year-over-year growth 2025-2030 (%)

12.4 North America - Market size and forecast 2025-2030

Chart on North America - Market size and forecast 2025-2030 ($ million)
Data Table on North America - Market size and forecast 2025-2030 ($ million)
Chart on North America - Year-over-year growth 2025-2030 (%)
Data Table on North America - Year-over-year growth 2025-2030 (%)
Chart on Regional Comparison - North America
Data Table on Regional Comparison - North America

12.4.1 US - Market size and forecast 2025-2030

Chart on US - Market size and forecast 2025-2030 ($ million)
Data Table on US - Market size and forecast 2025-2030 ($ million)
Chart on US - Year-over-year growth 2025-2030 (%)
Data Table on US - Year-over-year growth 2025-2030 (%)

12.4.2 Canada - Market size and forecast 2025-2030

Chart on Canada - Market size and forecast 2025-2030 ($ million)
Data Table on Canada - Market size and forecast 2025-2030 ($ million)
Chart on Canada - Year-over-year growth 2025-2030 (%)
Data Table on Canada - Year-over-year growth 2025-2030 (%)

12.4.3 Mexico - Market size and forecast 2025-2030

Chart on Mexico - Market size and forecast 2025-2030 ($ million)
Data Table on Mexico - Market size and forecast 2025-2030 ($ million)
Chart on Mexico - Year-over-year growth 2025-2030 (%)
Data Table on Mexico - Year-over-year growth 2025-2030 (%)

12.5 APAC - Market size and forecast 2025-2030

Chart on APAC - Market size and forecast 2025-2030 ($ million)
Data Table on APAC - Market size and forecast 2025-2030 ($ million)
Chart on APAC - Year-over-year growth 2025-2030 (%)
Data Table on APAC - Year-over-year growth 2025-2030 (%)
Chart on Regional Comparison - APAC
Data Table on Regional Comparison - APAC

12.5.1 China - Market size and forecast 2025-2030

Chart on China - Market size and forecast 2025-2030 ($ million)
Data Table on China - Market size and forecast 2025-2030 ($ million)
Chart on China - Year-over-year growth 2025-2030 (%)
Data Table on China - Year-over-year growth 2025-2030 (%)

12.5.2 Japan - Market size and forecast 2025-2030

Chart on Japan - Market size and forecast 2025-2030 ($ million)
Data Table on Japan - Market size and forecast 2025-2030 ($ million)
Chart on Japan - Year-over-year growth 2025-2030 (%)
Data Table on Japan - Year-over-year growth 2025-2030 (%)

12.5.3 India - Market size and forecast 2025-2030

Chart on India - Market size and forecast 2025-2030 ($ million)
Data Table on India - Market size and forecast 2025-2030 ($ million)
Chart on India - Year-over-year growth 2025-2030 (%)
Data Table on India - Year-over-year growth 2025-2030 (%)

12.5.4 South Korea - Market size and forecast 2025-2030

Chart on South Korea - Market size and forecast 2025-2030 ($ million)
Data Table on South Korea - Market size and forecast 2025-2030 ($ million)
Chart on South Korea - Year-over-year growth 2025-2030 (%)
Data Table on South Korea - Year-over-year growth 2025-2030 (%)

12.5.5 Australia - Market size and forecast 2025-2030

Chart on Australia - Market size and forecast 2025-2030 ($ million)
Data Table on Australia - Market size and forecast 2025-2030 ($ million)
Chart on Australia - Year-over-year growth 2025-2030 (%)
Data Table on Australia - Year-over-year growth 2025-2030 (%)

12.5.6 Indonesia - Market size and forecast 2025-2030

Chart on Indonesia - Market size and forecast 2025-2030 ($ million)
Data Table on Indonesia - Market size and forecast 2025-2030 ($ million)
Chart on Indonesia - Year-over-year growth 2025-2030 (%)
Data Table on Indonesia - Year-over-year growth 2025-2030 (%)

12.6 South America - Market size and forecast 2025-2030

Chart on South America - Market size and forecast 2025-2030 ($ million)
Data Table on South America - Market size and forecast 2025-2030 ($ million)
Chart on South America - Year-over-year growth 2025-2030 (%)
Data Table on South America - Year-over-year growth 2025-2030 (%)
Chart on Regional Comparison - South America
Data Table on Regional Comparison - South America

12.6.1 Brazil - Market size and forecast 2025-2030

Chart on Brazil - Market size and forecast 2025-2030 ($ million)
Data Table on Brazil - Market size and forecast 2025-2030 ($ million)
Chart on Brazil - Year-over-year growth 2025-2030 (%)
Data Table on Brazil - Year-over-year growth 2025-2030 (%)

12.6.2 Argentina - Market size and forecast 2025-2030

Chart on Argentina - Market size and forecast 2025-2030 ($ million)
Data Table on Argentina - Market size and forecast 2025-2030 ($ million)
Chart on Argentina - Year-over-year growth 2025-2030 (%)
Data Table on Argentina - Year-over-year growth 2025-2030 (%)

12.6.3 Colombia - Market size and forecast 2025-2030

Chart on Colombia - Market size and forecast 2025-2030 ($ million)
Data Table on Colombia - Market size and forecast 2025-2030 ($ million)
Chart on Colombia - Year-over-year growth 2025-2030 (%)
Data Table on Colombia - Year-over-year growth 2025-2030 (%)

12.7 Middle East and Africa - Market size and forecast 2025-2030

Chart on Middle East and Africa - Market size and forecast 2025-2030 ($ million)
Data Table on Middle East and Africa - Market size and forecast 2025-2030 ($ million)
Chart on Middle East and Africa - Year-over-year growth 2025-2030 (%)
Data Table on Middle East and Africa - Year-over-year growth 2025-2030 (%)
Chart on Regional Comparison - Middle East and Africa
Data Table on Regional Comparison - Middle East and Africa

12.7.1 South Africa - Market size and forecast 2025-2030

Chart on South Africa - Market size and forecast 2025-2030 ($ million)
Data Table on South Africa - Market size and forecast 2025-2030 ($ million)
Chart on South Africa - Year-over-year growth 2025-2030 (%)
Data Table on South Africa - Year-over-year growth 2025-2030 (%)

12.7.2 Saudi Arabia - Market size and forecast 2025-2030

Chart on Saudi Arabia - Market size and forecast 2025-2030 ($ million)
Data Table on Saudi Arabia - Market size and forecast 2025-2030 ($ million)
Chart on Saudi Arabia - Year-over-year growth 2025-2030 (%)
Data Table on Saudi Arabia - Year-over-year growth 2025-2030 (%)

12.7.3 UAE - Market size and forecast 2025-2030

Chart on UAE - Market size and forecast 2025-2030 ($ million)
Data Table on UAE - Market size and forecast 2025-2030 ($ million)
Chart on UAE - Year-over-year growth 2025-2030 (%)
Data Table on UAE - Year-over-year growth 2025-2030 (%)

12.7.4 Nigeria - Market size and forecast 2025-2030

Chart on Nigeria - Market size and forecast 2025-2030 ($ million)
Data Table on Nigeria - Market size and forecast 2025-2030 ($ million)
Chart on Nigeria - Year-over-year growth 2025-2030 (%)
Data Table on Nigeria - Year-over-year growth 2025-2030 (%)

12.7.5 Turkey - Market size and forecast 2025-2030

Chart on Turkey - Market size and forecast 2025-2030 ($ million)
Data Table on Turkey - Market size and forecast 2025-2030 ($ million)
Chart on Turkey - Year-over-year growth 2025-2030 (%)
Data Table on Turkey - Year-over-year growth 2025-2030 (%)

12.8 Market opportunity by geography

Market opportunity by geography ($ million)
Data Tables on Market opportunity by geography ($ million)

13. Drivers, Challenges, and Opportunity

13.1 Market drivers

Enhanced fuel efficiency
Growing emphasis on driver comfort and safety
Stringent emission regulations

13.2 Market challenges

Higher initial cost compared to manual transmissions
Complexity of maintenance and repair
Driver training and acceptance

13.3 Impact of drivers and challenges

Impact of drivers and challenges in 2025 and 2030

13.4 Market opportunities

Integration with advanced driver assistance systems (ADAS)
Rise of electro-mechanical actuation systems
Focus on modularity and platform standardization

14. Competitive Landscape

14.1 Overview

14.2

Overview on criticality of inputs and factors of differentiation

14.3 Landscape disruption

Overview on factors of disruption

14.4 Industry risks

Impact of key risks on business

15. Competitive Analysis

15.1 Companies profiled

Companies covered

15.2 Company ranking index

15.3 Market positioning of companies

Matrix on companies position and classification

15.4 AB Volvo

AB Volvo - Overview
AB Volvo - Business segments
AB Volvo - Key news
AB Volvo - Key offerings
AB Volvo - Segment focus
SWOT

15.5 AISIN Corp.

AISIN Corp. - Overview
AISIN Corp. - Business segments
AISIN Corp. - Key news
AISIN Corp. - Key offerings
AISIN Corp. - Segment focus
SWOT

15.6 Allison Transmission Holdings Inc.

Allison Transmission Holdings Inc. - Overview
Allison Transmission Holdings Inc. - Product / Service
Allison Transmission Holdings Inc. - Key offerings
SWOT

15.7 BorgWarner Inc.

BorgWarner Inc. - Overview
BorgWarner Inc. - Business segments
BorgWarner Inc. - Key news
BorgWarner Inc. - Key offerings
BorgWarner Inc. - Segment focus
SWOT

15.8 Dana Inc.

Dana Inc. - Overview
Dana Inc. - Business segments
Dana Inc. - Key news
Dana Inc. - Key offerings
Dana Inc. - Segment focus
SWOT

15.9 Eaton Corp. Plc

Eaton Corp. Plc - Overview
Eaton Corp. Plc - Business segments
Eaton Corp. Plc - Key news
Eaton Corp. Plc - Key offerings
Eaton Corp. Plc - Segment focus
SWOT

15.10 Eaton Cummins LLC

Eaton Cummins LLC - Overview
Eaton Cummins LLC - Product / Service
Eaton Cummins LLC - Key offerings
SWOT

15.11 HYUNDAI TRANSYS

HYUNDAI TRANSYS - Overview
HYUNDAI TRANSYS - Product / Service
HYUNDAI TRANSYS - Key offerings
SWOT

15.12 Mercedes Benz Group AG

Mercedes Benz Group AG - Overview
Mercedes Benz Group AG - Product / Service
Mercedes Benz Group AG - Key offerings
SWOT

15.13 Robert Bosch GmbH

Robert Bosch GmbH - Overview
Robert Bosch GmbH - Product / Service
Robert Bosch GmbH - Key news
Robert Bosch GmbH - Key offerings
SWOT

15.14 SAIC Motor Corp. Ltd.

SAIC Motor Corp. Ltd. - Overview
SAIC Motor Corp. Ltd. - Business segments
SAIC Motor Corp. Ltd. - Key offerings
SAIC Motor Corp. Ltd. - Segment focus
SWOT

15.15 Scania AB

Scania AB - Overview
Scania AB - Business segments
Scania AB - Key offerings
Scania AB - Segment focus
SWOT

15.16 Schaeffler AG

Schaeffler AG - Overview
Schaeffler AG - Business segments
Schaeffler AG - Key news
Schaeffler AG - Key offerings
Schaeffler AG - Segment focus
SWOT

15.17 Volkswagen Group

Volkswagen Group - Overview
Volkswagen Group - Business segments
Volkswagen Group - Key offerings
Volkswagen Group - Segment focus
SWOT

15.18 ZF Friedrichshafen AG

ZF Friedrichshafen AG - Overview
ZF Friedrichshafen AG - Business segments
ZF Friedrichshafen AG - Key news
ZF Friedrichshafen AG - Key offerings
ZF Friedrichshafen AG - Segment focus
SWOT

16. Appendix

16.1 Scope of the report

Market definition
Objectives
Notes and caveats

16.2 Inclusions and exclusions checklist

Inclusions checklist
Exclusions checklist

16.3 Currency conversion rates for US$

16.4 Research methodology

16.5 Data procurement

Information sources

16.6 Data validation

16.7 Validation techniques employed for market sizing

16.8 Data synthesis

16.9 360 degree market analysis

16.10 List of abbreviations

Research Methodology

Technavio presents a detailed picture of the market by way of study, synthesis, and summation of data from multiple sources. The analysts have presented the various facets of the market with a particular focus on identifying the key industry influencers. The data thus presented is comprehensive, reliable, and the result of extensive research, both primary and secondary.

INFORMATION SOURCES

Primary sources

  • Manufacturers and suppliers
  • Channel partners
  • Industry experts
  • Strategic decision makers

Secondary sources

  • Industry journals and periodicals
  • Government data
  • Financial reports of key industry players
  • Historical data
  • Press releases

DATA ANALYSIS

Data Synthesis

  • Collation of data
  • Estimation of key figures
  • Analysis of derived insights

Data Validation

  • Triangulation with data models
  • Reference against proprietary databases
  • Corroboration with industry experts

REPORT WRITING

Qualitative

  • Market drivers
  • Market challenges
  • Market trends
  • Five forces analysis

Quantitative

  • Market size and forecast
  • Market segmentation
  • Geographical insights
  • Competitive landscape

Interested in this report?

Get your sample now to see our research methodology and insights!

Download Now

Frequently Asked Questions

AMT In Commercial Vehicles market growth will increase by USD 1353.8 million during 2026-2030.

The AMT In Commercial Vehicles market is expected to grow at a CAGR of 5.1% during 2026-2030.

AMT In Commercial Vehicles market is segmented by Type (OEM, Aftermarket) Vehicle type (Light commercial vehicles, Medium and heavy commercial vehicles) Category (Between 10 to 12 gears, Between 6 to 8 gears, Equal to 16 gears and above, Others)

AB Volvo, AISIN Corp., Allison Transmission Holdings Inc., BorgWarner Inc., Carraro SpA, Chery Commercial Co. Ltd., Dana Inc., Detroit Diesel Corp., Eaton Corp. Plc, Eaton Cummins LLC, HYUNDAI TRANSYS, Mercedes Benz Group AG, Robert Bosch GmbH, SAIC Motor Corp. Ltd., Scania AB, Schaeffler AG, Tsingshan Holding Group Co. Ltd., Volkswagen Group, Wuling Motors Holdings Ltd., ZF Friedrichshafen AG are a few of the key vendors in the AMT In Commercial Vehicles market.

Europe will register the highest growth rate of 48.5% among the other regions. Therefore, the AMT In Commercial Vehicles market in Europe is expected to garner significant business opportunities for the vendors during the forecast period.

Germany, UK, France, Italy, Spain, The Netherlands, US, Canada, Mexico, China, Japan, India, South Korea, Australia, Indonesia, Brazil, Argentina, Colombia, South Africa, Saudi Arabia, UAE, Nigeria, Turkey

  • Enhanced fuel efficiency is the driving factor this market.

The AMT In Commercial Vehicles market vendors should focus on grabbing business opportunities from the Type segment as it accounted for the largest market share in the base year.